ATLBS Extended Source Sample: The evolution in radio source morphology with flux density
Abstract
Based on the ATLBS survey we present a sample of extended radio sources and derive morphological properties of faint radio sources. 119 radio galaxies form the ATLBS-Extended Source Sample (ATLBS-ESS) consisting of all sources exceeding 30” in extent and integrated flux densities exceeding 1 mJy. We give structural details along with information on galaxy identifications and source classifications. The ATLBS-ESS, unlike samples with higher flux-density limits, has almost equal fractions of FR-I and FR-II radio galaxies with a large fraction of the FR-I population exhibiting 3C31-type structures. Significant asymmetry in lobe extents appears to be a common occurrence in the ATLBS-ESS FR-I sources compared to FR-II sources. We present a sample of 22 FR-Is at with good structural information. The detection of several giant radio sources, with size exceeding 0.7 Mpc, at suggests that giant radio sources are not less common at high redshifts. The ESS also includes a sample of 28 restarted radio galaxies. The relative abundance of dying and restarting sources is indicative of a model where radio sources undergo episodic activity in which an active phase is followed by a brief dying phase that terminates with restarting of the central activity; in any massive elliptical a few such activity cycles wherein adjacent events blend may constitute the lifetime of a radio source and such bursts of blended activity cycles may be repeated over the age of the host. The ATLBS-ESS includes a 2-Mpc giant radio galaxy with the lowest surface brightness lobes known to date.
1 Introduction
Sensitive radio surveys have a key role in cosmology, resting on their ability to detect faint radio sources reaching down to sub-milliJansky flux densities and thereby representing a chronicle of the evolution in active galaxies across Hubble time. Radio source structures are rich in information: the extended structures serve as indicators of relativistic jet-type activity in AGNs; additionally, their morphology is related to the temporal behavior of the jet activity, and the ambient interstellar and intergalactic environment in which they deposit their energy. AGN activity triggered by mergers and the accretion of intergalactic baryons may well be a phase in the lives of most luminous galaxies. Radio galaxies and quasars with extended structures represent circumstances in which there is obvious kinetic mode energetic impact of the AGN on the environment and, therefore, radio surveys represent an opportunity for examining the role of such AGN feedback on galaxy evolution.
In most sensitive radio surveys there is often incomplete structural information because of limited surface brightness sensitivity, and consequently the relatively faint and diffuse emission components are often unrepresented. In view of the potential missing structural information on faint radio sources as well as the puzzling paucity of relic radio sources we embarked on a sensitive radio survey that was designed to achieve high radio surface-brightness sensitivity. The Australia Telescope Low Brightness Survey (ATLBS; Subrahmanyan et al. (2010)) was made using the Australia Telescope Compact Array (ATCA) at 1.4 GHz adopting an observing strategy that guarantees imaging over a wide field of view with complete spatial frequency coverage; this ensured the data were not limited by incomplete uv-coverage, dynamic range issues and that the theoretical rms noise sensitivity was achieved. The ATLBS achieved a surface brightness sensitivity that is nearly an order of magnitude lower than previous wide-field surveys.
The ATLBS survey was followed up with imaging in multiple array configurations at 1.4 GHz with the aim of obtaining good structural information on the sources. These data will be presented in Thorat et al. (2011) along with a discussion of the source counts.
Herein we discuss the radio structures of the ATLBS radio sources. We present an extended ATLBS radio source sample (which we refer to as the ATLBS-ESS sample) in which all sources with angular extent larger than about 30 arcsec have been included. A sensitive survey such as the ATLBS that combines high surface brightness sensitivity and angular resolution is expected to reveal a variety of source structures, and provides a sample that reveals the structural variety that is present in the relatively faint radio source population. We present different classes of radio sources as revealed by the ATLBS; with its rich haul of different structural types, our sample is a valuable resource in the study of the life cycles of radio galaxies.
It is well recognized that flux limited radio surveys include powerful radio sources (that invariably have Fanaroff-Riley type-II morphologies; (Fanaroff & Riley, 1974)) to relatively higher redshifts whereas the low power radio sources identified in such surveys are confined to lower redshifts. The dominance of low power sources in the low redshift population is owing to the slope of the radio luminosity function. A consequence of this bias in radio surveys is that population studies of low-luminosity sources have been limited to low redshifts with little known of the relative abundance of this dominant group or of their structures at higher redshifts. A few studies have attempted to extend our knowledge into this space and the general approach has been through radio-optical cross-correlation studies involving deep radio and optical surveys (Clewley & Jarvis, 2004; Snellen & Best, 2003; Sadler et al., 2007; Chiaberge et al., 2009). ATLBS has achieved relatively high radio surface brightness sensitivity and this is important in detecting the faint extended structures in FR-I radio galaxies. Together with excellent imaging of the diffuse structures, we have herein used a more traditional method (using radio source morphologies) to extend the FR-I population study to higher redshifts.
A unique and valuable aspect of the ATLBS survey is that the sky regions have been observed with excellent surface brightness sensitivity at low resolutions, and the wide survey fields have also been followed up with high resolution radio observations. Reliable measures of integrated flux density provided by the low resolution images along with reliable images of structure at higher angular resolution together yield useful estimates of the truly diffuse emission associated with radio sources. For example, if at higher resolution there is a clustering of weak compact components and at lower resolution there is detected a source with substantially greater integrated flux density, a good estimate of the associated diffuse emission is possible. This allows compilation of samples of such radio sources that have substantial associated extended emission components with little compact structure: high resolution interferometer surveys might not only miss the extended emission, but may also misclassify associated compact components as independent sources.
In Section 2 we present an overview of the observations followed by the method adopted for the creation of the ATLBS-ESS. We devote Sections 3 to 4 to a discussion of the relative abundances of different radio source types present in the sample. This characterization of the morphologies of the faint radio sources is followed by discussion and conclusions in Section 5.
We adopt a flat cosmology with Hubble constant H=71 km s Mpc and matter density parameter =0.27.
2 The ATLBS Extended source sample: ATLBS-ESS
The ATLBS radio images were made at 1388 MHz using the Australia Telescope Compact Array (ATCA) by mosaic observing 38 adjacent pointing positions covering about 8.4 square degrees of sky area. The observations were made in a set of array configurations and with sufficiently small dwell time in each pointing position so that the entire survey region is imaged with almost complete visibility coverage up to 750 m. The ATLBS images, with beam FWHM of 50 arcsec and with high surface brightness sensitivity, together with associated high resolution data that were simultaneously available on long baselines to the 6-km antenna, provided a measure of the extended emission associated with the radio source population down to about 0.4 mJy flux density (Subrahmanyan et al., 2010). Important for the present work is the listing provided therein of the integrated flux density in the ATLBS sources along with listings of the flux density associated with compact components.
2.1 Radio and optical data for the ATLBS survey fields
Detailed radio structures of the sources detected in the ATLBS survey were subsequently imaged by combining the visibilities along with additional data obtained using the ATCA in a set of extended 6-km array configurations. Despite the relatively sparse visibility coverage in the outer realms of the visibility plane, the imaging of extended structures was accomplished in a convergent and reliable manner by aiding decovolution in initial self-calibration cycles by restricting the sky area to regions where sources were reliably detected in the high-surface-brightness ATLBS images. The high resolution images of the ATLBS survey regions will be presented in Thorat et al. (2011), along with derived source counts. The synthesized images have a beam of FWHM 6 arcsecs and rms noise of 72 Jy beam. The image quality is excellent in that they have no artifacts apparent above thermal noise.
The survey regions were also imaged in the Ks-band using the IRIS2 imager on the 3.9-m Anglo Australian Telescope (AAT). The ATLBS survey sky area was covered as a mosaic of nearly 700 pointings with median seeing about 1 arcsec. The field centred at RA: 00h35m00s, Dec.: -67 00 00 (J2000.0; field A) was completed barring a few pointings where as the field centred at RA: 00 59 17, Dec.: -67 00 00 (J2000.0; field B) was only partially completed. A completeness down to 19 mag was achieved. The Ks-band images will be presented in an accompanying manuscript (Johnston et al., in preparation).
In addition to observing in Ks-band, the ATLBS survey regions were also observed in optical g, r and z band with the MOSAICII imager on the CTIO NOAO 4-m Blanco telescope. The larger field of view of 37’x37’ meant that the two regions could be covered in fewer pointings. The data reduction of the r-band imaging has been completed and the images have a completeness level to an apparent magnitude of 22.5. Details of the grz-band optical imaging will be presented in a followup publication (Thorat et al., in preparation).
Optical identifications (Id) for the ATLBS-ESS sources were made by examining the r-band images. Where there was no identification in r (either because the area was not covered in the r-band imaging or because there was no object seen at the location of the radio core) or it was uncertain, we examined the Ks band images. In situations where the area was not covered in either r or Ks images we used the B and R-band images from the SuperCOSMOS Sky Survey (Hambly et al., 2001). These identifications are based on all the material available and not just the images shown in the paper. In general the process of identifications ultimately involved examination of the vicinity of the centroid of the radio source in all four optical bands; the information related to this exercise is provided below.
We have an ongoing program for obtaining spectra of the optical identifications for all radio sources in the ATLBS fields using the AAOmega instrument on the AAT. To date 24 sources in the ATLBS-ESS have measured redshifts. Herein we give estimates of redshifts for the remaining sources using the derived r-band magnitude vs redshift relationship when spectra are not available (the details of the methods used for redshift estimates will be given in an accompanying paper: Thorat et al., in preparation). We give these estimated redshifts in brackets to distinguish them from measured values.
2.2 Selection criteria for ATLBS-ESS
ATLBS images made with the synthesized beam of 50 arcsec were used as the basic resource for compiling the ATLBS-ESS sample. In the two, 2-deg mosaic images, only ‘islands’ of image pixels with peaks exceeding five times the image rms noise were considered. As described in Subrahmanyan et al. (2010), the integrated flux density in compact components within these source islands were computed from images made with 4-arcsec FWHM beam using exclusively interferometer baselines to the 6 km antenna (so that extended emission was intentionally filtered out). A first list of candidate sources was created by including only those ‘islands’ that had a ratio of integrated flux density to that in compact components larger than or equal to 1.5. These sources potentially have extended emission that is more than half the flux density in the compact components. At relatively higher values for the ratio, selected sources have substantial low surface brightness diffuse emission with little fine structure. This list was generated by an automated algorithm that scanned the 50 and 4 arcsec images. It may be noted here that this automated procedure was only applied to the sky regions in the mosaic image that were observed with effective primary beam attenuation within 0.5, which excluded the outer parts of the images.
The radio structures of the ATLBS sources are best represented in 6 arcsec beam FWHM images that were made by Thorat et al. (2011). Separately, these images, including their outer parts, were carefully examined by eye to identify extended radio sources. This ‘second pass’ over the survey regions was aimed at including any additional sources that may have been missed by the automated search algorithm. Within the regions scanned by the automated algorithm, the examination by eye did not yield any additional extended radio sources, giving confidence in the completeness of the selection process. However in this step we recognized 58 extended radio sources in the outer regions of the ATLBS survey and included them as well for the analyses and considerations presented herein. Additionally, examination by eye identified sources that were blended together in the 50 arcsec resolution images: these were thereafter considered as separate sources.
The images with beam FWHM of 6 arcsec were convolved to a final beam of 10 arcsec, and as a final filter only those extended radio sources that were clearly resolved with at least three beams across were retained. The convolution improved the surface brightness sensitivity of the images, thereby improving the ability to detect diffuse emission. This criterion corresponds approximately to restricting the ATLBS-ESS sample to sources with angular size exceeding 30 arcsec.
Table 1 presents this sub-sample of extended ATLBS sources. It contains 119 sources and the minimum integrated flux density of sources in this sub-sample is 1 mJy at 1.4 GHz. The Table includes information on the radio structural properties based on the examination of the radio images by eye, and estimates of the angular extents (Column 3). The angular sizes were measured along the maximum extent of the source between the 3-sigma contours in the 10” maps. We also give the total and fractional core flux densities (Column 5 and 6 respectively) as well as source classification (Column 7). Details of the flux density measurements will be given in Thorat et al. (2011). In several FR-I sources although cores are the brightest components the fractional core flux densities are upper limits because of blending with surrounding emission. Where possible, the radio source position is taken from the position of the r-band optical identification. Where the r-band identification is not available or doubtful the coordinates assigned to the radio source is that of the identification in Ks-band, or B or R band; in cases where there is no optical identification available, on the radio core position and in the absence of radio cores we use the radio centroid position from the original 50” image. Additionally, the Table includes information on the optical identifications, measured r-band magnitudes, measured and inferred redshifts (given in brackets) as well as any information on their galaxy environments based on examination of the optical fields. As the Ks band imaging has covered field B only partially the information on K-band identifications for sources in this field is given only where available.
The images of the 119 ATLBS-ESS sources are presented in Figs 1—119. The choice of the contours and image resolutions was made with a view to reveal structures of the faint emission regions present in several of the sources.
The remaining extended radio sources that have no recognizable extended structure and are mostly composed of well resolved diffuse emission have not been included in this sub-sample. These 23 sources are discussed separately in Section 4.6.
There are 11 radio galaxies in the ATLBS-ESS that have estimated projected linear sizes in excess of 700 kpc and hence are classified as giant radio sources. Nine of these giant radio galaxies are at photometric redshifts . Additionally, there are another 3 candidate giant radio sources that have large angular sizes (exceeding 84 arcsec). These have faint optical hosts and their r-band magnitudes could not be reliably determined; nevertheless, the faintness of the host galaxy suggests that they are likely to be located at redshifts . The ATLBS-ESS giant radio galaxies are listed in Table 3.
| Name | RA | LAS(″) | Fig. | Type | Comments | ||
|---|---|---|---|---|---|---|---|
| Dec | Morph. | No. | mJy | / | |||
| J0022.1-6705* | 00:22:09.60 | 46 | 1 | 9.7 | 0.26 | Bright B, R, K id. | |
| -67:05:10.3 | HT | r-band NA. In cluster. | |||||
| J0022.7-6652 | 00:22:44.98 | 102 | 2 | 4.9 | 0.29 | RS | z=0.234, r=18.48. Extended core and, |
| -66:53:05.2 | FR-II | faint detached outer extensions. | |||||
| Bright B, R, K, r id. Neighbors. | |||||||
| J0023.6-6710 | 00:23:44.51 | 84 | 3 | 28.1 | 0.09 | RS | z=(1.41), r=22.67. Triple. Faint K, r id. |
| -67:11:07.9 | FR-II | GRG | Prominent core. Galaxy group | ||||
| associated with NW lobe; | |||||||
| Lobe confused with group emission. | |||||||
| J0024.4-6636* | 00:24:26.77 | 150 | 5 | 13.8 | 0.16 | RS | z=(0.21), r=17.92. Bright core with two |
| -66:36:12.8 | FR-I | extensions. Weak outer lobes. Bright B, | |||||
| R, K, r id. Close companions. Cluster. | |||||||
| J0024.6-6751* | 00:24:41.77 | 36 | 4 | 21.1 | — | K, r-band NA. No core. | |
| -67:51:10.8 | FR-II | No B, R id. 50” centroid position given. | |||||
| J0025.0-6658 | 00:24:59.87 | 50 | 6 | 15.8 | 0.15 | HzFR-I | z=(0.64), r=20.69. Id not the brightest. |
| -66:58:08.1 | WAT | B, R, K, r id. No separate core seen. | |||||
| J0025.2-6701 | 00:25:16.11 | 34 | 7 | 1.2 | 0.14 | Weak, diffuse lobes. | |
| -67:01:32.5 | FR-II | Faint K-only object 3” E of offset | |||||
| core(?) Core position given. | |||||||
| J0025.9-6621* | 00:25:58.59 | 60 | 8 | 215.3 | 0.49 | HzFR-I | Strong core, 2 short |
| -66:21:20.5 | FR-I | extensions. Very faint id only in K, r. | |||||
| J0026.4-6721 | 00:26:28.43 | 30 | 9 | 1.7 | 0.36 | z=0.274, r=18.15. Core and 2 extensions. | |
| -67:21:48.9 | FR-I | Bright id, close companion. | |||||
| J0026.8-6643 | 00:26:49.23 | 72 | 10 | 8.8 | 0.41 | z=(0.21), r=17.96. Core with 2 jets and | |
| -66:44:01.1 | FR-I | fainter extensions. Id in B, R, K, r. | |||||
| J0027.2-6624 | 00:27:15.59 | 252 | 11 | 24.9 | 0.13 | RS | z=0.073, r=15.06. Bright id. |
| -66:24:18.5 | FR-II | Core with jet. Source in cluster. | |||||
| J0028.4-6733* | 00:28:26.47 | 42 | 12 | 18.0 | 0.17 | z=(0.47), r=19.93. B, R, K, r id | |
| -67:33:48.6 | FR-I? | at centre. Lobe peaks well recessed. | |||||
| J0028.9-6809* | 00:28:59.73 | 36 | 13 | 34.9 | 0.23 | z=(0.22), r=18. Extended core. | |
| -68:09:25.6 | FR-I | Bright B, R, K, r id. | |||||
| J0029.0-6755* | 00:29:00.09 | 38 | 14 | 134.0 | 0.73 | HzFR-I | z=1.748, r=20.03. Strong core, 2 short |
| -67:55:50.2 | FR-I | extensions. B, R, K, r id. Quasar. | |||||
| J0028.9-6631 | 00:29:01.89 | 105 | 15 | 9.6 | 0.15 | RS | z=(1.78), r=23.26. Bright core. Detached |
| -66:31:52.8 | FR-II | GRG | lobes. One relic lobe. Faint K, r id | ||||
| in cluster. Galaxy group in NW lobe. | |||||||
| J0030.0-6628 | 00:30:00.67 | 50 | 16 | 3.2 | 0.36 | RS | z=(2.19), r=23.78. Triple, strong core. |
| -66:28:08.9 | FR-II | Relic lobes. K, r id. | |||||
| J0030.0-6604* | 00:30:04.03 | 57 | 17 | 8.9 | 0.08 | Triple. Faint K, r id. | |
| -66:04:43.6 | FR-II | ||||||
| J0030.4-6723 | 00:30:23.26 | 32 | 18 | 6.6 | 0.11 | HzFR-I | Weak core. NE lobe with strong |
| -67:23:17.7 | FR-I | peak. Highly asymmetric source. | |||||
| Very faint r id. | |||||||
| J0030.7-6714* | 00:30:44.92 | 43 | 19 | 12.1 | 0.6 | HzFR-I | z=(0.97), r=21.76. Bright core, |
| -67:14:36.4 | FR-I | 2 extensions. B, R, K, r id. | |||||
| J0030.9-6626* | 00:30:54.12 | 40 | 20 | 36.0 | 0.65 | HzFR-I | z=(2.07), r=23.64. Core, 2 short, |
| -66:26:35.5 | FR-I | broad extensions. Very faint K id. | |||||
| Clearly seen in r. | |||||||
| J0031.0-6744* | 00:31:01.60 | 84 | 21 | 5.51 | — | GRG | z=(1.31), r=22.51. No core. K-band NA. |
| -67:44:42.8 | FR-II | Faint r id. Close companion to N. | |||||
| 2 galaxies along N lobe. | |||||||
| J0031.1-6713 | 00:31:06.63 | 55 | 22 | 54.8 | 0.05 | z=(1.14), r=22.15. | |
| -67:13:49.9 | FR-II | Id in K, r only. Companion in | |||||
| B, R, K, r. | |||||||
| J0031.1-6642* | 00:31:09.01 | 66 | 23 | 7.0 | 0.19 | RS | z=(0.77), r=21.16. Asymmetric, bright |
| -66:42:28.6 | FR-II | compact N lobe and relic to South. | |||||
| Core with B, R, K, r id. | |||||||
| LAS=1.5’ if relic component included. | |||||||
| J0031.3-6657* | 00:31:21.21 | 66 | 24 | 17.7 | 0.02 | Triple. | |
| -66:57:22.8 | FR-II | Faint K, r id at core (?). | |||||
| J0031.5-6748 | 00:31:32.44 | 50 | 25 | 2.2 | 0.2 | RS | z=0.355, r=19.10. Weak core and |
| -67:49:00.5 | FR-I | 2 weak extensions. B, R, K, r id. | |||||
| J0031.8-6727* | 00:31:48.23 | 102 | 26 | 12.7 | 0.18 | RS | z=1.156, r=19.24. Triple. 2.3’ if NE |
| -67:27:17.1 | FR-II | GRG | relic extension included. B, R, K id. | ||||
| J0032.9-6614* | 00:32:57.64 | 32 | 27 | 17.0 | 0.73 | HzFR-I | z=0.915, r=20.79. Bright core and 2 |
| -66:14:18.7 | FR-I | diffuse, short extensions. | |||||
| Bright B, R, K, r id. Quasar. | |||||||
| J0033.4-6714 | 00:33:29.35 | 78 | 28 | 9.5 | 0.21 | z=0.407, r=18.38. Bright core | |
| -67:14:19.3 | FR-I | and jets. Elongated source with | |||||
| constant width.Bright B, R, K, r id. | |||||||
| J0034.0-6639 | 00:34:05.61 | 1020 | 29 | 86.1 | 0.05 | RS | z=0.110, r=16.79. Triple. |
| -66:39:35.2 | FR-II | GRG | Bright B, R, K, r id. Inner N lobe; | ||||
| Amorphous outer lobes. | |||||||
| J0035.0-6612* | 00:35:01.87 | 37 | 30 | 10.5 | 0.55 | RS | z=0.465, r=19.10. Strong elongated |
| -66:12:52.3 | FR-I | core. B, R, K, r id. Offset from peak. | |||||
| Linear feature to S (no K, r id). | |||||||
| J0035.1-6748 | 00:35:07.91 | 32 | 31 | 1.44 | 0.3 | HzFR-I | z=(1.82), r=23.32. Weak source. |
| -67:48:40.7 | FR-I | Relic | Elongated core. Faint K, r id only. | ||||
| J0035.2-6638* | 00:35:18.00 | 45 | 32 | 11.9 | — | No B, R, r, K id. | |
| -66:38:35.10 | FR-II | No separate core seen. Centroid position. | |||||
| J0035.4-6636* | 00:35:25.28 | 90 | 33 | 11.7 | 0.14 | GRG | z=(2.38), r=23.98. Triple. Faint K, r id. |
| -66:36:09.0 | FR-II | ||||||
| J0036.9-6645 | 00:36:54.19 | 30 | 34 | 1.5 | 0.39 | z=(0.23), r=18.16. Core+twin jets. Bright | |
| -66:45:13.9 | FR-I | B, R, K, r id at core. Two neighbors. | |||||
| J0037.1-6649* | 00:37:08.60 | 52 | 35 | 39.5 | 0.07 | z=(2.11), r=23.69. Id in r, very faint in K. | |
| -66:49:39.1 | FR-II | ||||||
| J0037.3-6647* | 00:37:19.05 | 72 | 36 | 2.5 | 0.43 | RS | z=(1.30), r=22.48. Bright core. Asymmetric |
| -66:47:05.6 | FR-II | lobe flux. Relic lobe to South. Id in K, r. | |||||
| J0037.7-6807* | 00:37:45.16 | 72 | 37 | 19.1 | 0.08 | RS | Bright core, 2 jets. |
| -68:07:41.6 | FR-II | Asymmetric lobe flux. Relic lobe to SW. | |||||
| Faint K-only id. K id position given. | |||||||
| J0038.6-6732* | 00:38:36.11 | 90 | 38 | 47.1 | 0.01 | GRG | Faint core. Faint |
| -67:32:01.6 | FR-II | K-only id. K id position is given. | |||||
| J0039.4-6601 | 00:39:27.23 | 72 | 39 | 21.7 | 0.03 | RS | z=(1.06), r=21.97. Asymmetric. Faint core. |
| -66:01:06.9 | FR-II | Id in R, K, r. Companion 4” to north. | |||||
| J0039.8-6624* | 00:39:53.82 | 90 | 41 | 42.7 | 0.03 | GRG | No id in B, R, or K |
| -66:24:51.4 | FR-II | at peak. Faint r id position given. | |||||
| J0040.2-6553 | 00:40:14.21 | 66 | 40 | 3.2 | 0.09 | z=0.512, r=20.28. Faint, detatched lobes. | |
| -65:53:25.07 | FR-II | Bright B, R, K, r id. Core? | |||||
| J0040.2-6729 | 00:40:17.83 | 45 | 42 | 3.4 | 0.38 | HzFR-I | Bright core, 2 |
| -67:29:56.9 | FR-I | RS | extensions. Faint r id. 3 blue galaxies close. | ||||
| J0040.3-6703* | 00:40:23.64 | 75 | 43 | 2.9 | 0.06 | z=(3.65), r=25.06. Inversion symmetric | |
| -67:02:40.1 | FR-II | lobes. Neighboring strong source, no id. | |||||
| Weak radio core at centre. | |||||||
| Faint r id, brighter in K. | |||||||
| J0040.7-6724 | 00:40:46.59 | 35 | 44 | 3.1 | 0.23 | z=0.296, r=19.07. Bright B, R, K, | |
| -67:24:35.8 | HT | r id at head. Cluster. | |||||
| J0040.9-6638* | 00:40:57.43 | *60 | 45 | 5.5 | 0.05 | No obvious id in B, | |
| -66:38:37.7 | FR-II | R, K. Faint r id at weak core. Galaxy | |||||
| in N lobe. Asymmetric lobe separation. | |||||||
| J0041.7-6726* | 00:41:47.35 | 40 | 46 | 78.6 | 0.19 | z=0.292, r=17.34. Includes halo emission. | |
| -67:26:26.5 | HT | Bright B, R, K, r id. Complex region. | |||||
| J0042.1-6728* | 00:42:09.27 | 45 | 47 | 30.0 | 0.17 | z=(0.25), r=18.33. Bright B, R, K, r id. | |
| -67:27:56.4 | HT | ||||||
| J0043.2-6751* | 00:43:17.28 | 30 | 48 | 40.2 | 0.59 | z=(0.38), r=19.42. Id in B, R, K, r. | |
| -67:51:45.7 | WAT | Clear cluster. | |||||
| J0043.4-6738 | 00:43:28.83 | 50 | 49 | 7.1 | — | Relic | Faint N lobe. Faint |
| -67:38:45.8 | FR-II | K-only id? No core. K id position given. | |||||
| J0043.6-6624 | 00:43:37.04 | 42 | 50 | 5.9 | 0.13 | HzFR-I | z=(0.99), r=21.81. Id in B, R, K, r |
| -66:24:47.2 | WAT | Relic | |||||
| J0043.8-6659 | 00:43:53.16 | 45 | 51 | 9.2 | — | z=(0.39), r=19.47. B, R, K, r id (star-like). | |
| -66:59:25.4 | FR-I | Brighter in B. No core. Hybrid morphology. | |||||
| J0044.3-6746* | 00:44:20.18 | 96 | 52 | 60.2 | 0.05 | z=(0.29), r=18.78. B, R, K, r id at core. | |
| -67:46:59.9 | FR-II | ||||||
| J0044.7-6656 | 00:44:47.63 | 108 | 53 | 9.3 | 0.14 | RS | z=(0.72), r=21.01. Bright core, inner double. |
| -66:56:39.5 | FR-II | GRG | Faint K, r id. Lobes with hotspots. | ||||
| J0045.0-6620* | 00:45:01.39 | 45 | 54 | 15.9 | 0.09 | Id only in R and | |
| -66:20:31.9 | FR-II | K at core. r image NA. | |||||
| J0045.5-6726* | 00:45:31.87 | 40 | 55 | 11.8 | 0.12 | z=(0.27), r=18.57. Bright B, R, K, r id. | |
| -67:26:36.7 | FR-I | Weak core. Asymmetric extensions. | |||||
| 2 close neighbors. | |||||||
| J0046.1-6630* | 00:46:09.88 | 50 | 57 | 6.0 | 0.39 | HzFR-I | Core and 2 weak extensions. |
| -66:30:09.2 | FR-I | RS | No B, R, r id. K band NA. | ||||
| Core position given. | |||||||
| J0046.2-6637* | 00:46:12.72 | 50 | 56 | 19.2 | 0.04 | z=(0.37), r=19.32. B, R, K, r id? | |
| -66:37:07.5 | FR-II | Weak core? Fat lobes. Alternately, quasar? | |||||
| Star-like id 10-arcsec NW has z=(0.81), m=21.29. | |||||||
| J0046.4-6730* | 00:46:27.26 | 78 | 58 | 71.7 | — | RS | Faint K, r only id(?). |
| -67:30:17.4 | FR-II | Galaxy chain along N lobe. No core. | |||||
| Faint r object at SE lobe peak. | |||||||
| J0047.1-6715* | 00:47:12.51 | 60 | 59 | 17.2 | — | Weak core? No B, R id. | |
| -67:14:45.7 | FR-II | Faint K, r id. | |||||
| J0049.3-6705 | 00:49:18.94 | 48 | 60 | 17.2 | 0.14 | No K id. Core, | |
| -67:05:02.5 | FR-II | faint diffuse r id. Companions. | |||||
| J0049.3-6703 | 00:49:22.16 | 78 | 61 | 2.6 | 0.16 | RS | z=(0.47), r=19.94. Bright B, R, K, r id. |
| -67:03:58.5 | FR-I | Extended core. | |||||
| J0049.9-6639 | 00:49:58.05 | 132 | 62 | 11.4 | 0.04 | GRG | No K id. |
| -66:39:25.5 | FR-II | Faint r id at core. Asymmetric lobes. | |||||
| J0050.0-6619* | 00:50:03.63 | 50 | 63 | 10.8 | 0.07 | Core position. No R, | |
| -66:19:42.9 | FR-II | K id. r-image NA. Possible faint B id. | |||||
| J0052.7-6636* | 00:52:44.08 | 45 | 64 | 58.9 | 0.05 | z=(1.33), r=22.53. Clear r id | |
| -66:36:30.9 | FR-II | at centre. K-band NA. No B, R id. | |||||
| J0052.7-6651 | 00:52:48.69 | 50 | 65 | 41.7 | 0.22 | z=(0.24), r=18.21. Galaxy chain along | |
| -66:51:12.5 | HT | axis. Brightest galaxy at head. B, R, r id. | |||||
| J0052.8-6641* | 00:52:51.59 | 66 | 66 | 232.0 | 0.01 | Prominent wing to W | |
| -66:41:27.7 | FR-II | at core location. No B, R, K, r id. | |||||
| J0053.5-6553* | 00:53:32.72 | 55 | 67 | 205.4 | 0.68 | HzFR-I | z=(0.73), r=21.05. Bright core, 2 jets. |
| -65:53:00.7 | FR-I | Star-like B, R, r id, brighter in B. | |||||
| J0054.6-6650 | 00:54:39.59 | 60 | 68 | 3.5 | 0.41 | RS | Core, 2 faint extensions. |
| -66:50:35.7 | FR-II | No B, R, K, r id. Faint r id 2” from | |||||
| radio peak? Radio peak position given. | |||||||
| J0055.7-6610 | 00:55:44.53 | 72 | 69 | 28.0 | 0.12 | z=(0.22), r=18.04. Bright B, R, r id has | |
| -66:10:41.7 | HT | close companions. | |||||
| J0055.9-6802 | 00:55:57.03 | 40 | 70 | 74.0 | 0.64 | z=(0.37), r=19.36. Bright core and | |
| -68:02:22.3 | FR-I | 2 extensions. Cluster. B, R, r id. | |||||
| J0056.4-6651 | 00:56:27.16 | 52 | 71 | 22.2 | 0.08 | z=(0.19), r=17.75. Bright B, R, r id at | |
| -66:51:21.7 | WAT | centre. Cluster. | |||||
| J0056.6-6743 | 00:56:37.90 | 47 | 72 | 5.8 | 0.11 | z=(0.93), r=21.64. Morphology/LAS in doubt. | |
| -67:43:42.1 | FR-II | 1.8’ FR-II or 47” hybrid morphology. R, | |||||
| r-only id. Id also for NE hotspot. | |||||||
| J0056.9-6632 | 00:56:57.22 | 75 | 73 | 4.4 | 0.05 | z=0.249, r=18.60. Bright B, R, r id. Weak core. | |
| -66:32:39.4 | FR-II | ||||||
| J0057.0-6734 | 00:57:04.39 | 66 | 74 | 5.4 | 0.10 | z=0.307, r=19.02. Triple. Id in B, R, r. | |
| -67:34:13.2 | FR-II | Object in B in east lobe. | |||||
| J0057.1-6633 | 00:57:11.76 | 40 | 75 | 5.9 | 0.18 | HzFR-I | Faint diffuse radio |
| -66:33:38.7 | FR-I | emission 1.2’ S. Faint R id (?), not | |||||
| seen in B. Artifact in r-image. Central | |||||||
| radio peak position given. | |||||||
| J0057.2-6651 | 00:57:07.00 | 126 | 76 | 29.7 | 0.05 | z=0.236, r=18.19. Asymmetric in extent, flux, | |
| -66:50:59.5 | FR-I | morphology. Bright R, B, r id at bright core. | |||||
| J0057.4-6606 | 00:57:24.85 | 90 | 77 | 8.9 | 0.08 | GRG | z=(1.39), r=22.65. Faint id at core in R, r, |
| -66:06:30.3 | FR-II | fainter in B. Several neighboring galaxies. | |||||
| J0057.4-6703 | 00:57:27.20 | 42 | 78 | 10.7 | 0.4 | z=0.260, r=18.64. Bright B, R, r id. Cluster. | |
| -67:03:19.9 | WAT | ||||||
| J0057.7-6701 | 00:57:43.54 | 40 | 79 | 10.1 | 0.32 | z=0.261, r=18.13. Bright id in B, R, r. | |
| -67:01:36.7 | WAT | ||||||
| J0057.7-6655* | 00:57:45.17 | 40 | 80 | 2.6 | 0.24 | z=(0.66), r=20.79. r id at core. | |
| -66:55:07.3 | FR-II | Bright star nearby. | |||||
| J0057.8-6711 | 00:57:50.16 | 37 | 81 | 4.4 | — | Asymmetric in flux. | |
| -67:11:35.6 | FR-II | No B, R, r id. | |||||
| 50” centroid position given. | |||||||
| J0057.9-6633 | 00:57:54.56 | 45 | 82 | 29.8 | 0.27 | Bright core. Bright star close. | |
| -66:33:58.4 | WAT | Id in K-band? | |||||
| Radio core position given. | |||||||
| J0059.6-6712 | 00:59:41.17 | 40 | 83 | 9.61 | 0.23 | HzFR-I | z=(0.50), r=20.09. Core and 2 jets. |
| -67:12:58.9 | FR-I | Cluster. B, R, r id. Overlapping, | |||||
| unrelated NE source with id. | |||||||
| J0101.1-6600 | 01:01:07.69 | 150 | 84 | 10.9 | 0.12 | RS | z=(0.24), r=18.20. Bright core, two |
| -66:00:18.7 | FR-II | detached lobes. Weak, diffuse S lobe. | |||||
| Bright B, R, r id. No id in N lobe. | |||||||
| J0101.5-6742* | 01:01:34.12 | 40 | 85 | 21.7 | 0.39 | HzFR-I | z=(0.59), r=20.50. B, R, r id. Several neighbors |
| -67:42:13.5 | WAT | ||||||
| J0102.1-6552* | 01:02:12.14 | 66 | 86 | 12.5 | — | Relic | z=(1.11), r=22.09. No core. Emission gap |
| -65:52:19.6 | FR-II | between lobes. B, r id (?) on radio axis. | |||||
| J0102.3-6614* | 01:02:15.88 | 60 | 87 | 15.0 | 0.06 | Triple. Faint B, R(?), r id. | |
| -66:14:49.7 | FR-II | ||||||
| J0102.4-6632* | 01:02:27.66 | 55 | 88 | 27.0 | 0.03 | Faint r id. Not seen in B. | |
| -66:32:13.4 | FR-II | Weak core. Bright star object close. | |||||
| J0102.5-6621 | 01:02:31.63 | 50 | 89 | 12.8 | — | z=(1.50), r=22.84. Central r id. No core. | |
| -66:21:21.3 | FR-II | ||||||
| J0102.6-6658 | 01:02:37.05 | 60 | 90 | 7.9 | 0.35 | HzFR-I | z=(0.61), r=20.59. Bright core and twin, |
| -66:58:26.4 | FR-I | RS | faint extensions. No jets. R, r id only. | ||||
| Several nearby galaxies. | |||||||
| J0102.6-6734 | 01:02:41.48 | 60 | 91 | 9.9 | 0.13 | z=0.065, r=15.53. Bright B, R, r id at core. | |
| -67:34:02.8 | WAT | ||||||
| J0102.6-6750 | 01:02:42.43 | 204 | 92 | 38.0 | 0.4 | z=(0.13), r=16.78. Bright B, R, r id. Core, | |
| -67:50:32.5 | FR-I | 2 jets. May be larger? Rich cluster. | |||||
| J0102.9-6722 | 01:02:56.48 | 38 | 93 | 3.72 | 0.13 | HzFR-I | z=(0.84), r=21.38. Bright B, R, r id at centre. |
| -67:22:20.2 | WAT? | ||||||
| J0103.1-6632 | 01:03:10.03 | 30 | 94 | 2.46 | 0.5 | z=0.398, r=18.87. Core, 2 faint extensions. | |
| -66:32:21.5 | FR-I | B, R, r id. Close companions in r. Faint id | |||||
| in E component? Extent less than 30”? | |||||||
| J0103.2-6614 | 01:03:15.05 | 120 | 95 | 101.2 | 0.006 | z=0.331, r=18.22. Low axial ratio lobes. | |
| -66:14:25.4 | FR-II | Weak core? Bright B, R, r id. | |||||
| J0103.7-6632 | 01:03:44.49 | 78 | 96 | 3.9 | 0.10 | RS | z=(0.59), r=20.53. Triple. B, R, r id. |
| -66:32:27.1 | FR-II | Close companion. Cluster? | |||||
| J0103.7-6747* | 01:03:44.55 | 35 | 97 | 6.7 | 0.50 | z=0.329, r=18.44. Core and 2 extensions. | |
| -67:47:51.8 | FR-I | Bright id in B, R, r. | |||||
| J0104.1-6719 | 01:04:08.42 | 40 | 98 | 13.7 | 0.08 | z=(1.44), r=22.74. No id in B, R. Id in r. | |
| -67:19:16.2 | FR-II | ||||||
| J0104.3-6609 | 01:04:21.26 | 90 | 99 | 5.22 | 0.07 | RS | z=(1.19), r=22.26. Inner double between |
| -66:09:17.3 | FR-II | GRG | outer lobes. r-only id. | ||||
| J0104.4-6704 | 01:04:27.68 | 90 | 101 | 8.8 | 0.15 | RS | z=(1.39), r=22.64. Triple. Faint r id. |
| -67:04:23.5 | FR-II | GRG | |||||
| J0105.0-6608* | 01:05:00.85 | 52 | 100 | 47.1 | — | z=(0.85), r=21.42. No core. R id? Not | |
| -66:08:56.1 | FR-II | seen in B. Clear r id. Neighbours. | |||||
| J0105.1-6617* | 01:05:08.22 | 37 | 102 | 10.0 | 0.24 | RS | Extended core, one extension. |
| -66:17:47.8 | FR-II | No B, R id. Offset r, K object | |||||
| position given. Related to NE (no id) | |||||||
| source? 1’ source? Bright star near id. | |||||||
| J0105.3-6736 | 01:05:19.04 | 66 | 103 | 20.4 | 0.18 | RS | z=(0.26), r=18.49. Inner double. |
| -67:36:04.7 | FR-II | B, R, r id at core. Close neighbors. | |||||
| J0105.7-6604* | 01:05:44.38 | 50 | 104 | 18.0 | — | No core. No B, R, r, K id. | |
| -66:04:04.6 | FR-II | Bright star close. Centroid position. | |||||
| J0105.7-6609 | 01:05:45.73 | 84 | 105 | 14.5 | 0.02 | z=(0.98), r=21.78. r id at weak core. | |
| -66:09:42.8 | FR-II | Asymmetric lobes. r object at E lobe peak. | |||||
| J0105.7-6643* | 01:05:47.18 | 50 | 106 | 185.5 | 0.73 | HzFR-I | Strong core, 2 extensions. |
| -66:43:52.4 | FR-I | No B, R, r id. Radio peak position. | |||||
| J0106.0-6653* | 01:06:01.90 | 34 | 107 | 3.8 | 0.49 | z=0.262, r=17.59. Extended core. Bright B, | |
| -66:53:37.3 | FR-I | R, r id. Group, close neighbours. | |||||
| Likely if E source unrelated; | |||||||
| very faint r id for E source? | |||||||
| R-only galaxy along extension to E. | |||||||
| J0106.2-6645* | 01:06:13.78 | 40 | 108 | 5.4 | — | No B, R, r id. Weak core? | |
| -66:45:37.9 | FR-II | Faint K id? 50” centroid position given. | |||||
| J0106.2-6545* | 01:06:24.17 | 66 | 109 | 457.3 | 0.47 | Bright core, 2 jets. | |
| -65:45:21.1 | FR-I | Core position given. B, R id. r-band NA. | |||||
| J0106.8-6645* | 01:06:49.61 | 108 | 110 | 38.3 | 0.02 | GRG | z=(1.21), r=22.29. Faint r id at core. |
| -66:46:07.3 | FR-II | Lobes asymmetric in flux, separation. | |||||
| Closer NW lobe stronger. | |||||||
| J0107.3-6626 | 01:07:20.57 | 35 | 111 | 1.4 | — | HzFR1 | Core (?). No id. Faint |
| -66:26:46.8 | FR-I | galaxies within source. Centre peak position. | |||||
| J0108.2-6727 | 01:08:13.35 | 30 | 112 | 9.5 | 0.43 | HzFR-I | z=(1.22), r=22.32. Bright core, 2 short |
| -67:27:04.0 | WAT? | extensions; group emission? Id in r. | |||||
| J0108.6-6655* | 01:08:38.92 | 37 | 113 | 19.5 | 0.28 | HzFR-I | z=0.528, r=19.95. Sharp boundaries like |
| -66:55:28.6 | FR-I | FR-II. Id in R, r at core, not seen in B. | |||||
| J0109.1-6743* | 01:09:07.41 | 90 | 115 | 16.5 | 0.08 | RS | Extended, weak core. |
| -67:43:13.9 | FR-II | Bright B, R id. r-band NA. R-id position. | |||||
| Relic S lobe, hotspot at N lobe end. | |||||||
| J0109.1-6653 | 01:09:08.92 | 45 | 114 | 2.7 | 0.13 | Extended core. B, R, r id. | |
| -66:53:21.3 | WAT | Bright star close. R-band position. | |||||
| J0110.7-6727* | 01:10:46.81 | 60 | 116 | 431.4 | 0.54 | HzFR-I | Strong core, two extensions. |
| -67:27:55.9 | FR-I | No R, B, r id. Radio peak position. | |||||
| J0110.7-6705 | 01:10:46.98 | 78 | 117 | 32.8 | 0.01 | z =(0.80), r=21.27. Bright hotspots. Wings. | |
| -67:05:15.0 | FR-II | Faint B, R, rid at core. | |||||
| J0112.3-6634* | 01:12:18.92 | 60 | 118 | 456.5 | 0.36 | Extended core; 2 extensions. | |
| -66:34:44.7 | FR-I | Bright B, R id. r image NA. B-band position. | |||||
| J0113.2-6705* | 01:13:16.76 | 66 | 119 | 117.2 | 0.01 | Core? B, R id. Brighter | |
| -67:05:38.4 | FR-II | in B. Neighbor. r image NA. B-band position. |
Note. — Sources selected from regions that lie outside the effective primary beam attenuation of 0.5 are denoted by an asterisk. WAT: wide angle tail structures, HT: head-tail type structure, RS: restarted source, HzFR-I: FR-I, GRG: giant radio galaxy. Redshifts given in brackets refer to values estimated using the r-band magnitude-redshift relation.
3 Morphological classification
Herein we present a characterization of the extended radio sources detected in ATLBS. Radio sources are large scale manifestations of central nuclear activity and may in some cases exhibit structures that also pre-date that activity. The variety in radio morphologies may be indicative of basic differences in central engine characteristics and environmental conditions in which they develop; the structural form may also evolve as the central engine ages and the properties of the beam change. It is therefore meaningful and insightful to examine the distribution in source structures in radio source populations and over cosmic time, not only from the viewpoint of the gross type — whether the radio morphology is of FR-I or FR-II type — but also whether the sources may be currently active, inactive or starting a new activity.
3.1 Radio source morphologies: general considerations
Sources with FR-I morphology invariably manifest a pair of bright jets or two-sided extensions to the core and lack well defined lobes; the cores are the brightest components. FR-II sources are usually observed to have a pair of distinct edge-brightened lobes with possibly embedded hotspots/warmspots. Jets are often not obvious, unless observed with high dynamic range and sensitivity. In the ATLBS-ESS sample, some FR-I sources have bright elongated cores, which with higher resolution appear as twin collimated jets on either side of an unresolved core component. More often the cores have weak, continuous and elongated extensions that hardly resemble classic jets.
A relic double radio source is one in which the beams have ceased. It is relatively easier to recognize relicts of FR-II type radio galaxies. Presence of twin edge-brightened lobes that, when observed with high resolution and sensitivity, lack compact hotspots, jets and a core (or only display a weak core), may with some confidence classify the source as a relic FR-II. An edge-brightened double source that lacks compact features in the lobes, which nevertheless possesses a bright core, might be classified as a restarting FR-II radio source. A double-double morphology is a fairly unambiguous case of a restarted FR-II radio galaxy. Restarted FR-II sources may sometimes appear to have the typical edge-brightened hot-spot radio structure with additional remnant low-surface brightness relic emission that is disjoint and outside of the main source; the relict lobe (or lobes) may be collinear with the inner double or sometimes offset in angle.
The appearance of an FR-II radio source in which the beam power drops substantially as it approaches the end of activity is not clear: it may be that the beams become lossy and transform to bright FR-I type jets (which are believed to have intrinsically low beam powers): such sources may be recognized by the joint appearance of edge brightened lobes, without hotspots, together with possibly twin bright jets.
Since the original FR-I/II classification scheme was proposed by Fanaroff & Riley (1974), there have been several attempts to refine the criteria for separation of extended radio sources into the two major morphological types (Owen & Laing, 1989; Owen & Ledlow, 1994; Zirbel & Baum, 1995; Parma et al., 1996; Hardcastle et al., 1998). Parma et al. (1996) have noted that the morphologies of FR-I types are varied: the bulk of low power radio sources have low luminosity double-lobe type morphologies and only a small percentage () resemble the archetypal source 3C31. Since we will be referring to the 3C31-type morphology often we give its definition: such a source structure is described as ”naked-jet” type, where a bright core is accompanied by twin rapidly expanding jets (e.g. see Fig. 10). The double-lobe type FR-I sources are considered as those in which the jets are light but not powerful enough to end in bright compact hotspots and are affected by surface instabilities and, therefore, may be lossy and bright. Thus a source that has two lobes, a bright core and twin extensions is also to be classified as an FR-I: the lobe-type FR-I.
An unsolved problem is, therefore, whether at least some of the sources considered to be FR-I type may, in fact, be FR-II sources in which the beams are close to the ends of their activity phase. The possibility of conversion between the two morphological types, specifically from FR-II to FR-I type, has been suggested and invoked previously (Owen & Ledlow, 1994; Zirbel & Baum, 1995; Ledlow, 1997; Saripalli et al., 2009). Nevertheless, it is accepted that the central engine in any FR-II source (also FR-I) does switch off and that such beam activity is only a phase in the lives of luminous galaxies. At present there is no understanding of the manner in which a radio source structure evolves as the central engine turns off, and whether the timescale of the turning off is abrupt or comparable to the active phase. If the switch off happens over a significant period of time, we may expect to see significant numbers of dying FR-II sources: perhaps they are the non-3C31 type FR-I sources?
3.2 Radio source morphologies: classification method
While the primary separation of ATLBS-ESS sources into FR-I (radio sources with bright cores and twin bright large-scale jets or edge-darkened lobes) and FR-II sources (radio sources with twin edge-brightened lobes) follows the traditional classification scheme of Fanaroff & Riley (1974), we have adopted additional criteria in an attempt to identify sources within relic and restarted sub classes:
FR-II (relic) type: These sources are edge-brightened radio galaxies that lack hotspots, jets and cores. These sources appear simply as pairs of diffuse edge-brightened lobes.
FR-II (restarted) type: Sources of this sub-class have edge-brightened lobes that may or may not have emission peaks at their ends (i.e., which may or may not be relic lobes) but contain an inner (recessed) double source or an elongated radio core or an unusually (for FR-II sources) bright radio core.
FR-I (relic) type: These are sources with a core with twin extensions or trails that do not resemble typical jets or lobes. No other compact emission apart from the core is present. Although the core is often the brightest part of the source the contrast is not high for sources in this sub-class.
FR-I (restarted) type: Sources of this sub-class are required to have an extended core or a core with a pair of bright, short extensions, which are necessarily accompanied by emission regions further out that are detached from the core and substantially fainter. Membership of this sub-class requires that the outer emission regions are not edge-brightened.
In classifying the radio sources based on the above criteria we have used all the radio data available to us (the original 50” images, the 4” images sensitive to compact components and the 6” images that give detailed morphologies).
4 Radio morphology distribution and characteristics in the ATLBS-ESS
Of the total of 119 radio sources that comprise the ATLBS-ESS, 64 () are FR-II sources and 55 () are FR-I type sources (the FR-I sources include 18 sources that have wide angle tail (WAT) structures or head-tail (HT) type structures). The ATLBS-ESS, which has sources down to mJy flux density, has nearly three times larger fraction of FR-I sources compared to the well-known 3CRR sample, which has a much greater flux density cutoff.
A large fraction () of the sample has firm identifications. In 20 FR-II sources, either radio cores are not obvious (although a candidate host galaxy is identified in 6) or optical identifications have not been possible (although a core component is present in 4) or the best optical candidate was chosen with the available data. Five of the 55 FR-I sources have no optical counterparts identified although cores are clearly observed.
A large fraction of the FR-I population (not including WAT, HT types) is of the asymmetric type where a core is accompanied by a pair of lobes that appear to extend to different distances on the sky. The ratio of lobe lengths on the two sides exceeds 1.5 in (12/37) of the sources (Figs. 5, 18, 30, 31, 42, 55, 76, 90, 92, 94, 107, 111). Even if two of the sources 01 03 10.03 -66 32 21.5 and 01 06 01.90 -66 53 37.26 (Figs. 94, 107) may not meet the LAS criterion (see Table 1) and hence are excluded, close to a third of the FR-I sources have more than difference in the lobe extents on the two sides; therefore, significant asymmetry appears to be a common occurrence in the ATLBS FR-I sources. Additionally, the FR-I sources in ATLBS-ESS are mostly of the 3C31-type and not of the double-lobe type structure that dominates samples with relatively higher flux density cutoffs.
Morphological differences and flux asymmetries are quite prevalent in these strongly asymmetric FR-I sources, occurring in nearly half of them. All five asymmetric FR-I sources (Figs. 18, 31, 55, 76, 92) that have pronounced flux asymmetries also have substantial morphological asymmetry. Sources with the greatest asymmetry in lobe extents do not necessarily have the greatest asymmetry in flux density; however, one of the most asymmetric FR-I sources (Fig. 92) does indeed have the greatest asymmetry in flux density.
In contrast to these morphological characteristics of FR-I sources, a significantly smaller fraction of FR-II sources display such pronounced asymmetry in lobe extents. If we omit from consideration those ten FR-II sources that have no radio core and no obvious optical IDs (because lack of a core or clear ID in FR-II sources results in ambiguity as regards the location of the center in contrast to the case of FR-I sources where bright cores makes knowledge of the position of an optical Id less necessary), and those where the total extent is unclear (owing to confusion as to whether outlying components are independent sources or extensions), 7/54 sources or alone display pronounced asymmetry in which the ratio of extents exceeds 1.5 (Figs. 23, 26, 49, 59, 84, 87, 110). The lobe-extent asymmetry in these FR-II sources appears to be frequently accompanied by asymmetries in flux density but less often by asymmetries in morphologies.
4.1 The FR-I radio galaxies.
As mentioned in the introduction little is known of the low power radio galaxy population at higher redshifts because imaging their low brightness structures required highly sensitive radio surveys. The high surface brightness sensitivity achieved in the ATLBS has the potential to detect and identify the radio morphologies of low power radio galaxies at relatively high redshifts, besides the high redshift powerful extended radio sources. In Table 1 we have indicated the 22 FR-I type radio sources from the ATLBS-ESS that are estimated to have redshifts . In this section we have attempted to characterize their radio structures and make a comparison with the structures of the remaining, lower redshift () FR-I sources.
For three of these FR-I sources we have spectroscopically measured redshifts: two have broad emission lines and hence classify as FR-I quasars. Seven sources have optical hosts that are either very faint in the r-band images or are not seen in these images. These sources are likely to have redshifts exceeding 0.5. In the case of 00 57 11.76 -66 33 38.7 (Fig. 75), it was not possible to obtain the magnitude of the host galaxy in either r-band (due to an image artifact at the source location) or K-band (because of contamination from a bright star in the vicinity). In this case we used the FR-I/II break power to estimate the redshift using the measured total flux density of the source and the assumption that this break power does not evolve with redshift. Using the upper limit to the total 1.4 GHz powers of FR-I sources—the break power of W Hz—we use the total flux density of the FR-I source, 5.69 mJy, and derive an upper limit of to the redshift.
Five of the 22 FR-I sources are of WAT or probably WAT-type structures. The remainder of high redshift FR-I sources have predominantly 3C31 type morphologies (14/17) with only 3 having lobe-type morphologies.
The low redshift FR-I population in the ATLBS-ESS sample (excepting those with WAT/HT type and one with hybrid structure) has a similarly low fraction (3/19) of lobe-type morphologies. In contrast to the findings of Parma et al. (1996), whose use the much brighter B2 sample, where only a small percentage () of FR-I sources are of the type resembling the archetypal source 3C31, the ATLBS survey finds substantially larger fractions of 3C31-type sources. More than a fourth (6/22) of the high redshift FR-I sources are of core-twin-jet type that appear to have the brightest cores in the entire sample of ATLBS-ESS sources. In these the extensions are weak or ill-formed with most of the source dominated by the bright core. The fractional abundance of this source type at is smaller (3/33).
The low and high redshift FR-I sources do not display differences in the incidence of pronounced asymmetry in lobe extents. If we omit the WAT and HT sources from consideration, of the 12 FR-I sources that have lobe extents differing by more than , 7/19 are at and 5/17 are at .
Because of the edge-darkened nature of FR-I sources in which the lobe surface brightness progressively diminishes with distance from the core, it is more meaningful to examine the structures of FR-Is with relatively larger angular size to identify relic and restarted radio sources. We examined sources with angular size arcmin, which ensured well resolved images from the ATLBS observations. There are 4 sources that are identified as being at high redshift () and 11 that are identified as being at low redshift (). While (4/22) of high redshift FR-Is have angular sizes larger than or equal to an arc-minute nearly double that fraction (, 11/33) is seen to have these large angular sizes in the low redshift FR-I population. Two of the 11 low redshift FR-I sources are WAT type; of the remaining nine FR-I sources, two are recognized as having restarted nuclear activity (Figs. 5 and 30). Among the four FR-I sources with LAS arcmin, one is recognized as potentially having a restarted activity (Fig. 90) and another as a source in which the nuclear activity has ceased (Fig. 31). For these small sub-samples derived from the ATLBS-ESS, there is no evidence for a difference in the incidence of restarted and relic FR-I sources at redshifts below and above .
In summary, we have attempted to compare the morphologies of low and high redshift FR-I sources using the ATLBS-ESS. There appear to be no major differences in morphological properties of the high and low redshift samples of FR-I sources; in their asymmetry properties as well as the fractions with structures corresponding to relic or restarted sources. There is, however, indication that there is a higher abundance of FR-I sources with a bright-core and twin weak jets at higher redshifts.
4.2 Relic sources
Sources in which the core is weak or absent and no hotspots or jets are seen are candidates for relics. However, as mentioned earlier, if the central activity ceases gradually rather than abruptly, there may be FR-II sources observed that are close to the end of their lifetime and at a time when the lobes are devoid of hotspots, the central region has a core and twin, lossy, bright jets, the lobe has suffered substantial entrainment and may be buoyantly displaced by the ambient medium. Such sources might be mistaken for an FR-I or even a restarted FR-II. On the other hand, a relic FR-I may continue to be centrally brightened as a consequence of weakening of the peripheral parts of the lobes as the energy injection ceases and brightening at the center as weakened jets become increasingly lossy.
Based on the definitions adopted in Section 3.2 for relic FR-I radio sources, we have recognized two sources as being relic FR-Is: J0035.1-6748 (Fig. 31), and possibly J0043.6-6624 (Fig. 50). In J0035.1-6748, there is no compact emission (even at the core). The source J0043.6-6624 is a WAT-type relic FR-I in which a weak core appears disjoint from the two extensions. In J0035.1-6748, the central extended emission component is associated with a faint galaxy and to the south is a faint extended feature. There is no compact emission seen at 4” resolution. When smoothed to 10” resolution a much larger source emerges particularly to the north where a faint extension is seen extending nearly twice the extent of the feature to the south. The bright source at the centre accompanied by weaker extensions together with the lack of any core or jets at the resolution of 4” are characteristics that suggest the source to be a relic FR-I.
As for relic FR-II radio sources, only one source J0102.1-6552 (Fig. 86) qualifies the definition; however, we also note J0043.4-6738 (Fig. 49) as a possible relic FR-II candidate. The first source has no core and no obvious hotspot at the ends of the lobes. The second candidate has a weak compact source (at 4”, contours not shown in the figure) between the two lobe components but its identification as the radio core is uncertain because it is located off the radio axis (about 3 arcsec west). Moreover, although there is an extended emission peak in the southern lobe (also at 4”, contours not shown) it is not at the end of the lobe as is expected in an archetypal FR-II source. In both sources the lobes have relatively small axial ratios as is expected for evolved relic lobes.
Most sources manifest central cores, jets, or hotspots that are key indicators of continuing AGN activity. However the sample of ATLBS-ESS relics have been selected on the basis that they lack most of these components. The poor abundance of relic radio sources even in a survey such as the ATLBS that has exceptional surface brightness sensitivity adds weight to the well-known rarity of relic sources (Blundell & Rawlings, 2000). It may be noted here that the identification of relic sources has been done herein solely on the basis of radio morphology and without considering additional indicators such as the spectral index (Parma et al., 2007; Dwarakanath & Kale, 2009).
To gauge the relative effectiveness of our survey in identifying relic radio sources, we compared the ATLBS images with the only other comparable radio survey for the survey region: the 843 MHz SUMSS (Bock et al., 1999; Mauch et al., 2003). The ATLBS sources were identified from images with beam FWHM 50 arcsec, which is very similar to the resolution in SUMSS. The observing frequencies of the two surveys are not too far apart, although the image rms noise in SUMSS is more than 10 times higher than that in ATLBS. Of the 4 relic sources that have potentially been identified in ATLBS, one (J0035.1-6748; Fig. 31) is not detected in SUMSS whereas it is detected at the 14 level in the ATLBS. The remaining relic sources are detected in SUMSS; however, they are observed with peak brightness of 3-5 times rms noise where as in the ATLBS images they are detected at 25-100 times the rms noise in the ATLBS. Their angular extents in the SUMSS image are in most cases significantly smaller than their angular sizes in the ATLBS. The ATLBS has, therefore, clear advantages in sensitivity to detecting relic radio sources.
The FR-I and FR-II relics in our survey are not among the sources with the lowest surface brightness. Only J0035.1-6748, which is the FR-I relic source, has a low surface brightness of 3.5 mJy arcmin. Both the FR-I relic sources are at redshift .
4.3 Restarting radio sources
Admittedly, identification of relic or restarted activity amongst the lower-power FR-I radio sources may often be ambiguous. The properties of the ambient gas and the time elapsed since the cessation of beam activity are some of the factors that influence the appearance of remnant synchrotron plasma. It is interesting to compare methods for recognizing sources that are in the restarting phase among FR-I and FR-II types. In both types recognizing a source to be restarting hinges on recognizing relic features; however, a problem specific to FR-I sources is that the lobes fade with distance from the core and this makes it difficult to cleanly separate renewed activity from past activity especially if the source is not well resolved. The likelihood of detecting relic emission is greater if the host galaxy resides in a dense cluster medium that may ram pressure limit expansion losses. An example of such a circumstance may be in the source J0024.4-6636 (Fig. 5). It has a central core with twin extensions that are accompanied by weak, diffuse emission regions farther out that are asymmetrically located with respect to the central source. The host is in a rich cluster. The western outer lobe appears to be experiencing intracluster gas weather: it is relatively brighter, closer to the core and also appears to be offset from the source axis where there is a concentration of galaxies (e.g. (Subrahmanyan et al., 2008; Hota et al., 2011). The outer lobes of this source may be in a transition state fading to become radio-ghosts.
The components needed to classify an FR-I source as restarting are an active core together with outer extensions that represent older activity. Morphological signature of an active core is a compact central source accompanied by twin jets; at lower resolution the renewed activity may appear as an elongated source or simply a bright core with a relatively steep spectral index. Evidence for relict FR-I type activity may be in the form of substantially weaker extensions (single or twin) that take the form of broad (non edge-brightened) emission regions that may be detached from the core. Based on the criteria in Section 3.2 we have recognized 7 FR-I restarting sources in the ATLBS-ESS. Of these three are likely to be at redshifts exceeding 0.5. On the other hand, 21 ATLBS-ESS sources are recognized as candidate restarted FR-II sources. They have the following defining characteristics: an edge-brightened lobe morphology (with or without hotspots) accompanied by a central bright, extended core or an inner-double source straddling the core. We also include sources where only one relic lobe is observed along the radio axis. In Table 1 the candidate restarted sources have been indicated.
In all, (28/119 sources, including ) of ATLBS-ESS radio sources appear to have restarted their nuclear activity. By source type, (21/64) FR-II sources compared to only (7/55) FR-I type have signatures corresponding to a restarting of nuclear activity: the fraction of FR-II sources that appear to have recently restarted is about twice that of FR-Is. It may be cautioned here that these estimates are tentative in the light of above mentioned difficulties with reliable recognition of restarting especially in the case of FR-I sources. At least 11 of the 21 restarted FR-II sources are estimated to have redshifts .
The radio sources identified as restarted radio galaxies exhibit non-classic FR-I and FR-II morphologies. For the larger sample of restarted FR-II radio sources we have compiled the following characteristics: the average fractional core flux density is 0.17 which is more than twice the value for normal FR-II sources in the ESS (including seven upperlimits and excluding the 2 relics) and twice below the value for normal ESS FR-Is (that excludes relics, restarts and the hybrid morphology source). Excluding the two quasars among the restarted FR-IIs does not change the fractional core flux density. Also if we exclude the 9 FR-Is with fractional core flux densities above 0.5 (to exclude possible quasars) the value still remains high at 0.27 for the FR-Is. Although this value is likely to be lower because several FR-I cores are blended with surrounding jet emission, the restarted FR-IIs appear to have rather high fractional core flux densities, intermediate between FR-IIs and FR-Is. Also as many as 10 of the 21 have at least one relic radio lobe and 4 out of the 5 with the most prominent cores have at least one relic lobe. The 7 sources that have either an inner double or extensions to the core have an average fractional core power of 0.09. Only 5 out of 19 (excluding the two quasars) have lobe pairs with hotspots in them three of which also have an inner double. For the 8 restarted FR-II sources whose classification hinges on having bright cores in association with edge-brightened lobes the average linear size is 606 kpc which is larger than the average linear size (514 kpc) for the 25 normal FR-IIs for which sizes could be estimated. Hence projection-related effects may not be playing a significant role in boosting the core flux density.
Four of the seven restarting FR-I sources appear to have pronounced asymmetry in lobe extents; in these the lobe extent on one side is more than one and a half times the extent on the opposite side. In contrast, only 3 of the 20 restarted FR-II sources (Figs. 23, 26, 84) show pronounced side-to-side asymmetry in lobe extents (with ratio ). There is an indication therefore that restarting FR-I sources are more likely to be asymmetric.
In many restarted radio sources the renewed activity manifests as an inner double that is embedded within a pair of outer relic lobes. J0031.1-6642 (FR-II; Fig. 23), J0031.8-6727 (FR-II; Fig. 26) and J0035.0-6612 (FR-I; Fig. 30) are ATLBS-ESS sources where on one side there is an accompanying elongated diffuse emission, aligned but well separated from the main source. Such morphology may be indicative of restarting after a relatively longer time. In both source types there may be considerable spread in the time spent in a quiescent mode and it is remarkable that in all the cases identified the radio axis appears to be unchanging over successive active phases.
These sources with detached but aligned relic-like emission indicate that the lobes, once they cease to be active, may not always expand and experience a drastic drop in surface brightness (Leahy, 1991). We discuss each of these three sources below. In all three cases the weak, aligned and well separated extended emission is seen only on one side.
J0031.1-6642 (Fig. 23): A 66 arcsec FR-II radio source with four components. The bright core is identified with a star-like object. Towards the south is a hotspot-like lobe and to the north (at much larger separation than the southern hotspot) is another hotspot-like lobe. All three are aligned. There is no bridge connecting the northern hotspot to the core. Interestingly, to the south of the closer, southern hotspot is a relic-like extended feature (with no galaxy identification). This extended source is oriented at an angle with respect to the radio axis formed by the core and the two hotspots.
J0031.8-6727 (Fig. 26): This 102 arcsec FR-II source has four components. This is a classic triple with a bright core and two edge-brightened lobes straddling it. This triple is asymmetric in lobe separation. The core is connected with the NE lobe by fainter narrow emission. The farther SW lobe is separated from the core by a large emission gap. There is the fourth component to the extreme NE separated from the NE lobe by a gap in emission. This component is faint and lies exactly on the radio axis and on the side of the closer lobe. The core is identified with a star-like object. We have obtained its optical spectrum. It shows at least two broad emission lines. Given its angular size (102 arcsec), its redshift (z=1.156) and morphology, the source is a restarted, 845 kpc giant radio quasar.
J0035.0-6612 (Fig. 30): A bright extended core with a pair of bright jets. To the south of the FR-I radio source is a narrow, almost constant-width extension after a gap.
In both the restarting FR-II sources J0031.1-6642 as well as J0031.8-6727, the distant tail-like faint emission that is plausibly a relict lobe is on the side of the shorter lobe. The latter source has an optical host that appears star-like and has broad emission lines: this is an FR-II quasar and, therefore, the jet axis is likely inclined at a large angle to the sky plane. If we assume that the side-to-side asymmetry is owing to light travel time effects and consequently the shorter lobe is on the far side, the one-sided appearance of the relict emission may also arise from light travel time effects in which the relict emission on the near side, which is being observed at a later time, has faded from view where as the lobe on the far side continues to be above the detection threshold. Such a possibility allows an estimate of the time over which a lobe may fade as a result of expansion losses.
Alternately, it may be that the ambient gas density is greater on the side of the shorter lobe and that causes the jet advance speed on that side to be lower and also ram-pressure impedes the expansion loss in the relict lobe on the same side. In the case of J0031.1-6642, the optical host is once again star-like and the two close-in lobes appear compact with little diffuse structure; the phenomenology in this case may be the same. However, it may be noted that neither source shows a jet on the side of the more distant lobe, which is expected owing to beaming effects if light-travel-time is responsible for the observed asymmetries.
We describe two other interesting restarted sources below. J0023.6-6710 (Fig. 3) is a source with a triple structure. It is a 1 arcmin source with three separate components all aligned along an axis. The strong core is accompanied by a weak extended feature to the south-east and to the north-west by a strong extended source. The NW source is the strongest and it has a jet-like short extension to the NW, again aligned with the main radio axis. This stronger and more extended NW component is identified with a galaxy that appears to be a member of a close group of four galaxies. We have a redshift measurement available for the central galaxy associated with the NW component: . The redshift we infer for the galaxy associated with the central core is . Given their common axis and the extensions along that axis for two outer sources it appears likely they are all related. A likely scenario is that the triple is a restarted FR-II radio source where the NW lobe happens to be co-located with the cluster radio emission.
J0028.9-6631 (Fig. 15) is a source similar to J0023.6-6710. It is triple with a bright core identified with a faint object. The core is straddled by two very dissimilar radio sources. The northern source is edge-brightened and extended towards the core and at high resolution shows a hotspot. This NW lobe is associated with a group of three bright galaxies. None of it is located at the hotspot peak. The southern source is a weak elongated relic-like lobe extended towards the core. We have classified the source as a restarted FR-II radio galaxy where one lobe shows a hotspot whereas the opposite lobe is a relic. Alternately, the northern lobe could be much fainter and below the survey sensitivity.
Three of the ATLBS-ESS restarted sources (J0037.3-6647 and J0104.3-6609 both of which are FR-II sources and J0049.3-6703, which is an FR-I source) are not apparent at 843 MHz in the SUMSS survey. All of the other restarted sources detected in the ATLBS survey are significantly larger in angular size in the ATLBS images compared to that in SUMSS, in some cases the angular extent detected in ATLBS is more than a factor 2 of the SUMSS extent. The diffuse, disjoint tail-like elongated emission observed in the two sources — J0035.0-6612 and J0031.8-6727 — are not detected in 843 MHz SUMSS images, whereas in J0031.1-6642 the relic emission is detected in SUMSS at 5 times the image rms noise. The ATLBS survey, with its order-of-magnitude higher surface brightness sensitivity, has indeed facilitated recognition of restarted radio galaxies.
The outer lobes in restarted FR-II radio galaxies are in several cases lobes where there are no hotspots and hence are relic lobes with relatively low surface brightness. The lobes associated with the 17-arcmin giant radio galaxy, J0034.0-6639 (Fig. 29) are the faintest (1 mJy arcmin; also see next section) followed by the lobes of J0022.7-6652 (Fig. 2) and the 4-arcmin cluster source, J0027.2-6624 (Fig. 11) both with surface brightness about 3.7 mJy arcmin. The median surface brightness of these faintest lobes of the restarted FR-II source sample is about 6 mJy arcmin; these are detected in ATLBS images a factor 50 above the image thermal noise. With no other examples of large angular size faint emission regions (other than the 17-arcmin giant radio galaxy or the 4-arcmin cluster radio source) there is indeed a dearth of large angular size low-surface-brightness radio source components.
In Table 2 we give a summary of the source categories found in the ATLBS-ESS.
| Total | 119 |
|---|---|
| FR-I | 55 |
| FR-II | 64 |
| FR-I | |
| Relics | 2 |
| Restarts | 7 |
| 22 | |
| FR-II | |
| Relics | 2 |
| Restarts | 21 |
| GRGs | 14 |
| FR-I | 0 |
| FR-II | 14 |
| Name | RA | DEC | redshift | LAS | Linear size |
|---|---|---|---|---|---|
| J2000 | J2000 | arcsec | Kpc | ||
| J0023.6-6710 | 00:23:44.51 | -67:11:07.9 | (1.41) | 84 | 714 |
| J0028.9-6631 | 00:29:01.89 | -66:31:52.8 | (1.78) | 105 | 897 |
| J0031.0-6744 | 00:31:01.60 | -67:44:42.8 | (1.31) | 84 | 710 |
| J0031.8-6727 | 00:31:48.23 | -67:27:17.1 | 1.156 | 102 | 845 |
| J0034.0-6639 | 00:34:05.61 | -66:39:35.2 | 0.110 | 1020 | 2022 |
| J0035.4-6636 | 00:35:25.28 | -66:36:09.0 | (2.4) | 90 | 744 |
| J0038.6-6732 | 00:38:36.11(a)(a)These sources have identifications that are too faint to determine reliable r-magnitudes. Given their faint magnitudes they are expected to lie at relatively high z. | -67:32:01.6 | — | 90 | — |
| J0039.8-6624 | 00:39:53.82(a)(a)These sources have identifications that are too faint to determine reliable r-magnitudes. Given their faint magnitudes they are expected to lie at relatively high z. | -66:24:51.4 | — | 90 | — |
| J0044.7-6656 | 00:44:47.63 | -66:56:39.5 | (0.72) | 108 | 781 |
| J0049.9-6639 | 00:49:58.05(a)(a)These sources have identifications that are too faint to determine reliable r-magnitudes. Given their faint magnitudes they are expected to lie at relatively high z. | -66:39:25.5 | — | 132 | — |
| J0057.4-6606 | 00:57:24.85 | -66:06:30.3 | (1.39) | 90 | 764 |
| J0104.3-6609 | 01:04:21.26 | -66:09:17.3 | (1.19) | 90 | 750 |
| J0104.4-6704 | 01:04:27.68 | -67:04:23.5 | (1.39) | 90 | 764 |
| J0106.8-6645 | 01:06:49.61 | -66:46:07.3 | (1.21) | 108 | 901 |
Note. — Redshifts given in brackets refer to values estimated using the r-band magnitude-redshift relation thus the corresponding linear sizes are also very estimated.
4.4 The lowest surface brightness radio sources
The ATLBS has a 5 detection limit of mJy arcmin, which is deeper than that in wide-field surveys like the WENSS, NVSS or the SUMSS which have detection limits equivalent to 4-9 mJy arcmin at 1.4 GHz. Examples of sources in the literature that have the lowest radio surface brightness are the cluster-wide halo source in Coma (Kim et al., 1990), the unusual relic PKS B1400-33 (Subrahmanyan et al., 2003), the relic Rood27 (Harris et al., 1993) and the giant radio source SGRS J05158100 (Subrahmanyan et al., 2006). The lowest surface brightness source component observed in the ATLBS survey are the lobes of the giant radio galaxy J0034.0-6639 (Fig. 29), which have a surface brightness of 1 mJy arcmin that is three times lower than that of the faintest radio structures known: the 3 mJy arcmin cluster-wide relic in Coma. The lobes of several of the restarted FR-I and FR-II radio galaxies (see Section 4.3) have surface brightness about 2.5-6 mJy arcmin. The lack of more detections of low surface brightness extended radio sources in the ATLBS, along with indications based on X-ray imaging for the existence of expanded radio galaxies with low pressure lobes (Fabian et al., 2009), argues for rapid disappearance of relic radio lobes once the energy injection switches off (also see Machalski et al. (2011)).
J0034.0-6639 is the largest angular size source in the ATLBS. It has giant radio lobes that are amorphous over their whole extent except for a relatively small embedded edge-brightened component in the northern lobe. The structure of this compact feature is best represented in the 6 arcsec resolution image. The location of this component is close to midway along the northern lobe and its structure indicates that it might be the leading head of a new jet propagating through the older radio lobe. Surprisingly, there is no discernible counterpart to this relatively compact feature in the southern lobe. At the lowest resolution of 50” the large-scale source morphology becomes apparent; warm spots are seen towards the leading edges of the giant lobes.
The radio axis is close to the minor axis of the optical host galaxy - a characteristic noted for giant radio galaxies (Saripalli et al., 2009). The source is barely detected in the 45 arcsec, 843 MHz SUMSS image.
4.5 Unusual and interesting sources
J0043.8-6659 (Fig. 51) is a source whose nature is difficult to understand. Its two ’lobes’ are dissimilar in morphology. The eastern component is strong and core-like but extended in a NE-SW direction whereas the western component has an EW jet-like linear structure. There is a bright star-like bluish object seen at the centre between the two components. While it is observed in B and R it almost disappears in K band. There is no radio core and the spectrum of the central object has no emission lines. While several of the characteristics suggest a quasar the lack of emission lines is a problem for the interpretation.
An unusual source is J0056.6-6743 (Fig. 72) where the collinear components could all be related and forming a very asymmetric (in lobe separation) edge-brightened radio source; however, there is a clear optical identification for the eastern, well-removed ’hotspot’ and this casts doubt on the nature of the associations. There are, however, arguments in support of both possibilities - the eastern hotspot may be an unrelated source or it could be the bright end of a northern lobe. Its location on the radio axis of the source and its resemblance to the hotspot at the end of the southern lobe suggest that it is related to the source. Optical spectroscopy of the ID in the NE source could reveal whether it is a star or galaxy.
J0057.1-6633 (Fig. 75): This is an interesting lobe-type, 35 arcsec FR-I radio galaxy that is accompanied by a possible relic emission visible as a weak, extended feature to the SW, aligned with the radio axis but separated by a large gap in emission. At 4” resolution it is completely resolved out except for a weak compact source. Several faint galaxies are seen within the extent of the relic feature. The nature of this SE extended emission region is unclear nor its relation to the FR-I radio source. Its surface brightness is among the lowest known, 2.8 mJy arcmin. The FR-I source is bright at the centre and has edge-darkened lobes. A core is seen at 4” resolution; it is associated with a faint object in R. This object is not seen in B. Unfortunately, at r-band, an artifact extending east-west has prevented a good image of this region.
J0102.6-6750 (Fig. 92) is a large angular size FR-I radio galaxy with a very asymmetric morphology. But for the short jet-like feature to the east and the detached weak source it points to the source could be classified as a head-tail radio soource. Not only are the emission regions on the two sides very different in morphology they are also different in angular extent and total flux.
We have also noted sources, not belonging to the 119 ATLBS-ESS, whose morphologies at 6” resolution are unusual and difficult to classify. At this resolution they appear as a collection of weak 1—3 sigma sources. Several of these sources have recognizable structures in images smoothed to lower resolution, that appear to be at low surface brightness levels of about 5 mJy arcmin. Some however just appear as weak and diffuse elongated emission regions. They did not get selected in the procedure adopted for the ATLBS-ESS. There the procedure involved recognizable structures in 6 arcsec resolution images with angular extent arcsec. However, these sources were observed to be connected sources in the intermediate resolution images (images smoothed to 10 and 20 arcsec beam FWHM). At these resolutions, at least one is of head-tail structure with a galaxy identification, one is a faint linear source with galaxy identification in the central regions, and the others are weak diffuse sources; all have angular extents between 30” and 1 arcmin. The appearence of the some of the sources suggest relic stages of head-tail type or FR-II type radio sources.
4.6 ATLBS-ESS: Galaxy and group halos?
Apart from the sample of 119 sources given in Table 1, we compile ATLBS-ESS sources that are largely devoid of compact components at 4” resolution but are found to have significant flux on extended scales (more than of the flux at 4”). These mJy radio sources are likely candidate halo-type radio sources that may be associated with individual galaxies, groups and clusters. These sources appear as a collection of individual resolved sources, some with a dominant source among them. None has a recognizable radio galaxy structure whether of FR-I and FR-II type. The sample of 23 sources is given in Table 4. We give the centroid positions from the original 50” images along with the ratio (Lres/Hres) of the flux densities in the 50” and 4” images. As we might expect, most appear to be co-located with optical galaxies and galaxy groups. 20 of the 23 sources in this sub-sample were at artifact-free sky locations on SUMSS images; nevertheless, SUMSS does not appear to have detected 16 of the sources. Table 4 provides information on potential associations with optical galaxies and clusters, this is based on examining the r-band images.
| Name | RA | DEC | Lres/ | Comments |
|---|---|---|---|---|
| J2000 | J2000 | Hres | ||
| J0025.5-6710 | 00:25:30.65 | -67:10:41.5 | 3.17 | Bright galaxy group. Includes two |
| discrete but resolved sources. | ||||
| J0025.6-6727 | 00:25:38.57 | -67:27:56.3 | 1.88 | Few faint galaxies seen. |
| J0026.9-6706 | 00:26:55.17 | -67:06:23.5 | 1.72 | Galaxy group. |
| J0027.6-6750 | 00:27:36.62 | -67:50:55.2 | 2.23 | Few faint galaxies seen. |
| J0030.5-6635 | 00:30:30.66 | -66:35:13.2 | 1.59 | Bright group of 4 galaxies. |
| J0030.9-6727 | 00:30:56.63 | -67:27:32.8 | 1.57 | Cluster of faint galaxies. |
| Discrete source with faint Id. | ||||
| J0031.5-6633 | 00:31:31.22 | -66:33:35.7 | 2.37 | Several faint galaxies seen. |
| J0031.8-6617 | 00:31:51.85 | -66:17:46.6 | 1.65 | Galaxies seen, two of which |
| are relatively brighter. | ||||
| J0032.6-6757 | 00:32:39.23 | -67:57:59.5 | 1.60 | Emission associated with bright |
| galaxy with several satellites(?) | ||||
| J0035.2-6730 | 00:35:15.95 | -67:30:34.9 | 3.60 | Several bright galaxies. One |
| discrete radio source has Id. | ||||
| J0035.9-6555 | 00:35:56.28 | -65:55:05.2 | 2.55 | Several galaxies. Several radio |
| sources, one with Id. | ||||
| J0039.1-6717 | 00:39:07.54 | -67:17:17.7 | 2.16 | Several galaxies seen. One offset |
| source with bright galaxy Id. | ||||
| J0040.6-6800 | 00:40:36.30 | -68:00:13.8 | 1.78 | No galaxies within low resolution contour. |
| J0044.2-6713 | 00:44:12.18 | -67:13:50.4 | 2.24 | Rich group of galaxies. Discrete |
| source at centre with bright Id. | ||||
| J0055.9-6802 | 00:55:55.61 | -68:02:49.4 | —- | Outskirts of a large cluster of galaxies. |
| Faint galaxies only. | ||||
| J0100.1-6711 | 01:00:08.67 | -67:11:17.7 | 3.11 | Bright galaxy and several faint galaxies. |
| J0100.3-6749 | 01:00:22.14 | -67:49:27.8 | 1.87 | Several galaxies present. |
| J0101.1-6606 | 01:01:07.68 | -66:06:24.2 | 1.72 | Bright face-on spiral galaxy. |
| Emission centred on spiral. | ||||
| J0101.7-6756 | 01:01:45.88 | -67:56:34.1 | 1.53 | Elongated emission region. No obvious |
| galaxy concentration seen. | ||||
| J0103.7-6755 | 01:03:44.76 | -67:55:24.9 | 1.77 | Bright galaxy and a few other |
| fainter galaxies. | ||||
| J0105.1-6648 | 01:05:07.82 | -66:48:28.4 | 1.72 | Bright galaxies. |
| J0106.2-6719 | 01:06:16.98 | -67:19:25.7 | 2.49 | Few very faint galaxies seen. |
| J0108.3-6637 | 01:08:19.26 | -66:37:18.5 | 2.09 | Bright galaxy and few faint galaxies. |
5 Discussion and Conclusions
Close to half of the ATLBS-ESS sources are of FR-I type: compared to the 3CRR radio source sample that has significantly higher cutoff in flux density the ATLBS-ESS has three times greater fraction of FR-I type. This is consistent with a morphological evolution wherein the FR-I fraction increases with decreasing flux density.
Significant asymmetry in lobe extents appears to be a common occurrence in the ATLBS FR-I sources compared to FR-II sources ( vs ). The FR-I sources in ATLBS-ESS are mostly of the 3C31-type and not of the double-lobe type morphology that has been suggested in a previous study as dominant. It follows that the increasing abundance of FR-I sources at mJy flux densities is accompanied by a morphological change in the FR-I population towards 3C31-type sources.
We find a large number of relatively high-redshift FR-I sources. These 22 high-redshift FR-I sources form an important database for examining evolution of low power sources because of their robust radio morphological classification unlike previous attempts. The properties of the low and high redshift FR-I sources have been compared. There appear to be no major differences in morphological properties of the high and low redshift samples of FR-I sources.
We identify as many as 14 of the ATLBS-ESS radio sources to be giants with projected linear size exceeding 700 kpc; at least 9 of them are likely to be at redshifts exceeding unity. Based on the 7C survey, Cotter et al. (1996) revealed the prevalence of giant radio sources out to redshift of unity. Compared to the 7C survey, the ATLBS-ESS has relatively higher sensitivity over smaller sky area, and the substantial number of high redshift giants detected in ATLBS-ESS reveals that giant radio sources are not less common at redshifts exceeding unity. The giant sources detected in the ATLBS-ESS have similar radio powers compared to the 7C giants.
We consider herein a model in which the lifetime of an extended radio galaxy consists of (i) an active phase in which the source extent dynamically grows over time, (ii) a dying phase in which the central engine has switched off and the beams cease feeding the lobes, and (iii) a restarting phase in which new activity is seen along with relict lobes created in the previous activity phase.
The fraction of FR-Is and FR-IIs where there are no signatures of on-going nuclear activity remains small, about : consistent with the reported rarity of dead radio galaxies (Blundell & Rawlings, 2000). The finding indicates that even in surveys like the ATLBS in which the surface brightness sensitivity has been substantially improved, a significantly larger number of relict radio sources are not detected. This indicates that the relict or dying phase is short, independent of the survey sensitivity, and perhaps ended by a restarting of the central engine. This last phase ends when the relict lobes are no longer distinctly discernible either because they have faded away owing to losses arising from their emissivity or expansion, or because the new beams have rejuvenated the entire relict lobes.
A new finding of the ATLBS-ESS is that observed morphology of a large number of FR-I and FR-II radio galaxies may suggest signatures of restarted nuclear activity. Nearly one-third of FR-IIs have ”non-classic” morphologies that are more easily associated with a renewed beam activity; in contrast, only one-eighth of the ATLBS-ESS FR-Is show signatures of restarted activity. In the model considered above, it appears that FR-II sources may spend two-thirds of their lifetime in the active phase, one-thirds in the restarting phase, and only a few percent in the dying phase. In the case of FR-I sources, the active phase may be larger and the restarting phase correspondingly smaller. We speculate that such episodic activity may continue over multiple cycles during which the source never disappears from radio surveys, following which the entire episodic activity may cease and the host reverts to a radio-quiet state. These cycles of episodic activity may perhaps be the time during which the source grows and total duration of these activity phases represents the dynamical age of the source. In this scenario, since the active phase is the dominant duration, the dynamical age is close to the true age and spectral ages may be confusing owing to the episodic activity.
We have listed the few radio sources that are observed to have faint, elongated emission regions on one side that are aligned with but separated from the radio galaxy. These are likely to be radio galaxies that have had a previous epoch of activity. We point out that we may be seeing old emission regions that are preserved in a relatively dense ambient medium on one side; alternately, light travel time effects may be enabling the old lobe on the side pointing away from us to be visible (J0031.1-6642 and J0031.8-6727).
The ATLBS has detected among the faintest radio sources known. The giant radio galaxy J0034.0-6639 has lobes that have the lowest surface brightness known. In imaging the faintest relict radio lobes identified in the ATLBS-ESS, which includes this giant radio galaxy and also the aligned but separated faint ’tail’ in the large quasar J0031.1-6642, the survey has shown that relict lobes may continue to maintain their symmetry about the radio axis. This is in contrast to the case in radio sources at centers of galaxy clusters, and is consistent with the expectation that extended radio sources in the intergalactic gas away from cluster environments experience relatively benign weather.
The discussion presented here of the structures in radio galaxies imaged in one of the most sensitive radio surveys is of considerable relevance in the view of the upcoming sensitive, all-sky radio surveys with instruments such as LOFAR and ASKAP. By focusing on the larger of the radio sources imaged in the ATLBS-ESS we have sought to highlight the variety of source structures and science that may be anticipated.
References
- Blundell & Rawlings (2000) Blundell, K. M.; Rawlings, S., 2000, Astronomical Journal 119, 1111
- Bock et al. (1999) Bock, D. C. -J.; Large, M. I.; Sadler, E. M., 1999, AJ, 117, 1578
- Chiaberge et al. (2009) Chiaberge, M.; Tremblay, G.; Capetti, A.; Macchetto, F.D.; Tozzi, P.; Sparks, W.B., 2009, ApJ 696, 1103
- Clewley & Jarvis (2004) Clewley, L.; Jarvis, M.J., 2004, MNRAS 352, 909
- Cotter et al. (1996) Cotter, G.; Rawlings, S.; Saunders, R., 1996, MNRAS 281, 1081
- Dwarakanath & Kale (2009) Dwarakanath, K. S.; Kale, R., 2009, ApJL 698, 163
- Fabian et al. (2009) Fabian, A. C.; Chapman, S.; Casey, C. M.; Bauer, F.; Blundell, K. M.; 2009, MNRAS 395, L67
- Fanaroff & Riley (1974) Fanaroff, B.; Riley, J. M., 1974, MNRAS, 167, 31
- Hambly et al. (2001) Hambly, N. C. et al. 2001, MNRAS 326, 1279
- Hardcastle et al. (1998) Hardcastle, M. J.; Evans, D. A.; Croston, J. H., 2007, 376, 1849
- Harris et al. (1993) Harris, D. E.; Stern, C. P.; Willis, A. G.; Dewdney, P. E., 1993, AJ, 105, 769
- Hota et al. (2011) Hota, A. et al., 2011, arXiv:1107.4742v1
- Kim et al. (1990) Kim, K. -T.; Kronberg, P. P.; Dewdney, P. E.; Landecker, T. L., 1990, ApJ, 355, 29
- Leahy (1991) Leahy, J. P., 1991, Beams and Jets in Astrophysics, ed. Hughes, P.; A., Cambridge University Press, p100
- Ledlow (1997) Ledlow, M. J., 1997, The Nature of Elliptical Galaxies; 2nd Stromlo Symposium. ASP Conference Series, Vol. 116, ed. M Arnaboldi; G.S. Da Costa and P. Saha, p421
- Machalski et al. (2011) Machalski, J.; Jamrozy, M.; Stawarz, L.; Koziel-Wierzbowska, D., 2011, ApJ, 740, 58
- Mauch et al. (2003) Mauch, T. et al. 2003, MNRAS 342, 1117
- Owen & Laing (1989) Owen, F. N.; Laing, R. A., 1989, MNRAS, 238, 357
- Owen & Ledlow (1994) Owen, F. N.; Ledlow, M. J., 1994, The Physics of Active Galaxies; The First Stromlo Symposium. ASP Conference Series, Vol. 54, eds. G.V. Bicknell; M.A. Dopita and P.J. Quinn, p319
- Parma et al. (1996) Parma, P.; de Ruiter, H. R.; Fanti, R., 1996, in IAU Symp. 175, Extragalactic Radio Sources, eds. R. D. Ekers, C. Fanti, & L. Padrielli, (Dordrecht: Kluwer), p137
- Parma et al. (2007) Parma, P.; Murgia, M.; de Ruiter, H. R.; Fanti, R.; Mack, K.-H.; Govoni, F., 2007, A&A 470, 875
- Sadler et al. (2007) Sadler, E. M., et al. 2007, MNRAS 381, 211
- Saripalli et al. (2009) Saripalli, L.; Subrahmanyan, R., 2009, ApJ 695, 156
- Snellen & Best (2003) Snellen, I.; Best, P., 2003, NewAR 47, 225
- Subrahmanyan et al. (2003) Subrahmanyan, R.; Beasley, A. J.; Goss, W. M.; Golap, K.; Hunstead, R. W., 2003, AJ, 125, 1095
- Subrahmanyan et al. (2006) Subrahmanyan, R.; Hunstead, R. W.; Cox, N. L. J.; McIntyre, V., 2006, ApJ, 636, 172
- Subrahmanyan et al. (2008) Subrahmanyan, R.; Saripalli, L.; Safouris, V.; Hunstead, R. W., 2008, ApJ, 677, 63
- Subrahmanyan et al. (2010) Subrahmanyan, Ravi; Ekers, Ron D.; Saripalli, Lakshmi; Sadler, Elaine, M., 2010, MNRAS, 402, 2792.
- Thorat et al. (2011) Thorat, K.; Subrahmanyan, R.; Saripalli, L., 2011, in preparation
- Zirbel & Baum (1995) Zirbel, E. L.; Baum, S. A., 1995, ApJ, 448, 521
|
|
|
|
|
|
|
|
|
|
|
|
|
|
|
|
|
|
|
|
|
|
|
|
|
|
|
|
|
|
|
|
|
|
|
|
|
|
|
|
|
|
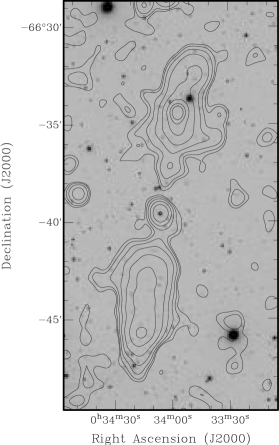
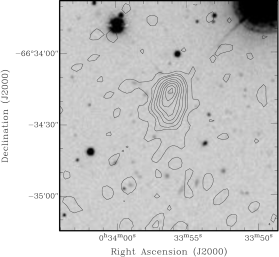
|
|
|
|
|
|
|
|
|
|
|
|
|
|
|
|
|
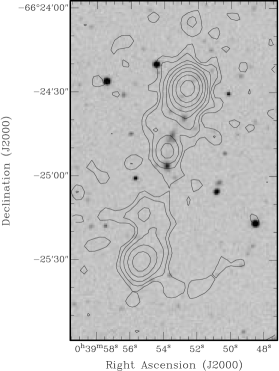
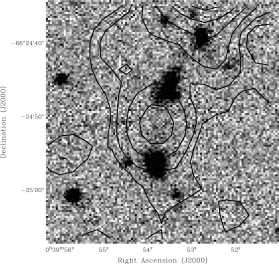
|
|
|
|
|
|
|
|
|
|
|
|
|
|
|
|
|
|
|