Global Networks of Trade and Bits00footnotetext: The authors thank participants at the Trade NetWorkShop 3.0 (Trento, December 2010), and at ARS’11 (Naples, June 2011) for insightful comments on an earlier draft of this paper. They blame each other for all other mistakes.
Abstract
Considerable efforts have been made in recent years to produce detailed topologies of the Internet. Although Internet topology data have been brought to the attention of a wide and somewhat diverse audience of scholars, so far they have been overlooked by economists. In this paper, we suggest that such data could be effectively treated as a proxy to characterize the size of the “digital economy” at country level and outsourcing: thus, we analyse the topological structure of the network of trade in digital services (trade in bits) and compare it with that of the more traditional flow of manufactured goods across countries. To perform meaningful comparisons across networks with different characteristics, we define a stochastic benchmark for the number of connections among each country-pair, based on hypergeometric distribution. Original data are thus filtered by means of different thresholds, so that we only focus on the strongest links, i.e., statistically significant links. We find that trade in bits displays a sparser and less hierarchical network structure, which is more similar to trade in high-skill manufactured goods than total trade. Lastly, distance plays a more prominent role in shaping the network of international trade in physical goods than trade in digital services.
JEL Codes: F14, L86, O33
Keywords: Internet, international trade, network analysis, distance, outsourcing, hypergeometric
1 Introduction
The impact of the Internet on the global economy has been widely debated. Two main effects have been considered: (a) the “death of distance” conjecture (Cairncross, 1997; Friedman, 2005; Leamer, 2007) and (b) the global digital divide. To test these two claims concerning the impact of distance on information and information-intensive goods, as well as access by less developed countries to the digital web and the consequences of the digital divide on trade and economic growth, scholars should focus on the co-evolution of trade and computer networks. Such an analysis would also contribute toward shedding new light on the impact of foreign direct investments (FDIs) and offshoring on trade. An increase in horizontal and vertical FDIs does imply a surge in coordination and information costs. Thus, we should expect information flows to increase and partially substitute trade flows (Navaretti & Venables, 2004).
The standard explanation as to why distance matters for trade is that transport costs increase with distance. Access to information about foreign markets and potential trading partners is also facilitated by proximity. This implies that major improvements in information and communication technologies (ICTs) should reduce the importance of distance for trade. The “death of distance” conjecture has been scrutinized and widely questioned, since there is evidence that the negative impact of distance on trade did not decrease after the Internet revolution (Freund & Weinhold, 2004; Disdier & Head, 2008; Berthelon & Freund, 2008). Conversely, gravity equation estimates on long-term horizons find an increase in the negative impact of distance on trade (Coe, 2002; Brun et al., 2005). In addition, it has been found that Internet relationships are also constrained by distance (Blum & Goldfarb, 2006; Mok et al., 2007; Hortaçsu et al., 2009).
Computer scientists have been analysing the structural properties and growth of the world network of computers since the late 1990s (Faloutsos et al., 1999; Huberman & Adamic, 1999; Pastor-Satorras & Vespignani, 2004). More recently, the same network analysis techniques have been applied to studying the world trade network (Serrano & Boguná, 2003; Garlaschelli & Loffredo, 2004, 2005; Fagiolo et al., 2008). Although the two streams of literature adopt the same methodological approach, the theoretical discussion about the impact of the Internet on world trade has not yet been tested. The main reason why the world networks of computers and trade have never been jointly analysed has to do with the different levels of aggregation at which the two webs are examined and the lack of methodological tools to compare the dynamics of multiple networks. The Internet topology has been typically investigated at the level of IP addresses. A complete coverage of the world network is still lacking, and only recently aggregate data at the levels of Autonomous Systems (AS) and countries have been released.
Conversely, international statistics on the world trade of goods have long been compiled, and in recent years disaggregated data at the level of single exporting firms have become available. Moreover, only recently has the literature on complex network analysis started to focus on weighted networks (Newman, 2004; Fagiolo et al., 2008; Bhattacharya et al., 2008) and the co-evolution of multiple interdependent networks (Buldyrev et al., 2010).
AS topology data seems to represent a very promising data source to measure the economic involvement in the digital economy of the various national economic systems, in a field where traditional data are difficult to collect or not available at all. For instance, while some statistics on the pervasiveness of ICT and exposure to Internet traffic do exist, figures on the trade of information and telecommunication services (or even services alone) are lacking (Head et al., 2009). In this respect, complementing the existing economic figures with Internet topology data inferred at AS level may be a way to characterize the relative involvement (and its evolution over time) of the various countries in the digital economy, and to map the international trade of digital goods and outsourcing (Bhagwati et al., 2004).111We refer here to the definition of outsourcing used in Bhagwati et al. (2004, p. 93), i.e. “long-distance purchase of services abroad, principally, but not necessarily, via electronic mediums”.
It should be noted that the services sector is the largest contributor to a country’s economy and is correlated to a country’s level of development (ranging from about 50 per cent of GDP, in the case of low-income countries, up to 70 per cent, in the case of high-income ones). In addition, over the past two decades the growth of trade in services has grown almost fivefold, while trade in goods has “only” done so by a factor of 3.5 (Lennon, 2009). The growing importance of services in national economies and international trade is largely due to an increase in the production of intermediate services (i.e., outsourcing). Besides the economic importance of services activity in general, and services outsourcing in particular, this phenomenon has received a huge amount of attention in the media and in political debates (Hamilton & Quinlan, 2007) and the sector has increasingly been included in the framework of multilateral negotiations and regional trade agreements (WTO, 1998).
The economic literature also hosts a lively debate on the role of ICT investments and capital in contributing to the productivity, growth and competitiveness of national systems, in the case of both developed and developing countries. Some authors have argued that the relative importance of the ICT-producing sector in different countries, and its growth over time, may be a factor contributing to the differences in growth performance which have recently been observed in several OECD countries (Pilat et al., 2002). As such, these are sound arguments advocating the need for policies explicitly targeting ICT for development. These concerns have also gathered momentum in the agenda of many governments: in response to the recent economic crisis, many countries have implemented policies aimed at containing the cyclical impact of the recession and at reviving the economy. Compared with the past, where interventions gave priority to physical infrastructures, recent policies are distinguished by their greater attention to public intervention in the realms of digital infrastructures and how such a stimulus can affect productivity, innovation, sustainability and the quality of life (Andes & Castro, 2009). However, in their present state, many studies on the relationship of ICT investment with growth and productivity pose more questions than answers. For instance, while evidence at sectoral level on the effects of ICT on productivity and growth for some major countries such as the US and Australia are incontrovertible, for many other OECD countries observed improvements are less straightforward (van Ark et al., 2008). Disparities in accessing the Internet are increasingly viewed as an important sources of poverty and inequality, and leveling the playing field in broadband network access is viewed as a key factor in reducing inequalities (Mehra et al., 2004). One explanation of such different returns on ICT investment may be related to different national capabilities in leveraging those investments in terms of competitiveness and involvement in international trade. While there is a considerable amount of data on ICT investment and on the international trade of physical goods, almost no data or research focus on issues such as the flow of digital bits, the international trade in ICT service industries, or how Internet penetration and broadband connectivity affect the competitiveness of economic systems or the international provision of services (but see Freund & Weinhold, 2002, 2004, for notable exceptions). Starting from such limitations in the literature, in this paper we use the data on Internet interconnectivity as a proxy measure for the International Trade in Service (ITS) and evaluate those data to measure the involvement of the various countries in the international trade of digital goods and services.
The contribution of the paper is threefold. First, to the best of our knowledge this is the first time that the network of international Internet connectivity has been analysed at country level and used to proxy the amount of trade in digital services. Second, we provide a detailed comparison between trade in digital and physical goods, and analyse the different role played by distance in shaping the two networks. The third contribution is methodological and compares networks featuring different characteristics. To perform meaningful comparisons, we propose a stochastic approach based on hypergeometric distribution.
The paper is organized as follows: in the next section we introduce the various datasets used in this study and, due to their differences (e.g., type of data, methods of data collection), we describe the methodology used to increase the comparability between them. Section three reviews the major findings arising from network analysis of the Bits and the various Trade datasets. In Section four, we discuss our results and provide some further conclusive remarks.
2 Data and Methodology
2.1 Internet Data
In this paper, we make use of data regarding the high-level architecture of the Internet collected within the research activities of the DIMES (Distributed Internet Measurement and Simulations) project.222DIMES is a distributed research collaboration project, which aims at studying what the Internet looks like and how it evolves over time. The project, coordinated by a research team at Tel Aviv University, has employed over the past few years, thousands of volunteers in over one hundred countries, to gather data on Internet topology and has generated one of the most extensive and reliable datasets freely available for research purposes. See Shavitt & Shir (2005) and http://www.netdimes.org for additional information on the project.
The basic unit of observation is represented by an Autonomous System (AS), which are Internet Service Provider (ISP) or other large subnetworks into which the Internet is divided (these are parts of the network belonging to a single administrative unit, such as a university, business enterprise, or business division). ASs may be viewed as high-level nodes, so that data exchanges among them are the edges of a high-level Internet map. Information related to interconnectivity between ASs has remained largely unknown until recently, since ISPs and other business operators are generally not willing to disclose their connectivity strategies publicly. Nevertheless, composing a truthful map of the Internet is viewed by network researchers as a very important task for routing efficiency, scalability, security, and many other reasons. As a result, in the past ten years many efforts have been made toward providing reliable measures of AS interconnectivity.
Such attempts of monitoring network packets via traceroute and ping algorithms have reproduced significant parts of the network through random sampling. The DIMES project has implemented these techniques by means of a distributed multi-point infrastructure (composed of lightweight measurement software hosted by volunteers on computers all over the globe), which has increased both the number of edges and nodes discovered and improved the representativeness of the data collected, with respect to the whole Internet. Since the beginning of the project (September 1, 2004), the project has collected 10,833,966,958 independent measurements (records of data exchange between two ASs), occurring between 29,404 ASs distributed in 224 countries and along 204,204 edges, using a total of 24,421 software agents distributed in over 121 countries of the world.
As regards data preparation, the original dataset describes an edge in terms of: (i) the city and country of the source and destination nodes; and (ii) the number of distinct couples of ASs which were observed exchanging traffic between the two cities during a given month. In order to derive the country-country adjacency matrix for the year 2007, we dropped intra-country exchanges and consolidate edges at country and year levels. The result of this aggregation is a square matrix whose entries show the number of distinct ASs that were observed communicating during the year between any pair of countries.
There are some comments regarding the quality of the dataset which are worth making. As previously mentioned, the data were collected via sampling techniques and do not provide the complete set of interconnections among ASs. In spite of this, the DIMES data are based on a large, distributed set of observation points which, with respect to the techniques based on smaller sets of agents or other passive monitoring techniques, should improve the data in at least three different way: by enlarging the absolute number of discovered nodes and edges; increasing the share of discovered peer-to-peer links (thus diminishing the bias toward customer-provider links); and minimizing the so-called “small observer population” bias, according to which sampling from a few nodes may result in power-law distributions of links even in the case of ordinary random graphs.
Regarding the previously defined “intensity of exchange” measure, the figures build upon the aggregation of various observations on the interconnections which take place between pairs of ASs in different countries, in a given period of time. In this sense, although these figures simply signal the existence of distinct connections, we treat them as a rough proxy of the intensity of data exchange (and by extension, as an even rougher proxy for digital trade). It should be stressed that we are not able to observe the amount of data exchanged (which would be a proper measure of magnitude of traffic flow). In addition, these figures may be further biased by different practices employed by different ASs as regards the assignment of IP numbers to computers (to name just one example: an AS might decide to make extensive use of virtual IP addressing, which results in the same machine responding to a plurality of IP numbers, which would increase the intensity figures of our dataset). Lastly, aggregating monthly values into yearly ones (by simply adding up the figures) may partially counterbalance our inability to distinguish between more and less intense traffic exchange, since stable, recurring links are weighted more than unstable ones in the resulting measure of exchange intensity.
Against this background we should remind that existing international service trade datasets suffer from severe limitations: for instance, the World Bank’s World Development Indicators, although providing the time and country coverage, do not offer bilateral trade data. Of the bilateral datasets, Eurostat only covers 31 countries, and the OECD only four large categories of service, which do not allow us to focus on the sectoral specificities of the digital economy (Head et al., 2009).
2.2 Trade Data
We use trade data taken from the BACI dataset maintained by CEPII (Gaulier & Zignago, 2010), which collects information on bilateral trade flows among over 200 countries, at the 6-digit level of the Harmonized System (HS) classification. In our analysis, we focus on the year 2007, although choosing a different year does not alter the results. Total bilateral trade is obtained by aggregating 6-digit HS flows for each country pair. Data are expressed in thousands of US dollars, and display a lower cutoff at 1,000 dollars. In addition, to enhance comparability with data on Internet topology, we look at the number of HS-6 products traded by each country pair, and perform a decomposition of goods according to the skill intensity associated with their production. Starting from Peneder (2007) we define two broad classes of goods, high-skill and low-skill, based on the ISIC sector with which each HS-6 product can be associated.333Peneder (2007) provides an international classification of sectors, ranging between 1 (very high) to 7 (very low), referring to the educational intensity of the sector. In our work, high-skill products are associated with sectors ranging from 1 to 3, i.e., 20 out of the 56 sectors classified by Peneder (2007).
When merging the two datasets, we retain only the countries which are present in both samples, to enhance comparability. We end up with a common set of 189 nodes, populating both trade and Internet networks.444The complete list of countries analysed is available in Appendix A.
2.3 Methodology
The way in which the DIMES data was sampled makes a direct comparison between the Bits and Trade networks unreliable. Strong heterogeneity in the number of relationships in the two networks does make it very difficult to discriminate links which only reflect the data collection method from those which provide useful information on the properties of the system. To address this issue, we used a stochastic benchmark for normalization purposes, similar to that recently proposed by Micciche et al. (2011). This method is regularly used in genetics to identify statistically significant relationships (Tavazoie et al., 1999), and a similar approach has been applied to identify statistically significant cliques and clusters in networks (Alba, 1973; Wuchty et al., 2006).
Normalization is the typical strategy used to compare networks: it may be applied to either rows or columns, or to the entire adjacency matrix (for example, rescaling all trade flows as percentages of the total amount of trade flow in the whole matrix). Normalization may also be applied to both rows and columns, iteratively. For example, if we want an “average” number to put in each cell of the trade flow matrix, so that both rows and columns add up to 1, we can apply the iterative row and column approach. This is sometimes used when we want to give “equal weight” to each node, and to take into account the structure of both outflows (rows) and inflows (columns).
Rescaling can be helpful in highlighting the structural features of the data but, obviously, different normalizing approaches highlight different features.
For two countries, A and B, let be the number of goods exported by country A and the number of goods imported by country B. The total number of traded goods is and the observed number of goods exported from A to B is . Under the null hypothesis of random co-occurrence, that is to say, customers in country B are indifferent to the nationality of the exporter, the probability of observing goods traded is given by the hypergeometric distribution (Feller, 1950)
| (1) |
We can associate a -value with the observed as
| (2) |
Note that the described null hypothesis directly takes into account the heterogeneity of countries with respect to the number of goods traded (row and column totals). For each pair of countries, we separately evaluate the -value for each trade relationship and then use different cutoffs to select only those links which represent a significant departure from the hypergeometric benchmark (). The resulting matrices are then dichotomized. The hypergeometric multi-urn benchmark is equivalent to the Monte Carlo degree-preserving network rewiring procedure (Maslov & Sneppen, 2002).555Alternative normalization procedure has been applied to trade networks (Serrano et al., 2007). In particular, departures from the Gravity benchmark were examined (Krempel & Plumper, 2003). Thanks to our stochastic approach we can treat a weighted network as a random graph in which any link has a probability of occurrence.
3 Results
We first describe here the results on the topological properties of the Internet and Trade networks (Section 3.1) and then analyse the role of distance in shaping bilateral links (Section 3.2).
3.1 Topological properties
Density
As the data on Internet connectivity were collected via sampling and do not represent the universe of AS links, we expect the Bits network to be less dense than the trade one. This is indeed one of the issues which led us to use a stochastic approach before running comparative analyses. Table 1 lists the relevant information on the density of the various networks, plus the share of bilateral (i.e., reciprocal) connections (in brackets).
Density is indeed much higher for Trade than for Bits in the original data (64 Vs 13 percent). Although reduced, this difference remains very large, even for statistically significant ties based on hypergeometric distribution (3.5 Vs 14 percent, and 2.1 Vs 8.6 percent respectively).
When considering the distinction between high- and low-skill products, we do observe that the density of the first network is lower, in line with our hypothesis that products associated with higher skill requirements are more similar to trade in digital services. It is interesting to note that, when focusing on the most demanding threshold (i.e., only those links which take on values with a probability of below ), the difference between high- and low-skill products becomes particularly important, as density for the former is half that of the latter, which remains very similar to the density of the whole trade network. However, the digital network always remains less dense.
| Bits | Trade | Trade-Hi | Trade-Lo | |
| real | 13.382 | 64.055 | 49.983 | 61.511 |
| (69.480) | (86.760) | (79.890) | (85.210) | |
| cut 0.05 | 3.462 | 13.999 | 11.393 | 13.610 |
| (43.250) | (61.080) | (58.790) | (60.170) | |
| cut | 2.142 | 8.646 | 4.889 | 8.190 |
| (36.790) | (60.220) | (51.240) | (59.450) | |
| Data expressed in percentage points | ||||
| Figures in brackets: share of bilateral links. | ||||
Bilateral links represent the majority of connections, and this is particularly true for trade in goods, where less than 15 percent of links are not reciprocated. This share doubles for Internet connections, and once again the difference remains sizable after hypergeometric filtering.
This finding —that the Bits network is less reciprocal than the Trade one— is not surprising, when we consider that there are global content providers located in a few countries (e.g., the USA) which distribute contents worldwide, generating large asymmetries in the balance of the flow of bits with respect to countries which are more marginal in production and distribution of digital contents. Thus, in the case of such disparities, sampling measurements may be unable to report any activity in one direction of flow between two countries.666In addition, in the case of the Bits network, there is nothing similar to the trade balance, so disparities in fluxes in principle do not create any imbalance for a country.
Network density figures suggest that many more country pairs are involved in world trade than in Internet connectivity. Although it is probably true that more countries participate in trade in goods, not least because this is a much older activity, a lower density for the AS network also suggests that the Internet is more polarized, with strong connections among a smaller set of actors. To further examine this conjecture, we now turn to other network statistics.
Node Degree
The average total degree is much higher for the Trade network than for Bits, as one would expect from the higher density of the former. Again, hypergeometric filtering reduces this difference, but does not substantially alter the picture, and we continue to observe that, while the network of low-skill products is very close to the whole trade network, high-skill goods display behavior that is more similar to that of the Internet. This similarity is reinforced by hypergeometric filtering.
On average, each country has approximately 136 trade partners, but it connects to ASs located in just over 30 foreign countries, as Table 2shows. When we focus only on the strongest links, we find an average number of 22.72 trade partners compared with only 6.57 connections with foreign ASs. Remarkably, as mentioned above, countries involved in trade of high-skill products on average only exchange them with 13.67 other countries.
| Average Total Degree | ||||
| Bits | Trade | Trade-Hi | Trade-Lo | |
| real | 32.836 | 136.370 | 112.868 | 132.741 |
| cut 0.05 | 10.201 | 36.561 | 30.243 | 35.778 |
| cut | 6.571 | 22.720 | 13.672 | 21.640 |
| Average In/Out Degree | ||||
| Bits | Trade | Trade-Hi | Trade-Lo | |
| real | 25.159 | 120.423 | 93.968 | 115.640 |
| cut 0.05 | 6.508 | 26.318 | 21.418 | 25.587 |
| cut | 4.027 | 16.254 | 9.191 | 15.397 |
| Max/Min Total Degree | ||||
| Bits | Trade | Trade-Hi | Trade-Lo | |
| real | 171 / 1 | 188 / 28 | 188 / 14 | 188 / 26 |
| cut 0.05 | 111 / 0 | 125 / 8 | 116 / 5 | 127 / 7 |
| cut | 80 / 0 | 106 / 2 | 54 / 1 | 103 / 2 |
Differentiating between in- and out-degree (imports and exports) does not substantially alter the picture. On average, the number of in- and out-partners coincides because, for the world as a whole, every exporting relationship needs to have an importing counterpart.
The bottom panel of Table 2 displays the maximum and minimum numbers of partners in each of the networks. Here the difference is less severe, as both Trade and Bits networks have “extreme” cases of very well-connected and very poorly connected players. However, in the Bits network, none of the countries is fully connected (whereas this does happen in the case of goods). The sharper differences concern the minimum degree, as the least connected country in the world trade web still exchanges goods with some 28 partners. The effect of thresholds becomes very evident here: by pruning not statistically significant links, hypergeometric filtering makes the minimum total degree very similar across the different networks.
Degree Distribution
To clarify the different behavior of node degree across the various networks, Figure 1 shows the distribution of node total degrees for the four networks. It shows both the estimated kernel density (left), and the counter-cumulative distribution function (CCDF) in double-log scale (right).
The Bits network is characterized by a much more skewed distribution at all levels of observation, whereas trade in low-skill goods is almost indistinguishable from the whole trade network, and the network of high-tech goods lies somewhere in between. A comparison of the top row (original data) with the distributions obtained after applying the hypergeometric filtering, highlights the importance of the latter in comparing networks with different features adequately. Indeed, the shape of the degree distribution for the various trade networks changes substantially once we apply the cutoffs, and the difference with respect to the Bits network is reduced.
None of the CCDF approaches the straight line which represents a power-law distribution, although the right tail of the CCDF for Bits is characterized by portions which resemble a power-law.
Assortativity
So far we have only looked at single-node characteristics, from which we cannot infer much information about the structure of the links. We turn now to the second-order features of the graphs, by looking at the assortative structure of the networks.
Table 3 lists the simplest characterization of assortativity, i.e., Pearson’s degree correlation. We see that all the networks display a disassortative structure, in which nodes with low degree tend to link with high-degree partners.777This is consistent with previous results. See for instance Mahadevan et al. (2006) on the Internet topology, and Bhattacharya et al. (2008); Fagiolo et al. (2008, 2009) on trade. We can also appreciate the importance of the filtering procedure, as in the original data the Bits network has the larger correlation (in absolute values), while the ranking is reversed once we focus only on the strongest links.
This result implies that, in the Bits network, many of the core-periphery links (i.e., those between high- and low-degree nodes) tend to be weak and do not stand up to hypergeometric filtering.
| Bits | Trade | Trade-Hi | Trade-Lo | |
|---|---|---|---|---|
| real | -0.407 | -0.311 | -0.355 | -0.312 |
| cut 0.05 | -0.177 | -0.270 | -0.285 | -0.273 |
| cut | -0.165 | -0.289 | -0.270 | -0.288 |
Average K-neighbors degree
A less synthetic way of looking at assortativity is K- neighbor degree (Knn), i.e., the average degree of partners of nodes with a given degree. Figure 2 plots Knn for the various networks. Although the three trade networks are very similar, the top-left panel shows that, when looking at the strongest link only (using the most stringent threshold), the Bits network has a flatter Knn profile, signalling that the average degree of each country’s partners is less dependent on its degree than in the case of trade.
Degree – Average Nearest Neighbor Degree Correlation
This feature also emerges from another measure of assortativity, i.e., the correlation between node degree and the average degree of its neighbors (ANND). Table 4 distinguishes between in- and out-degrees and lists correlations between the out-degree of a node and the average in-degree of its partners (top panel), as well as that between the in-degree of a country and the average out-degree of its partners (bottom panel). These measures can define whether large-scale exporters tend to ship goods to countries which import from many sources and, vice versa, whether countries which import from many suppliers do so prevalently from countries which serve many customers.
| Out Degree – | ||||
| Bits | Trade | Trade-Hi | Trade-Lo | |
| real | -0.271 | -0.973 | -0.961 | -0.968 |
| cut 0.05 | -0.141 | -0.647 | -0.651 | -0.624 |
| cut | 0.018 | -0.325 | -0.067 | -0.276 |
| In Degree – | ||||
| Bits | Trade | Trade-Hi | Trade-Lo | |
| real | -0.629 | -0.982 | -0.972 | -0.978 |
| cut 0.05 | -0.235 | -0.684 | -0.620 | -0.705 |
| cut | -0.075 | -0.704 | -0.522 | -0.713 |
| All correlations are significant at 1%. | ||||
We find that the Trade networks feature a much stronger negative correlation between node degree and ANND, but there is also a substantial difference between the top and bottom panels of Table 4. In the former case, when looking at the relation between the number of export markets served and the average number of suppliers they have, the negative correlation for high-skill goods is very close to zero, whereas the figure for the Bits network becomes slightly positive. Hence, for both digital services and trade in high-skill goods, we do not find a strong link between the number of export partners and the number of import relationships which they maintain.
The same is not completely true when we reverse the direction of the edges and look at the correlation between in-degree and (bottom panel of Table 4). In this case, Bits maintain a weak (negative) correlation, whereas Trade-Hi displays a quite strong one. In addition, the correlations are always stronger in the bottom panel than in the top one.
Clustering
Assortativity provides us with some information about the structure of the network, by telling us whether nodes with high degree tend to connect to partners with a similar number of connections. To understand how these partners interact among themselves we can look at clustering, which tells us how likely it is for someone’s partners to be also linked.
On average, the clustering coefficient is quite high in all networks built from the original data, but its value decreases markedly once we control for the hypergeometric benchmark, meaning that many of the triangles observed in the network show weak ties which do not stand up to the hypergeometric test (see Table 5). This appears to be particularly true for the Bits network. Interestingly, here there is not much difference across types of goods, since high- and low-skill goods differ very little, whereas the Bits network is much less clustered.
| Bits | Trade | Trade-Hi | Trade-Lo | |
|---|---|---|---|---|
| real | 0.726 | 0.835 | 0.798 | 0.827 |
| cut 0.05 | 0.288 | 0.448 | 0.440 | 0.439 |
| cut | 0.234 | 0.465 | 0.444 | 0.460 |
The correlation between node degree and clustering is again negative and significant, much stronger for the three Trade networks than for the Bits case. When looking at the results pertaining to the stricter threshold, the correlation for Bits is close to zero. Once again, this confirms that trade in digital services, as opposed to trade in physical goods, is characterized by a flatter, less hierarchical structure.
| Bits | Trade | Trade-Hi | Trade-Lo | |
|---|---|---|---|---|
| real | -0.349 | -0.930 | -0.957 | -0.932 |
| cut 0.05 | -0.180 | -0.701 | -0.639 | -0.663 |
| cut | -0.024 | -0.562 | -0.391 | -0.531 |
RICH CLUB
A simple way of characterizing the hierarchical structure of a network is provided by the rich-club coefficient (Zhou & Mondragon, 2004; Colizza et al., 2006).
Figure 3 shows the results for the rich-club coefficient, computed following Colizza et al. (2006) for the various networks obtained using the 5 percent hypergeometric cutoff.888Results for the original data and the other cutoff value are not shown but are available upon request. The original rich-club coefficient is compared with that obtained for a random network with a similar degree sequence, and meaningful rich-club ordering is observed whenever the normalized coefficient is greater than 1. In all cases, we find a normalized coefficient which is smaller than what we would expect from a random network, suggesting that high-degree nodes (hubs) provide connectivity to regional/local hubs, which in turn are not tightly interconnected. Remarkably, this behavior is much more pronounced in Trade than in Bits, suggesting that stronger links (compared with our null model based on hypergeometric distribution) occurs mainly between the core and the periphery in trade, whereas a larger number of links are found among hubs in the case of the Internet.
We conjecture that this behavior depends on the different role played by distance in hindering link formation in the two types of networks (physical versus digital trade). We now explore this issue.
3.2 The Role of Distance
We can examine the role of distance in shaping international trade relationships in several ways. The simplest is to compare average distance across connected pairs in the various domains, as shown in Table 7.999Distance is defined as the geodesic distance between the largest cities/agglomerations (in terms of population) of two countries. We use data provided by CEPII and available at http://www.cepii.fr/anglaisgraph/bdd/distances.htm . We see that, in the original data, trade partners are on average further away from each other than country-pairs connected by the exchange of Bits. However, once we control for the null model and focus only on the strongest links, the hierarchy is reversed: this is more apparent when moving from the 0.05 threshold to the more stringent cutoff of . The last row of Table 7 does show that average distance is smaller in the three trade networks than in the case of Bits. Hence, stronger links appear to occur at shorter distances, as expected, but this phenomenon is especially marked in the case of trade in physical goods. Note also that, in this case, the similarity between Bits and trade in high-skill goods which we found previously, does not hold, as Trade-Hi undergoes a very sharp drop in average distance between connected pairs from the complete dataset to the most stringent threshold.
| Bits | Only bits | Trade | Only trade | Trade-Hi | Trade-Lo | |
| real | 6904 | 8113 | 7430 | 7570 | 7145 | 7366 |
| cut 0.05 | 4594 | 6900 | 4460 | 4662 | 4132 | 4472 |
| cut | 4128 | 6288 | 3671 | 3794 | 2948 | 3632 |
| Figures in kilometers. Average distance between all countries: Km 8311. | ||||||
Figure 4 provides graphic evidence of the different role of distance in the Trade and Bits networks (with the most stringent hypergeometric threshold, blue edges are links which resist filtering only in the Bits network but are canceled in the Trade network and vice versa for red edges; green edges are persisting links in both networks). The figure shows how the strongest links have a geographical (regional) component for trade in physical goods.
To test the fact that average distances actually differ, we revert to a Wilcoxon signed-rank test (Wilcoxon, 1945), as we cannot assume the population to be normally distributed and use the standard test. We find that the null hypothesis of equality of means is rejected for the original data, but cannot be rejected in the case of the strongest links only. This is consistently with the observation that the average distance for trade links falls down markedly when we trim the trivial links.
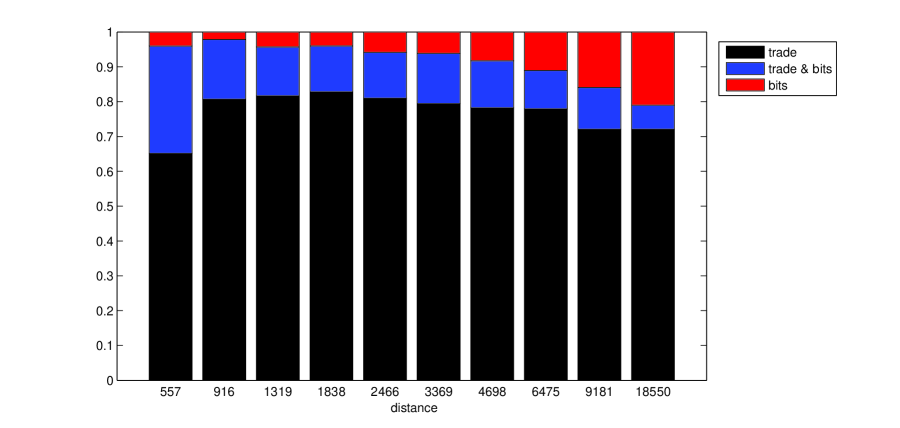
Figure 5 shows that, as distance increases, so does the share of statistically significant links in the Bits networks, while the relative importance of Trade-only connections falls. If we assume that digital connections lower the transaction costs usually associated with distance, then increased connectivity can tilt the proximity-concentration trade-off that needs to be evaluated when comparing the relative merits of export Vs FDI (Brainard, 1997; Markusen & Venables, 2000; Helpman et al., 2004). In this respect, higher digital connectivity can emerge both as a precondition (lower transaction costs spur multinational activities) and as a result (connections with the headquarter) of higher bilateral FDI flows. These, in turn, are associated with higher trade if vertical FDI dominates (as intermediate inputs are shipped back and forth), with lower trade if FDI are horizontal, i.e. if they represent an alternative way to serve foreign markets. Therefore, from a theoretical point of view, the relation between digital connectivity and trade can be either positive or negative. The fact that in the analysis summarized in Figure 5 we find a decline in the relative importance of Trade-only and Trade-Bits connections as distance grows (together with an increase in the number of significant links for the Bits network) suggests that at longer distances horizontal FDI are facilitated by easier communications brought about by the ICT revolution, so that traditional export activities tend to be substituted by new forms of serving foreign markets.
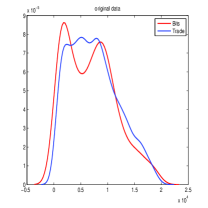
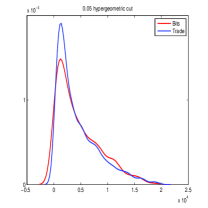
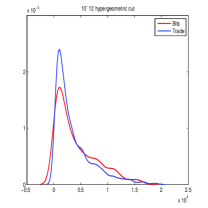
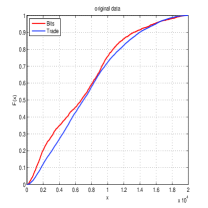
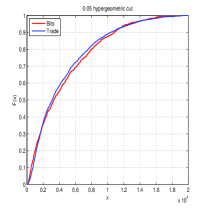
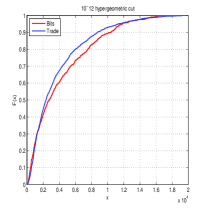
As a further step, instead of looking at average distance only, we take a broader view and compare the distribution of distances across the various networks by means of a Kolmogorov-Smirnov test. Once again, we find evidence of an inversion in the distance ranking between Bits and Trade when moving from the original data to those obtained after hypergeometric filtering. In the former case, we cannot reject the null hypothesis of the distribution of distances for Bits smaller than that for Trade, whereas the opposite holds true for the threshold. Figure 6 shows these findings by displaying a comparison of the distribution of distances in the two networks.
 |
 |
 |
||
 |
 |
 |
Lastly, another way of testing for the correlation between network structure and distance across countries is by a quadratic assignment procedure (QAP, see for instance Krackhardt, 1987; Hubert & Arabie, 1989). This entails computing the correlation between the matrix of hypergeometric cumulative probabilities P and the matrix of physical distances across countries, and comparing it with the values obtained once the rows and columns of P are randomly shuffled.
This correlation turns out to be positive and significant for all four networks. This means that, as distance grows, so does the cumulative hypergeometric probability associated with the link intensity between the two countries. In other words, a positive correlation implies that more distant countries are connected by links whose intensity is increasingly similar to what our null model would predict. Another way of looking at the same result is to say that links which are significantly stronger than the hypergeometric benchmark are associated with lower distances. This correlation is 0.153 for the Bits network but 0.351 for Trade.101010Results do not differ substantially for trade in high-skill (0.360) or low-skill goods (0.349). Hence, the role played by distance in hindering strong connections is more evident in the case of trade in physical goods than trade in digital services.
4 Conclusions
Analysis of topological properties shows that the Bits network is sparser, less dense, with fewer bilateral links with respect to Trade networks, with differences which are higher in comparison with low-skill than high-skill product trade. This indicates that the Internet is a polarized network, with large fluxes occurring among a smaller set of countries. All networks share a substantial disassortative structure but, after hypergeometric filtering, most of the core-periphery links fade out in the Bits network and the underlying structure becomes significantly less disassortative compared with Trade. Clustering and rich club analysis both confirm this evidence: after filtering the data, we find that many triangles observed in Bits disappear, whereas rich club analysis suggests that stronger links occur mainly between the core and the periphery in Trade, a larger number of them occurring among hubs in the case of Bits. Lastly, distance plays a much stronger role in shaping the structure of trade in physical goods than in the case of Bits. When moving from the complete network to an examination only of the strongest links, we do observe that the average distance between partners increases in the Bits network more than in that of Trade.
This analysis leaves a number of interesting avenues for further research, related to open questions. On the methodological ground, one concerns the filtering method based on hypergeometric distribution, and has to do with a way of discriminating better among “large” flows. The analysis also shows that fluxes tend to cluster around zero, so that beyond a certain threshold it becomes increasingly difficult to distinguish among them. We conjecture that, by manipulating the three distribution parameters, it should be possible to increase the power of the hypergeometric test.
A second open question also relates to the use of “small” fluxes (i.e., links whose values are significantly smaller than those predicted by a hypergeometric benchmark) to extract further information about the topological properties of the networks, as well as on their economic and social implications.
On the relationship between trade in goods and digital services we presented some preliminary results on the digital divide and the tyranny of distance that it would be worthwhile to investigate further. Table A.1 in the appendix shows that all countries with no statistically significant link in the high-skill good network have zero or just one linkage in the digital network.111111A notable exception is Iraq, but the presence of international armed forces, with the associated need of connections with home countries, easily explains the peculiar behavior of that country. This evidence suggests that the development of trade in high-skill goods and digital services are intertwined and mutually reinforce each other. Moreover, our findings in this paper reveal that long-distance trade can be partially replaced by digital relationships as these lower the costs of monitoring subsidiaries or foreign affiliates. This can help to explain why —contrary to expectations— the digital revolution did not imply the death of distance for trade.
References
- (1)
- Alba (1973) Alba, R. (1973), ‘A graph-theoretic definition of a sociometric clique’, Journal of Mathematical Sociology 3(1), 113–126.
- Andes & Castro (2009) Andes, S. & Castro, D. (2009), Driving a digital recovery: It investments in the g-20 stimulus plan. The Information Technology and Innovation Foundation, Washington D.C.
- Berthelon & Freund (2008) Berthelon, M. & Freund, C. (2008), ‘On the conservation of distance in international trade’, Journal of International Economics 75(2), 310–320.
- Bhagwati et al. (2004) Bhagwati, J., Panagariya, A. & Srinivasan, T. N. (2004), ‘The muddles over outsourcing’, Journal of Economic Perspectives 18(4), 93–114.
- Bhattacharya et al. (2008) Bhattacharya, K., Mukherjee, G., Saramäki, J., Kaski, K. & Manna, S. (2008), ‘The international trade network: weighted network analysis and modelling’, Journal of Statistical Mechanics: Theory and Experiment 2008, P02002.
- Blum & Goldfarb (2006) Blum, B. S. & Goldfarb, A. (2006), ‘Does the internet defy the law of gravity?’, Journal of International Economics 70(2), 384–405.
- Brainard (1997) Brainard, S. L. (1997), ‘An empirical assessment of the proximity-concentration trade-off between multinational sales and trade’, American Economic Review 87(4), 520–544.
- Brun et al. (2005) Brun, J., Carrère, C., Guillaumont, P. & De Melo, J. (2005), ‘Has distance died? evidence from a panel gravity model’, The World Bank Economic Review 19(1), 99.
- Buldyrev et al. (2010) Buldyrev, S., Parshani, R., Paul, G., Stanley, H. & Havlin, S. (2010), ‘Catastrophic cascade of failures in interdependent networks’, Nature 464(7291), 1025–1028.
- Cairncross (1997) Cairncross, F. (1997), The Death of Distance: How the Communications Revolution Will Change Our Lives, Harvard Business School Press, Cambridge, MA.
- Coe (2002) Coe, D. (2002), The missing globalization puzzle, number 2002-2171, International Monetary Fund.
- Colizza et al. (2006) Colizza, V., Flammini, A., Serrano, M. & Vespignani, A. (2006), ‘Detecting rich-club ordering in complex networks’, Nature Physics 2, 110–115.
- Disdier & Head (2008) Disdier, A. & Head, K. (2008), ‘The puzzling persistence of the distance effect on bilateral trade’, The Review of Economics and Statistics 90(1), 37–48.
- Fagiolo et al. (2009) Fagiolo, G., Reyes, J. & Schiavo, S. (2009), ‘World-trade web: Topological properties, dynamics, and evolution’, Physical Review E 79(3), 036115.
- Fagiolo et al. (2008) Fagiolo, G., Schiavo, S. & Reyes, J. (2008), ‘On the topological properties of the world trade web: A weighted network analysis’, Physica A: Statistical Mechanics and its Applications 387(15), 3868–3873.
- Faloutsos et al. (1999) Faloutsos, M., Faloutsos, P. & Faloutsos, C. (1999), On power-law relationships of the internet topology, in ‘Proceedings of the conference on Applications, technologies, architectures, and protocols for computer communication’, ACM, pp. 251–262.
- Feller (1950) Feller, W. (1950), ‘An introduction to probability theory and its applications.’.
- Freund & Weinhold (2004) Freund, C. L. & Weinhold, D. (2004), ‘The effect of the internet on international trade’, Journal of International Economics 62(1), 171–189.
- Freund & Weinhold (2002) Freund, C. & Weinhold, D. (2002), ‘The internet and international trade in services’, American Economic Review 92(2), 236–240.
- Friedman (2005) Friedman, T. (2005), ‘The world is flat: A brief history of the twenty-first century.’.
- Garlaschelli & Loffredo (2004) Garlaschelli, D. & Loffredo, M. (2004), ‘Fitness-dependent topological properties of the world trade web’, Physical Review Letters 93(18), 188701.
- Garlaschelli & Loffredo (2005) Garlaschelli, D. & Loffredo, M. (2005), ‘Structure and evolution of the world trade network’, Physica A: Statistical Mechanics and its Applications 355(1), 138–144.
- Gaulier & Zignago (2010) Gaulier, G. & Zignago, S. (2010), Baci: International trade database at the product-level. the 1994-2007 version, Working Papers 2010-23, CEPII research center.
- Hamilton & Quinlan (2007) Hamilton, D. & Quinlan, J. (2007), Awakening the Translatlantic Services Economy, Center for Translatlantic Relations, Washington DC.
- Head et al. (2009) Head, K., Mayer, T. & Ries, J. (2009), ‘How remote is the offshoring threat?’, European Economic Review 53(4), 429–444.
- Helpman et al. (2004) Helpman, E., Melitz, M. J. & R.Yeaple, S. (2004), ‘Exports versus fdi with heterogeneous firms’, American Economic Review 94(1), 300–316.
- Hortaçsu et al. (2009) Hortaçsu, A., Martinez-Jerez, A. & Douglas, J. (2009), ‘The geography trade on ebay and mercadolibre’, American Economic Journal: Microeconomics 1(1), 53–74.
- Huberman & Adamic (1999) Huberman, B. & Adamic, A. (1999), ‘Growth dynamics of the world-wide web’, Nature 401(6749), 131.
- Hubert & Arabie (1989) Hubert, L. & Arabie, P. (1989), ‘Combinatorial data analysis: Confirmatory comparisons between sets of matrices’, Applied Stochastic Models and Data Analysis 5, 273–325.
- Krackhardt (1987) Krackhardt, D. (1987), ‘QAP partialling as a test of spuriousness’, Social Networks 9, 171–186.
- Krempel & Plumper (2003) Krempel, L. & Plumper, T. (2003), ‘Exploring the dynamics of international trade by combining the comparative advantages of multivariate statistics and network visualizations’, Journal of social structure 4(1), 1–22.
- Leamer (2007) Leamer, E. (2007), ‘A flat world, a level playing field, a small world after all, or none of the above? A review of Thomas L. Friedman’s The World is Flat’, Journal of Economic Literature 45(1), 83–126.
- Lennon (2009) Lennon, C. (2009), Trade in services and trade in goods: Differences and complementarities, Working Paper 53, Vienna Institute for International Economic Studies.
- Mahadevan et al. (2006) Mahadevan, P., Krioukov, D., Fomenkov, M., Dimitropoulos, X., Claffy, K. & Vahdat, A. (2006), ‘The internet as-level topology: three data sources and one definitive metric’, SIGCOMM Comput. Commun. Rev. 36, 17–26.
- Markusen & Venables (2000) Markusen, J. & Venables, A. J. (2000), ‘The theory of endowment, intra-industry and multi-national trade’, Journal of International Economics 52, 209–234.
- Maslov & Sneppen (2002) Maslov, S. & Sneppen, K. (2002), ‘Specificity and stability in topology of protein networks’, Science 296(5569), 910.
- Mehra et al. (2004) Mehra, B., Merkel, C. & Bishop, A. (2004), ‘The internet for empowerment of minority and marginalized users’, New Media and Society 6, 781–802.
- Micciche et al. (2011) Micciche, S., Tumminello, M., Lillo, F. & Mantegna, R. (2011), ‘Statistically validated networks in bipartite complex systems’, PLoS ONE .
- Mok et al. (2007) Mok, D., Wellman, B. et al. (2007), ‘Did distance matter before the internet? interpersonal contact and support in the 1970s’, Social networks 29(3), 430–461.
- Navaretti & Venables (2004) Navaretti, G. B. & Venables, A. J. (2004), Multinational Firms in the World Economy, Princeton University Press, Princeton, N.J.
- Newman (2004) Newman, M. (2004), ‘Analysis of weighted networks’, Physical Review E 70(5), 056131.
- Pastor-Satorras & Vespignani (2004) Pastor-Satorras, R. & Vespignani, A. (2004), Evolution and structure of the Internet: A statistical physics approach, Cambridge Univ Press.
- Peneder (2007) Peneder, M. (2007), ‘A sectoral taxonomy of educational intensity’, Empirica 34(3), 189–212.
- Pilat et al. (2002) Pilat, D., Lee, F. & van Ark, B. (2002), ‘Production and use of ict: A sectoral perspective on productivity growth in the oecd area’, OECD Economic Studies 35(2), 47–78.
- Serrano & Boguná (2003) Serrano, M. & Boguná, M. (2003), ‘Topology of the world trade web’, Physical Review E 68(1), 015101.
- Serrano et al. (2007) Serrano, M., Boguñá, M. & Vespignani, A. (2007), ‘Patterns of dominant flows in the world trade web’, Journal of Economic Interaction and Coordination 2(2), 111–124.
- Shavitt & Shir (2005) Shavitt, Y. & Shir, E. (2005), ‘DIMES - Let the internet measure itself’, ACM SIGCOMM Computer Communication Review 35(5), 71–74.
- Tavazoie et al. (1999) Tavazoie, S., Hughes, J., Campbell, M., Cho, R. & Church, G. (1999), ‘Systematic determination of genetic network architecture’, Nature genetics 22, 281–285.
- van Ark et al. (2008) van Ark, B., O’Mahony, M. & Timmer, M. (2008), ‘The productivity gap between Europe and the U.S.: Trends and causes’, Journal of Economic Perspectives 22(1), 25–44.
- Wilcoxon (1945) Wilcoxon, F. (1945), ‘Individual comparisons by ranking methods’, Biometrics Bulletin 1(6), 80–83.
- WTO (1998) WTO (1998), Eletronic commerce and the role of WTO, Special Studies 2, World Trade Organization.
- Wuchty et al. (2006) Wuchty, S., Barabási, A. & Ferdig, M. (2006), ‘Stable evolutionary signal in a yeast protein interaction network’, BMC evolutionary biology 6(1), 8.
- Zhou & Mondragon (2004) Zhou, S. & Mondragon, R. J. (2004), ‘The rich-club phenomenon in the internet topology’, IEEE Communications Letters 8(3), 180–182.
Appendix A Country List
| Afghanistan | Cayman isl.** | Germany | Lebanon | Norway | Suriname* |
| Albania* | Central African Rep* | Ghana | Liberia* | Oman* | Sweden |
| Algeria** | Chile | Gibraltar* | Libya** | Pakistan | Switzerland |
| Andorra* | China | Greece | Lithuania | Palau* | Syria* |
| Angola | Cocos isl.** | Greenland** | Macau* | Panama | Taiwan |
| Anguilla* | Colombia | Grenada** | Macedonia | Papua New Guinea* | Tajikistan* |
| Antigua and Barbuda | Congo* | Guatemala | Madagascar* | Paraguay* | Tanzania |
| Argentina | Congo, Dem. Rep.** | Guinea* | Malawi* | Peru | Thailand |
| Armenia** | Costa rica** | Guyana* | Malaysia | Philippines | Togo* |
| Aruba* | Cote d’ivoire** | Haiti* | Maldives* | Poland | Tonga* |
| Australia | Croatia | Honduras | Mali* | Portugal | Trinidad and Tobago |
| Austria | Cuba* | Hong kong | Malta** | Qatar* | Tunisia** |
| Azerbaijan | Cyprus** | Hungary | Marshall isl.* | Romania | Turkey |
| Bahamas | Czech Rep. | Iceland* | Mauritania* | Russian federation | Turkmenistan* |
| Bahrain** | Denmark | India | Mauritius** | Rwanda** | Tuvalu* |
| Bangladesh** | Djibouti* | Indonesia | Mexico | St. kitts and nevis | Uganda** |
| Barbados | Dominica* | Iran | Moldova** | St. Lucia | Ukraine |
| Belarus** | Dominican Rep. | Iraq | Mongolia* | St. Pierre and Miquelon* | UAE |
| Belgium-Luxembourg | Ecuador | Ireland | Montserrat** | St. Vincent and Grenadines** | UK |
| Belize** | Egypt | Israel | Morocco | Samoa* | USA |
| Bermuda | El salvador | Italy | Mozambique | Sao Tome and Principe* | Uruguay |
| Bhutan* | Equatorial guinea** | Jamaica | Myanmar** | Saudi arabia | Uzbekistan** |
| Bolivia | Estonia | Japan | Nepal* | Senegal | Vanuatu* |
| Bosnia Herzegowina** | Ethiopia* | Jordan** | Netherlands | Seychelles** | Venezuela |
| Brazil | Falkland isl.* | Kazakhstan | Net. Antilles | Singapore | Vietnam |
| Brunei darussalam* | Fiji* | Kenya | New Caledonia* | Slovakia | Virgin isl. (British)** |
| Bulgaria | Finland | Kiribati* | New Zealand | Slovenia | Yemen* |
| Burkina faso* | France | Korea, Rep. | Nicaragua** | Solomon isl.* | Zambia* |
| Burundi* | French polynesia | Kuwait** | Niger* | South African CU | Zimbabwe** |
| Cambodia** | Gabon* | Kyrgyzstan* | Nigeria | Spain | |
| Cameroon* | Gambia* | Laos* | Norfolk isl.* | Sri lanka** | |
| Canada | Georgia** | Latvia | North. Mariana isl.** | Sudan** |