Ultra deep sub-kpc view of nearby massive compact galaxies
Abstract
Using Gemini North telescope ultra deep and high resolution (sub-kpc) K-band adaptive optics imaging of a sample of 4 nearby (z0.15) massive (1011) compact (R1.5 kpc) galaxies, we have explored the structural properties of these rare objects with an unprecedented detail. Our surface brightness profiles expand over 12 magnitudes in range allowing us to explore the presence of any faint extended envelope on these objects down to stellar mass densities 106 M☉/kpc2 at radial distances of 15 kpc. We find no evidence for any extended faint tail altering the compactness of these galaxies. Our objects are elongated, resembling visually S0 galaxies, and have a central stellar mass density well above the stellar mass densities of objects with similar stellar mass but normal size in the present universe. If these massive compact objects will eventually transform into normal size galaxies, the processes driving this size growth will have to migrate around 2-31010 stellar mass from their inner (R1.7 kpc) region towards their outskirts. Nearby massive compact galaxies share with high-z compact massive galaxies not only their stellar mass, size and velocity dispersion but also the shape of their profiles and the mean age of their stellar populations. This makes these singular galaxies unique laboratories to explore the early stages of the formation of massive galaxies.
Subject headings:
Galaxies: Evolution, Galaxies: Formation, Galaxies: Spiral, Galaxies: Structure Galaxies: Photometry1. Introduction
Following the discovery (Daddi et al. 2005; Trujillo et al. 2006) that massive spheroid-like galaxies (M⋆1011) at z1 were significantly more compact that their local equivalent counterparts, there have been some efforts exploring whether any single of these galaxies can be found in the nearby Universe (Trujillo et al. 2009; Taylor et al. 2010; Valentinuzzi et al. 2010; Shankar et al. 2010, Shih & Stockton 2011). According to some theoretical models (Hopkins et al. 2009a) it would be possible that some of the massive compact high redshift galaxies should have survived untouched since their formation epoch. Consequently, the discovery of a population of nearby old compact massive galaxies would open the possibility of exploring the galaxy formation mechanisms of the early universe in exquisite detail. So far, the amount of nearby massive galaxies with sizes (1.5 kpc) similar to the median value found at z2 (e.g. Trujillo et al. 2007; Buitrago et al. 2008) represents only a tiny fraction (0.03%) of the massive objects in the nearby universe (z0.2; Trujillo et al. 2009). Moreover, contrary to theoretical expectations, the nearby compact massive galaxies have average stellar ages which are relative young (2 Gyr), more younger than the age expected if they were relics from an early formation epoch. In this sense, present day massive compact galaxies, more than remnants from an early epoch, resemble almost perfect counterparts of the massive galaxy population found at z2: they have similar stellar masses, sizes and ages (Trujillo et al. 2009; Ferré-Mateu et al. 2012). What is currently missed though, is an in-depth analysis of the morphological properties of the nearby massive compact population.
Detailed analysis of the stellar mass density profiles of massive compact galaxies at high redshift (Bezanson et al. 2009; Hopkins et al. 2010; van Dokkum et al. 2010; Carrasco et al. 2010) show that these objects have a moderate excess of stellar mass density at their centers and a significant lack of stars in their outer regions. In fact, it is this lack of a tail in their stellar profiles what is making them to look so compact. The studies of the morphological properties of the nearby massive galaxy population have been seriously limited as the presently available imaging of these objects is based on ground based observations (with a typical seeing of 1 arcsec or equivalent to 2.6 kpc at z=0.15). This has prevented a detailed analysis of the inner region of these galaxies. Also, the outer parts of these galaxies have not been studied in detail. For that reason, a deep sub-kpc view of these galaxies would be of great help to put these galaxies into context within the local massive galaxy population. Under the assumption that these massive compact galaxies are similar objects to those found at high redshift (i.e. both in structural and stellar population properties) the unprecedented detailed analysis that can only be conducted in nearby galaxies will allow us to constrain the different evolutionary paths that transform these galaxies into the massive ”normal sized” galaxy population. In particular, with this work we would like to answer the following questions: what is the morphological nature of the massive galaxies in their primitive state: disky or spheroidal? Does the compactness nature of these objects an artifact due to the missing of light in the outer regions? In this paper, we present ultra-deep high resolution K-band imaging obtained with the Gemini North telescope of a sample of four nearby massive compact galaxies from the sample presented in Trujillo et al. (2009). We will show that the most common nature of the nearby massive compact galaxies is disky and that there is not any evidence indicating that their stellar mass density profiles have an extended outer envelope biasing their size estimates. In what follows, we adopt a cosmology of =0.3, =0.7 and H0=70 km s-1 Mpc-1.
2. The Data
The galaxies studied here are a sub-sample of the collection of nearby compact massive galaxies compiled by Trujillo et al. (2009). The original sample contains 48 bona-fide compact massive galaxies taken from the New York University Value-Added Galaxy Catalog from the SDSS Data Release 6 (Blanton et al 2005; NYU from now onwards). Our galaxies have a mean redshift of 0.16, a mean effective radius of kpc with no detected signatures of AGN in their spectra which might affect the size determination, and a mean stellar mass of M⊙ (Chabrier 2003 Initial Mass Function).
The high spatial resolution imaging presented here was obtained with the Gemini North telescope using the Near-Infrared Imager and Spectrometer (NIRI; Hodapp et al. 2003) with the ALTAIR/LGS (Laser Guide Star) adaptive optics systems (Herriot et al. 2000, Boccas et al. 2006). ALTAIR requires a relatively bright star ( 18 mag in R-band) in the proximity of the target object (within 17″) to obtain a good Strehl correction. We got time to explore four galaxies of the Trujillo’s sample that satisfy this criteria. The final galaxy sample has Adaptive Optic (AO) tip-tilt stars with magnitudes between 15.8 and 17.9 in R-band located within 16″of the main target.
The galaxies were observed during the first semester of 2010, in queue mode, using the K (2.2 m) filter and NIRI f/14 camera, which provides a field of view of 511 511 with pixel scale of 00488 on side onto a 1024 1024 ALADDIN InSb array. In addition, standard stars for photometric calibration were observed before or after our galaxies. The standard stars were used to determine the photometric zero points and monitor the image quality of the observations. Throughout the standard stars and the field stars presented in our observations we determined the effective FWHM of our observations. From standard stars, the effective FWHM varied between 011 and 013 (note that the photometric standard stars have always the maximum Strehl corrections because they are used as AO tip/tilt star). From field stars, the effective FWHM was between 016 and 024 varying with the stellar magnitude, and the location of the star relative to the galaxy of interest. The galaxy SDSS-J153934.07441752.2 was observed in separate nights (see Table 1), but at similar airmass. For galaxy J120032.46+032554.1 only 27 images of 60 sec were observed (half of the planned observations). Despite this reduction, the combined image for this galaxy is still very deep allowing us to reach faint surface brightness.
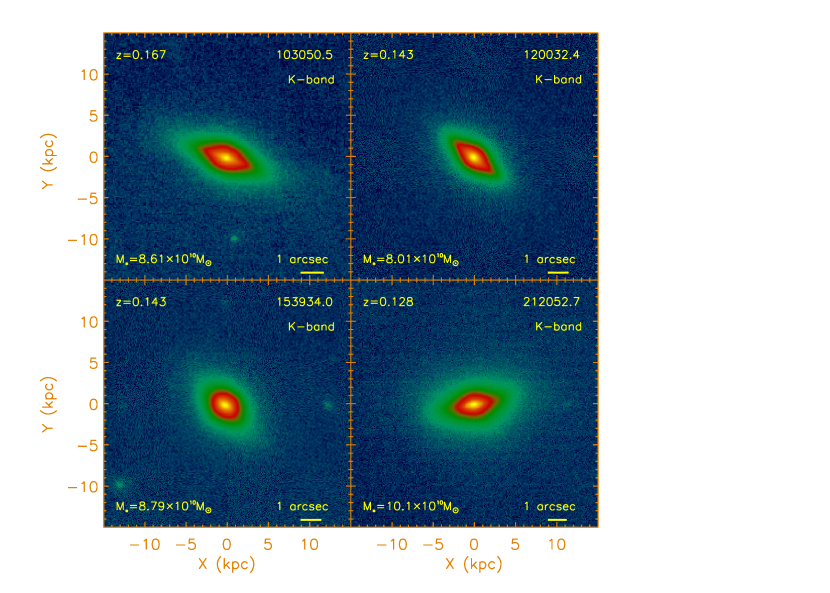
The data were processed following the standard procedures for near-infrared imaging using the NIRI/Gemini IRAF package v1.10. Normalized flat field images were constructed from flat images observed with the Gemini Calibration unit (GCAL) with the shutter closed (lamps off) and shutter open (lamps on). Dark images observed at the end of each night and flat field images (lamp off) were used to construct a bad pixel mask with bad and hot pixels. The sky images were constructed from the raw science images by identifying objects in each frame, masking them out, and averaging the remaining good pixel (the images were observed with a 3″ 3″ mosaic pattern). The raw science images were then processed by subtracting the sky on a frame-by-frame basis and divided by the normalized flat field images. Finally, the processed images were registered to a common pixel position and median combined. The final images have a field of view of 395 395. The images of our four galaxies are shown in Figure 1.
Photometric calibrations were derived using the UKIRT Mauna Kea Observatories JHKL’M Standard Stars FS 132 (s860-d), FS 152 (p460-e) and P272-D (Leggett et al. 2006) and the P064-D faint standard star (Persson et al 1998). Given that only one standard star was observed for each galaxy (before or after), we have used an average value for the extinction of from Leggett et al. (2006). Table 1 lists all observational parameters for our NIRI observations. Since we use an average value for the extinction coefficient, the estimated error in the photometric calibration will be driven by the uncertainty in the correct value of the extinction coefficient for the night of observation. Hence, we estimated the error by summing in quadrature the median error of the aperture photometry, the error of the standard catalog and the median error of the extinction coefficient. The error varied between 0.03 mag and 0.05 mag, depending on the star. For each galaxy, the adopted zero point is listed in the column (7) of Table 1. The values were transformed from the Vega system to the AB system using the relation mag.
3. Analysis
A visual inspection of the nearby compact massive galaxies shown in Fig. 1 indicates that the most common morphology of our objects is disky. In fact, two objects (SDSS J103050.53625859.8 and SDSS J120032.46032554.1) visually resemble S0 galaxies viewed in edge-on projection. The other two galaxies (SDSS J153934.07441752.2 and SDSS J212052.74110713.1) have a more distorted morphology but still are compatible with being S0 galaxies with a lower inclination (see also Valentinuzzi et al. 2010). On what follows, we make a quantitative analysis of the structural properties of the nearby compact massive galaxies.
3.1. K-band surface brightness profiles
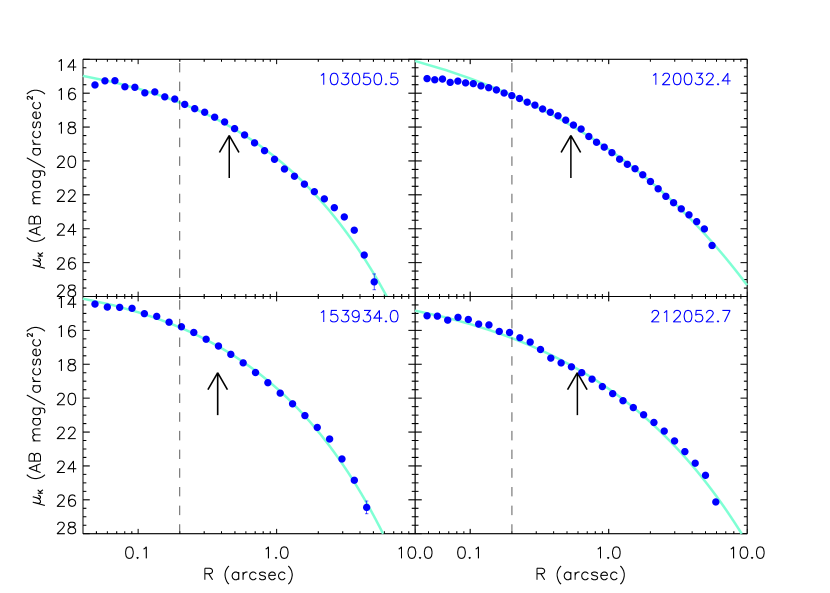
In Fig. 2 we show circular aperture K-band surface brightness profiles of our compact galaxies. Although our galaxies have a clear elongation, circular apertures are used to allow a direct comparison with the circular averaged profiles of ”normal-sized” galaxies as we will show later. To create our profiles we followed the same technique explained in Pohlen & Trujillo (2006). Briefly, we obtain first the surface brightness profile of the galaxy up to large distances. Then we estimate the sky contribution in those regions outside the galaxy where the profile is flat and we remove (add) this value from (to) the images. After doing that, we calculate again the surface brightness profiles of these galaxies.
For most of our galaxies we can explore their surface brightness profiles down to 27 mag/arcsec2. This implies probing around 12 magnitudes from the peak of their surface brightness distribution down to their last observed points. This extraordinary depth allow us to investigate whether there is any evidence for any extra hide (halo-like) component in our galaxies which due to its faintness could not have been observed in previous shallower images of these objects. We can consequently address whether earlier works have incorrectly measured the sizes of these objects towards lower values.
We have fitted our profiles with a single Sérsic (1968) model to compare the sizes we get from our images in relation to those obtained in previous shallower and worst resolution SDSS data (Trujillo et al. 2009). We avoided in this fitting those regions of the galaxies more severely affected by the PSF (Point Spread Function). This means we only take those points beyond the FHWM of our PSF (this distance is indicated by a vertical dashed line in Fig. 2). The effective radii and Sérsic indeces we got are shown in Table 2. We explored whether our results were affected by this particular radial range of exploration. To do that we repeat our fitting only taking the points outside 2 times the FWHM. Our estimates remained very well constrained with changes in the effective radius below 15% and for the Sérsic index less than 11%. This robustness is due to the extreme depth of our images.
We can now compare these values against the sizes obtained using SDSS imaging. In Trujillo et al. (2009) we got the following results: 1.42 kpc (103050.5), 1.31 kpc (120032.4), 1.11 kpc (153934.0) and 1.38 kpc (212052.7). We can see that the agreement with the present much deeper and higher resolution data is excellent with differences less than 7%. This is an indirect proof that there is not any hidden component in these massive nearby compact galaxies that could alter the size of the objects. The main novelty that the present deep data allow us to explore is the shape of these galaxies. We observe that these objects are well fitted with moderately low Sérsic indeces (2n4) values. The absence of large Sérsic indeces is again against the idea that there is a missing faint component surrounding these objects.
3.2. Stellar mass density profiles
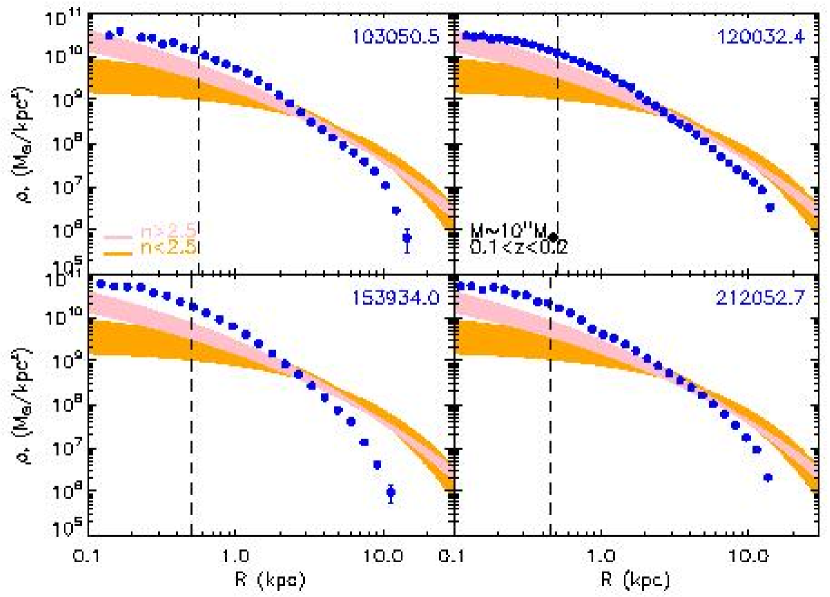
In order to understand the building of the massive galaxies it is worth comparing the stellar mass density profiles of the compact population against the mass distribution of galaxies of a similar mass but with normal sizes. We have transformed our observed K-band surface brightness profiles into stellar mass density profiles using the total stellar masses measured in Blanton et al. (2005) listed in Table 2. We have assumed that the stellar mass to light ratio is constant along the radial distance of the galaxy. The outcome of this exercise is presented in Fig. 3.
To build the stellar mass density profiles of the ”normal-sized” galaxies used as a reference, we took the structural parameters (Sérsic index n, effective radius re and stellar mass M⋆) of all the galaxies in the NYU catalogue (Blanton et al. 2005) with 0.8M⋆1.21011M☉ and 0.1z0.2. These NYU structural parameters were retrieved from profiles obtained using circular apertures. To facilitate the comparison with our profiles, we divided the NYU galaxies into two different categories: disk-like (n2.5) and spheroid-like (n2.5). We find that the average disk-like massive galaxy within the NYU sample at those redshifts has M⋆=0.951011M☉, n=2 and re=5.7 kpc. On the other hand, the average spheroid-like object has M⋆=0.98 1011M☉, n=4 and re=4.7 kpc.
Once we obtained these average galaxy profiles, the representative regions of each galaxy category were build using all the galaxies in the NYU sample within the above stellar mass range and redshift interval whose central stellar mass densities were within the 68% of the distribution centered around the mean value.
From the comparison of the stellar mass density profiles of the compact galaxies with those of ”normal-sized” objects (Fig. 3) is straightforward to conclude that the compact galaxies do not resemble neither of the two categories. Although visually the elongation of the compact galaxies would suggest that these objects are more likely disks, the shape of these profiles are closer to those considered as spheroids in the local universe. It is easy to see that there is an excess of mass at the center of the compact galaxies and a lack of stars (starting mainly around 3 kpc) in the outer regions. The deep profiles that we present here undoubtedly show that nearby massive compact galaxies do not have an extended outer component and, consequently, are genuinely compact.
An interesting exercise that can be conducted is to estimate the amount of stellar mass within the inner (R3 kpc) region of the compact galaxies and compare this to the ”normal-sized” objects. In the case of the compact galaxies we find that the stellar mass fraction inside 3 kpc ranges from 0.72 (in the case of 212052.7) up to 0.89 (for 153934.0). In the case of ”normal-sized” objects these fractions are significantly lower: 0.27 for disk-like objects and 0.38 in the case of spheroids. This implies that there is 2 times more stellar mass inside 3 kpc in the case of the compact massive galaxies than in objects of the same stellar mass but normal size. This difference in stellar mass implies that one would expect a much larger central velocity dispersion in the case of compact galaxies compared to normal galaxies with equivalent stellar mass. A crude estimation (following the virial theorem expectation) suggests that this increase should be of the order of as there is a factor of 2 more stellar mass in the central regions. Are these expectations in agreement with observations? In Trujillo et al. (2009) we found that the average central velocity dispersion of 1011M☉ galaxies according to SDSS was 180 km/s. Our massive compact galaxies have (see Table 2) an average =243 km/s. This is 1.35 larger than the value found in normal galaxies of the same stellar mass and fits very well with the virial expectation. This is another indirect proof of the larger stellar mass densities that massive compact galaxies have in their centers.
4. Discussion
4.1. Can massive compact galaxies be transformed into the core of giant ellipticals?
A popular idea is that massive compact galaxies at high-z will end being the central part of present day most massive objects (Bezanson et al. 2009; Hopkins et al. 2009b). This scenario is supported by many indirect observational evidences as the progressive growth of the wings of the profiles of the massive galaxies with time (van Dokkum et al. 2010), the larger velocity dispersion of the massive galaxies at high-z (1.5 times larger) compared to equally massive objects today (e.g. Cenarro & Trujillo 2009, Cappellari et al. 2009, Onodera et al. 2010, Newman et al. 2010, van de Sande et al. 2011), the similar number density (210-4 Mpc-3) between 1011M☉ massive compact galaxies at high-z and today 2 times more massive objects (van Dokkum et al. 2010, Cassata et al. 2011, Buitrago et al. 2012), the expected mass growth by a factor of 2 of the massive galaxies with time expected theoretically (Naab et al. 2009, Sommer-Larsen & Toft 2010, Feldmann et al. 2010, Oser et al. 2012) and suggested by the observations (see e.g. Trujillo et al. 2011). In this sense, it is natural to compare our stellar mass density profiles with the profiles of normal-sized objects in the local universe but with a stellar mass twice the ones found for the local massive compact galaxies. The unprecedented resolution of our profiles allow us to see whether there is any change at sub-kpc level in the structure of these objects. In particular, we are interested on estimating how the growing processes that could eventually bring the compact galaxies into the core of more massive objects affect their inner regions. Moreover, we would like to quantify which number of stars should migrate during such transformation towards the outskirts of these objects.
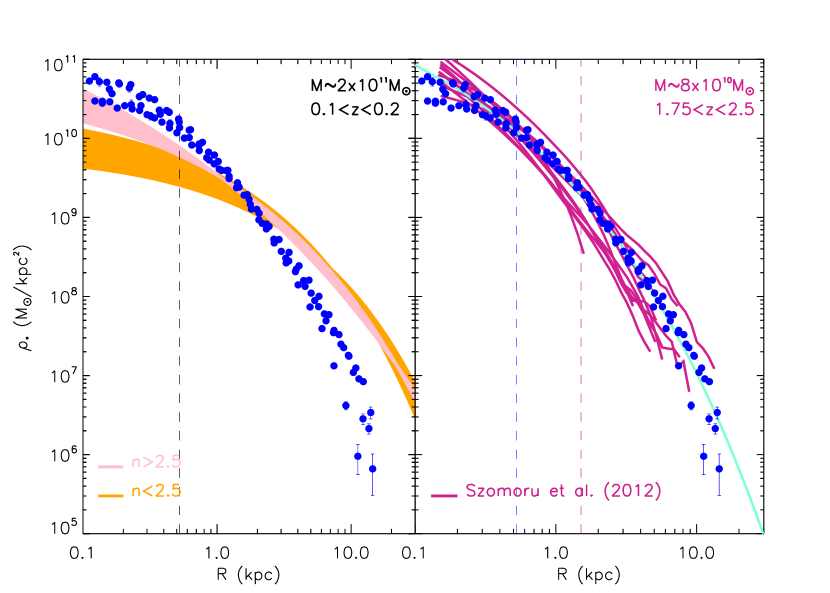
In Fig. 4 (left panel) we show the comparison between the stellar mass density profiles of our nearby compact massive galaxies against objects with normal sizes but 2 times more massive. The nearby massive compact galaxies are clearly more dense at the center than the objects they will potentially be transformed in the future. That implies that the transformation from one class to another should imply a significant migration of the stars from the center of the compact galaxies towards their outer regions. The stellar mass density of both normal-sized and compact galaxies are similar at R=1.7 kpc. We can consequently estimate which is the excess of stellar mass of the compact galaxies compared to the other objects within this radius. We find that compact galaxies have 31010M☉ more mass than a disk-like normal size galaxy and 21010M☉ more mass than a spheroid object within 1.7 kpc. That means such amount of stellar mass should be relocated outwards of 1.7 kpc after the evolution of the compact galaxy into a larger size object. This enormous evolution of the inner region of the compact galaxies is expected in a minor merging scenario (see e.g. Fig. 3 of Oser et al. 2012). Both compact massive galaxies and the larger objects have the same amount of stellar mass (81010M☉) within 5 kpc. This suggests that the processes responsible of the growth of the galaxies locate most of the new assembled stars (1011M☉) beyond that radius.
At present it is still unclear which exact mechanism is ultimately responsible of the growth of the massive compact galaxies. The most favoured scenario is the minor dry merging scenario (e.g. Khochfar & Burkert 2006; Maller et al. 2006; Hopkins et al. 2009a; Naab et al. 2009; but see Nipoti et al. 2012 for a critical vision) but there has been also some support to the puffing-up model. In this last picture (Fan et al. 2008; 2010), galaxy growth is connected to the removal of gas as a result of AGN activity or stellar activity (Damjanov et al. 2009). Based on recent simulations (Ragone-Figueroa & Granato 2011) the growth associated to this process should be very fast (20-30 Myr). This would imply that objects with stellar populations older than 1 Gyr should already have normal sizes. In which scheme better fit the properties of our nearby massive compact galaxies?
Our nearby massive compact galaxies are young but they stellar populations are older than 1 Gyr. This seems hard to reconcile with the puffing up model. On the other hand, some of our objects seem to be accreting minor satellites as they have distorted morphologies. Not having spectroscopic redshifts for the rest of the galaxies in our fields, we are unable to quantify the presence of satellites around our galaxies (see e.g. Newman et al. 2012; Mármol-Queraltó et al. 2012). So far, the data obtained for the nearby compact galaxies seem to support more the minor merging scenario than the puffing up model.
4.2. Distant and nearby massive compact galaxies
An interesting aspect that we can address with our data is whether our stellar mass density profiles resemble those of equally massive compact galaxies at z2. Contrary to what we find in the local universe, compact massive galaxies were very common at those redshifts. Consequently, if we prove that our nearby massive compact objects are similar in structure to their high-z counterparts, this would favor the idea that these objects share a similar formation origin. So far, not only the size, stellar mass and velocity dispersion of the nearby compact galaxies are the same than their equivalent high-z objects but there is some evidence implying that the compact nearby galaxies are young too (with a mean stellar age of 1-2 Gyr; Trujillo et al. 2009, Ferré-Mateu et al. 2012). This age is equivalent to the age of the compact objects found at high-z (e.g. Kriek et al. 2009). The question that we address in this paper is whether the distribution of the stars in the nearby compact massive galaxies also follow a similar shape to the ones found at high-z. This is shown in Fig. 4 (right panel).
The objects that we have used to compare with our compact galaxies are the massive compact galaxies from the sample of Szomoru et al. (2012) at z2. This is a collection of 12 galaxies observed with the HST WFC3 as part of the CANDELS (Grogin et al. 2011; Koekemoer et al. 2011) GOODS-South. The high-z objects have a median stellar mass of 8.31010M☉ (Kroupa IMF) and a median size of 0.84 kpc. The high-z profiles presented in Szomoru et al. (2012) are deconvolved so we can have a better idea of how the profiles at high-z look in their inner (R1 kpc) regions. We can see that the agreement between the nearby and high-z compact galaxies is excellent.
It is evident from the images shown in Fig. 1 that our galaxies are elongated. We have measured their axis ratio using the ELLIPSE from IRAF. The axis ratio measured in the outer regions is shown in Table 2. Is there any evidence about a similar elongated shape for the compact massive galaxies at high-z? van der Wel et al. (2011) and Buitrago et al. (2012) have addressed this issue and find that this is the case. Most of high-z massive galaxies at high-z have elongated shapes too. Summarizing, nearby massive compact galaxies are almost exact copies of the high-z massive compact galaxies suggesting that their detailed study can shed light on the formation of the first massive galaxies assembled in the Universe.
5. Conclusions
Using ultra-deep imaging at a sub-kpc resolution of a sample of 4 nearby massive compact galaxies, we have shown unequivocally that these objects are genuinely compact with no evidence of an extended faint component altering their size estimate. These nearby massive compact galaxies have an elongated shape resembling the structure of S0 objects. Their stellar mass density profiles are significantly more dense in their inner regions than any galaxy with similar stellar mass and normal size in the local universe.
Nearby massive compact galaxies share a large number of properties with massive compact galaxies in the distant universe: same stellar mass, size, shape, velocity dispersion and the mean age of their stellar populations. Contrary to high-z compact massive galaxies which were very common among the family of massive galaxies at z2, nearby massive compact galaxies are a tiny fraction of the family of massive galaxies today. It still unclear whether the nearby compact massive galaxies are relics of that epoch (which have had a recent burst of star formation that has rejuvenated their ages) or whether they are truly young galaxies recently assembled. Undoubtedly, the study of these rare nearby objects open the possibility of exploring in exquisite detail the early stages of massive galaxy formation.
References
- Bezanson et al. (2009) Bezanson, R., van Dokkum, P. G., Tal, T., Marchesini, D., Kriek, M., Franx, M.& Coppi, P., 2009,ApJ, 697, 1290
- Blanton et al. (2005) Blanton, M. R., et al. 2005, AJ, 129, 2562
- Boccas et al. (2006) Boccas, M., et al., 2006, SPIE, 6272, 114
- Buitrago et al. (2008) Buitrago, F., Trujillo, I., Conselice, C. J., Bouwens, R. J., Dickinson, M., & Yan, H. 2008, ApJ, 687, L61 (B08)
- Buitrago et al. (2012) Buitrago, F., Trujillo, I., Conselice, C. J., Haeussler, B., 2012, arXiv:1111.6993
- Cappellari et al. (2009) Cappellari, M., et al., 2009, ApJ, 704, L34
- Carrasco et al. (2010) Carrasco, E. R., Conselice, C, J., Trujillo, I., 2010, MNRAS, 405, 2253
- Cassata et al. (2011) Cassata, P. et al., 2011, ApJ, 743, 96
- Chabrier (2003) Chabrier, G. 2003, PASP, 115, 763
- Cenarro (2009) Cenarro, A. J., Trujillo, I., 2009, ApJ, 696, 43
- Daddi et al. (2005) Daddi, E., et al. 2005, ApJ, 626, 680
- Damjanov et al. (2009) Damjanov, I., et al. 2009, ApJ, 695, 101
- Fan et al. (2008) Fan, L., Lapi, A., De Zotti, G., & Danese, L. 2008, ApJ, 689, L101
- Fan et al. (2010) Fan, L., Lapi, A., Bressan, A., Bernardi, M., De Zotti, G., Danese, L. 2010, ApJ, 718, 1460
- Feldmann et al. (2010) Feldmann, R., Carollo, C. M., Mayer, L., Renzini, A., Lake, G., Quinn, T., Stinson, G. S., Yepes, G., 2010, ApJ, 709, 218
- Ferre-Mateu et al. (2012) Ferré-Mateu, A., et al., 2012, MNRAS, in press, arXiv:1203.2623
- Grogin et al. (2011) Grogin, N. A. et al. 2011, ApJS, 197, 35
- Heap & Lindler (2007) Heap, S. R., & Lindler, D. J. 2007, From Stars to Galaxies: Building the Pieces to Build Up the Universe, 374, 409
- Herriot et al. (2000) Herriot, G., et al., 2000, SPIE, 4007, 115
- Hodapp et al. (2003) Hodapp, K.W. et al., 2003, PASP, 115, 1388
- Hopkins et al. (2009) Hopkins, P. F., Hernquist, L., Cox, T. J., Keres, D., & Wuyts, S. 2009a, ApJ, 691, 1424
- Hopkins et al. (2009) Hopkins, P. F., Bundy, K., Murray, N., Quataert, E., Lauer, T. R., Ma, C.-P., 2009b, 398, 898
- Hopkins et al. (2010) Hopkins, P. F., Bundy, K., Hernquist, L., Wuyts, S., Cox, T. J., 2010, MNRAS, 401, 1099
- Khochfar & Burkert (2006) Khochfar, S., Burkert, A., 2006, A& A, 445, 403
- Koekemoer et al. (2011) Koekemoer, A. M. et al. 2011, ApJS, 197, 36
- Kriek et al. (2009) Kriek, M., van Dokkum, P. G., Labb , I., Franx, M. Illingworth, G. D., Marchesini, D., Quadri, R. F., 2009, ApJ, 700, 221
- Leggett et al. (2006) Leggett, S. K., et al., 2006, MNRAS, 373, 781
- Maller et al. (2006) Maller, A. H., et al. 2006, ApJ, 647, 763
- Marmol-Queralto et al. (2012) Mármol-Queraltó, E., Trujillo, I., Pérez-González, P. G., Varela, J., Barro, G., 2012,MNRAS, in press, arXiv:1201.2414
- Naab et al. (2009) Naab, T., Johansson, P. H.. Ostriker, J. P., 2009, ApJ, 699, L178
- Newman et al. (2010) Newman, A. B.; Ellis, R. S., Treu, T., Bundy, K., 2010, ApJ, 717, L103
- Newman et al. (2012) Newman, A. B.; Ellis, R. S.; Bundy, K., Treu, T., 2012, ApJ, 746, 162
- Nipoti et al. (2012) Nipoti, C., Treu, T., Leauthaud, A., Bundy, K., Newman, A. B., Auger, M. W., 2012, MNRAS, in press, arXiv: 1202.0971
- Onodera et al. (2010) Onodera, M., et al. 2010, ApJ, 715, L60
- Oser et al. (2012) Oser, L., Naab, T., Ostriker, J. P., Johansson, P. H., 2012, ApJ, 744, 630
- Persson et al. (1998) Persson, S. E., Murphy, D. C., Krzeminski, W., Roth, M., & Rieke, M. J., 1998, AJ, 116, 2475
- Pohlen & Trujillo (2006) Pohlen, M., & Trujillo, I., 2006, A&A, 454, 759
- Ragone-Figueroa & Granato (2011) Ragone-Figueroa, C., Granato, G. L., 2011, MNRAS, 414, 3690
- Sersic (1968) Sersic, J. L. 1968, Cordoba, Argentina: Observatorio Astronomico, 1968, Atlas de Galaxias Australes
- Shankar et al. (2010) Shankar, F., Marulli, F., Bernardi, M., Boylan-Kolchin, M., Dai, X., Khochfar, S., 2010, MNRAS, 405, 948
- Shih et al. (2011) Shih, H.-Y. & Stockton, A., ApJ, 733, 45
- Sommer-Larsen (2010) Sommer-Larsen, J. & Toft, S., 2010, ApJ, 721, 1755
- Szomoru et al. (2012) Szomoru, D., Franx, M., van Dokkum, P. G., 2012, ApJ, 749, 121
- Taylor et al. (2010) Taylor, E., Franx, M., Glazebrook, K., Brinchmann, J.; van der Wel, A. & van Dokkum, P. G., ApJ, 720, 723
- Trujillo et al. (2006) Trujillo, I., et al. 2006, MNRAS, 373, L36
- Trujillo et al. (2007) Trujillo, I., Conselice, C. J., Bundy, K., Cooper, M. C., Eisenhardt, P., & Ellis, R. S. 2007, MNRAS, 382, 109
- Trujillo et al. (2009) Trujillo, I., Cenarro, A. J., de Lorenzo-Caceres, A., Vazdekis, A., de la Rosa, I. G., & Cava, A. 2009, ApJ, 692, L118
- Trujillo et al. (2011) Trujillo, I., Ferreras, I., de La Rosa, I. G., 2011, MNRAS, 415, 3903
- Valentinuzzi et al. (2010) Valentinuzzi, T., et al., 2010, ApJ, 712, 226
- van de Sande et al. (2011) van de Sande, J., et al., 2011, ApJ, 736, L9
- van der Wel et al. (2011) van der Wel, A. et al., 2011, ApJ, 730, 38
- van Dokkum et al. (2010) van Dokkum, P. G., et al. 2010, ApJ, 709, 1018
| Name | R.A. | Dec | Observing date | Total Exposure time | Airmass | Zero Point | K mag |
|---|---|---|---|---|---|---|---|
| (J2000) | (J2000) | (UT) | (sec) | (AB mag) | (AB mag) | ||
| (1) | (2) | (3) | (4) | (5) | (6) | (7) | (8) |
| SDSS J103050.53625859.8 | 10 30 50.53 | 62 58 59.8 | 2010-02-28 | 3540 | 1.406 | 24.86 | 16.63 |
| SDSS J120032.46032554.1 | 12 00 32.46 | 03 25 54.1 | 2010-06-05 | 1620 | 1.106 | 24.85 | 16.06 |
| SDSS J153934.07441752.2 | 15 39 34.07 | 44 17 52.2 | 2010-05-04 | 3660 | 1.281aaAverage airmass from two nights | 24.91bbAverage Zero Point for two nights: Night 1: 24.90 mag, Night 2: 24.91 mag | 16.04 |
| 2010-06-04 | |||||||
| SDSS J212052.74110713.1 | 21 20 52.74 | 11 07 13.1 | 2010-05-22 | 3780 | 1.230 | 24.90 | 16.24 |
Note. — Table description - column (1): galaxy name; column (2) and (3): Right Ascension (hours, minutes and seconds) and Declination (degrees, minutes and seconds); column (4): Date of observation in UT; column (5): the exposure time; column (6): effective airmass; column (7): Derived zero point in the AB system; column (8): K-band galaxy magnitude
| Name | M⋆ | Re | Sérsic index | b/a | Re | Redshift | |
|---|---|---|---|---|---|---|---|
| (1010M☉) | (arcsec) | (kpc) | (km/s) | ||||
| SDSS J103050.53+625859.8 | 8.61 | 0.450.07 | 2.200.24 | 0.36 | 1.230.18 | 0.167 | 19616 |
| SDSS J120032.46+032554.1 | 8.01 | 0.530.08 | 3.550.39 | 0.32 | 1.330.20 | 0.143 | 26623 |
| SDSS J153934.07+441752.2 | 8.79 | 0.380.06 | 2.180.24 | 0.47 | 0.950.14 | 0.143 | 28540 |
| SDSS J212052.74+110713.1 | 10.10 | 0.590.09 | 2.660.29 | 0.28 | 1.350.20 | 0.128 | 22312 |