Extending the – diagram with dense nuclear star clusters
Abstract
Four new nuclear star cluster masses, , plus seven upper limits, are provided for galaxies with previously determined black hole masses, . Together with a sample of 64 galaxies with direct measurements, 13 of which additionally now have measurements rather than only upper limits, plus an additional 29 dwarf galaxies with available measurements and velocity dispersions , an ()– diagram is constructed. Given that major dry galaxy merger events preserve the ratio, and given that for luminous galaxies, it is first noted that the observation is consistent with expectations. For the fainter elliptical galaxies it is known that , and assuming a constant ratio (Ferrarese et al.), the expectation that is in broad agreement with our new observational result that . This exponent is however in contrast to the value of 4 which has been reported previously and interpreted in terms of a regulating feedback mechanism from stellar winds.
Finally, it is predicted that host galaxies fainter than mag (i.e. those not formed in dry merger events) which follow the relation , and are thus not ‘pseudobulges’, should not have a constant ratio but instead have . It is argued that the previous near linear – and – relations have been biased by the sample selection of luminous galaxies, and as such should not be used to constrain the co-evolution of supermassive black holes in galaxies other than those luminous few built by major dry merger events.
keywords:
galaxies: nuclei — galaxies: star clusters — galaxies: dwarf — galaxies: kinematics and dynamics — galaxies: structure — galaxies: fundamental parameters1 Introduction
Supermassive black holes have long been known to exist at the centers of large galaxies (e.g. Lynden-Bell 1969; Wolfe & Burbidge 1970; Sargent et al. 1978). Intriguingly, scaling relations between their masses and several global properties of the host spheroid (e.g. Kormendy & Richstone 1995; Magorrian et al. 1998; Ferrarese & Merritt 2000; Gebhardt et al. 2000; Graham et al. 2001; Marconi & Hunt 2003) may be the result of feedback mechanisms in which the central black hole regulates the growth of the surrounding bulge, rather than vice-versa (e.g. Silk & Rees 1998; Haehnelt, Natarajan & Rees 1998; de Lucia et al. 2006; Antonuccio-Delogu & Silk 2010).
In early-type dwarf galaxies and the bulges of late-type galaxies, dense nuclear star clusters appear to dominate at the expense of massive black holes (Valluri et al. 2005; Ferrarese et al. 2006a; Wehner & Harris 2006). The existence of scaling relations between the luminosity and stellar mass of these star clusters and their host spheroid (e.g. Graham & Guzmán 2003; Balcells et al. 2003, 2007; Grant et al. 2005) similarly suggests that a physical mechanism may be controlling their growth, possibly based on some regulating feedback process (e.g. King 2005; McLaughlin et al. 2006; Hueyotl-Zahuantitla et al. 2010). Or perhaps instead some other activity prevails, such as cluster inspiral (e.g. Tremaine, Ostriker & Spitzer 1975; Bekki 2010, Agarwal & Milosavljević 2011), possibly coupled with gas dissipation and new star formation (Hartmann et al. 2011).
Coupled with the above observational relations is the observation that many nuclear star clusters in intermediate-mass spheroids (of stellar mass ) harbour massive black holes themselves (e.g. Graham & Driver 2007; González Delgado et al. 2008; Seth et al. 2008, 2010; Gallo et al. 2010; Neumayer & Walcher 2012). An attempt to quantify the coexistence of these two types of galactic nuclei was provided by Graham & Spitler (2009) who revealed how their (i) mass ratio and (ii) combined mass relative to their host spheroid’s stellar mass, changed as a function of host spheroid stellar mass. Such dual nuclei are exciting for a number of reasons, including UV/X-ray flaring events as infalling stars are tidally disrupted by the black hole (e.g. Komossa & Merritt 2008; Lodato et al. 2008; Rosswog et al. 2008; Maksym, Ulmer & Eracleous 2010) and the increased expectation for the discovery of gravitational radiation as stellar mass black holes and neutron stars inspiral toward the central supermassive black hole of these dense, compact star clusters (Mapelli et al. 2011).
If nucleated galaxies, i.e. those with nuclear star clusters, were participants in an hierarchical universe (White & Frenk 1991), then their dense nuclei must have eventually been replaced by massive black holes as they, the host galaxies, grew into massive elliptical galaxies. Bekki & Graham (2010) have argued that the gravitational scouring which ensues from a coalescing binary supermassive black hole after a galaxy merger event (Begelman, Blandford & Rees 1980; Ebisuzaki, Makino & Okumura 1991; Graham 2004; Merritt, Mikkola & Szell 2007), must first be preceded by the destruction of these nuclear star clusters. They have revealed that binary supermassive black holes can effectively ‘heat’ the newly-merged star clusters, causing them to eventually evaporate into the host spheroid. Such a scenario suggests a connection-of-sorts between nuclear star clusters and massive black holes in intermediate mass spheroids. Other, perhaps yet unthought of, processes may also be operating. This Letter explores potential connections by expanding upon the association between black hole mass and host galaxy velocity dispersion, the – diagram (Ferrarese & Merritt 2000; Gebhardt et al. 2000; Graham et al. 2011), by including nuclear star clusters.
In section 2 we provide some insight into the expected relations in the ()– diagram via reference to the galaxy luminosity-(velocity dispersion) relation for dwarf and ordinary elliptical galaxies (Davies et al. 1983) and the galaxy-(nuclear star cluster) luminosity relation for spheroids (Graham & Guzmán 2003; Balcells et al. 2007). We also build on the ()– diagram from Graham et al. (2011) by identifying and including new galaxies that host both a nuclear star cluster and a supermassive black hole (Section 3). We additionally include those galaxies from Ferrarese et al. (2006a) with nuclear star cluster masses that populate the low-mass end of the diagram. In Section 4 we present our findings, notably that the expected relation appears consistent with the data. This exponent of 2 is dramatically different to the value of advocated previously (Ferrarese et al. 2006a), and suggests that theories developed to match the previous relation may need reconsideration. Section 4.1 goes on to present an exciting and significantly new prediction for the – and –luminosity relations for spheroids fainter than mag, i.e. those thought to have not formed from major, dissipationless, galaxy merger events (e.g. Davies et al. 1983; Faber et al. 1997).
2 Expectations
From pre-existing scaling relations it is possible to predict the slope of the relation between nuclear cluster mass and host spheroid velocity dispersion: the – relation. It is also possible to predict a slope for the – relation at the high-mass end where nuclear clusters do not exist and dry galaxy merging is thought to occur.
The luminosity of dwarf elliptical galaxies (or more broadly elliptical galaxies without depleted cores) is such that (Davies et al. 1983; Held et al. 1992), while for big elliptical galaxies (with km s-1) the exponent is known to have a value of 5 (Schechter 1980; Malumuth & Kirshner 1981). When including samples of intermediate-mass elliptical galaxies (with 170-200 km s-1) with the big elliptical galaxies, the average exponent has the more commonly known value of 3 to 4 (Faber & Jackson 1976; Tonry 1981). Following Davies et al.’s (1983) identification of the transition in the – relation at B-mag ( km s-1), where they noted that a number of other physical properties changed behavior, Matković & Guzmán (2005, see also de Rijcke et al. 2005) connected this transition with the onset of dry galaxy merging in the brighter galaxies.
Provided there are no significant gravitational ejections of supermassive black holes from massive galaxies (e.g. Gualandris & Merritt 2008), then at the high-mass end where dry galaxy merging is thought to occur — involving galaxies with equal ratios (Häring & Rix 2004) — the combined supermassive black hole mass and the merged host galaxy luminosity and mass, must increase in lock step. That is, the slope of the – relation must be equal to 1, as is observed for samples dominated by luminous galaxies (Marconi & Hunt 2003; Graham 2007). Consequently, the slope of the – relation for galaxies built by such dry merging (with B-mag and 200 km s-1) will therefore equal the slope of the – relation over this same mass range. Given that , one has (the prediction) that , which is what is observed for massive “core” galaxies (Hu 2008; Graham et al. 2011; see also Ferrarese & Merritt 2000 and Merritt & Ferrarese 2001).
At the low-mass end, Graham & Guzmán (2003) have revealed that the nuclear cluster luminosity, and in turn stellar mass, , in dwarf elliptical galaxies scales with the galaxy luminosity such that . Given that in dwarf elliptical galaxies, one has that , or, roughly that .
Another way to predict the outcome is to note that if the ratio of to host spheroid luminosity is constant (Ferrarese et al. 2006a), then the bent – relation (Davies et al. 1983) maps directly into a bent ()- relation, with slopes of 2 and 5 at the low- and high-mass end respectively. We note that this bent – relation has been predicted before (e.g. Graham & Driver 2007, their section 3.2; Graham 2008b, their section 2.2.2) but curiously is at odds with Ferrarese et al. (2006a) who reported a slope of 4 for the – relation.
3 Data
| Galaxy | Type | Dist. | Magnc | ||
| Mpc | mag | ||||
| NGC 1300 | SBbc | 20.7 | … | 8.7A | |
| NGC 2549 | SB0 | 12.3 | B | 1.1 | |
| NGC 3585 | S0 | 19.5 | C | 0.4 | |
| NGC 4026 | S0 | 13.2 | C | 1.3 | |
| Upper limits on nuclear star cluster mass | |||||
| NGC 1316 | SB0 | 18.6 | D | ||
| NGC 2787 | SB0 | 7.3 | E | ||
| NGC 3227 | SB | 20.3 | |||
| NGC 3245 | S0 | 20.3 | E | ||
| NGC 3489 | SB0 | 11.7 | G | ||
| NGC 4459 | S0 | 15.7 | E | ||
| NGC 4596 | SB0 | 17.0 | E | ||
| Unknown nuclear star cluster mass | |||||
| Circinus | Sb | 2.8 | unknown, dusty Sy2 nucleusH | ||
| IC 2560 | SBb | 40.7 | unknown, dusty Sy2 nucleusI | ||
| NGC 224 | Sb | 0.74 | two nuclear discsJ | ||
| NGC 1068 | Sb | 15.2 | unknown, Sy2 nucleusK | ||
| NGC 3079 | SBcd | 20.7 | unknown, dusty Sy2 nucleusL | ||
| NGC 3393 | SBab | 55.2 | unknown, dusty Sy2 nucleusM | ||
| NGC 3998 | S0 | 13.7 | unknown, AGN dominatesE | ||
| NGC 4258 | SBbc | 7.2 | unknown, Sy2 AGN dominatesN | ||
| NGC 4261 | E2 | 30.8 | unknown, Sy3 AGN dominatesE | ||
| NGC 4486a | E2 | 17.0 | nuclear stellar discO | ||
| NGC 4945 | SBcd | 3.8 | Sy2 dusty nuclear starburstP | ||
| NGC 5128 | S0 | 3.8 | unknown, Sy2 AGN dominatesQ | ||
| NGC 7582 | SBab | 22.0 | unknown, Sy AGN dominatesR | ||
References: A Atkinson et al. (2005, their Table 2, integrating their inner component to 10); B From our NCSérsicexponential analysis of the light profile in Rest et al. (2001), using ; C From our NCSérsicexponential analysis of the light-profile in Lauer et al. (2005), using ; D Lauer et al. (2005), NGC 1316 = Fornax A, AGN contamination, used here; E Gonzalez-Delgado et al. (2008), used here, nuclear cluster masses are upper limits due to AGN contamination; F Carollo et al. (2002), may have starburst plus Sy1.5 AGN contamination, used here; G From our NCSérsicexponential analysis of this Sy2 galaxy’s light-profile in Nowak et al. (2010; their Figure 9), using ; H Prieto et al. 2004, Muñoz-Marín et al. (2007), Tristram et al. 2007; I Peng et al. (2006), Muñoz-Marín et al. (2007); J Peterson (1978); K Davies et al. (2007, their Fig.22) uncalibrated light profile reveals a nuclear point source within 0.1-0.2 arcseconds, atop of the 1 arcsecond (70 pc) nuclear disc in NGC 1068. L Cecil et al. (2001); M Cooke et al. (2000); N Pastorini et al. (2007); O Kormendy et al. (2005), Ferrarese et al. (2006b: NGC 4486a = VCC 1327), Prugniel et al. (2011); P Marconi et al. (2000); Q Radomski et al. (2008); R Bianchi et al. (2007), Wold & Galliano (2006); light-profile given by Rest et al. (2001), used here;
The black hole masses for 64 galaxies have been taken from Graham (2008b, his table 1) and Graham et al. (2011, their table 1). The velocity dispersions have also been obtained from the tables in these papers, with the exception that this Letter uses a host spheroid velocity dispersion of 55 km s-1 for M32 (Chilingarian 2011, in prep.). The previously tabulated central velocity dispersion of 72 km s-1 for this nearby galaxy is elevated by the stellar dynamics close to the spatially well-resolved black hole.
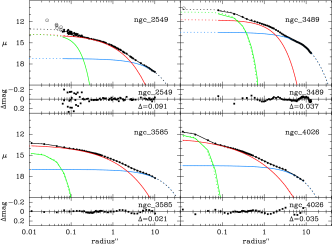
As noted by Graham & Spitler (2009), many of these galaxies also house nuclear star clusters. In the linear regression which follows, we do however exclude NGC 4564 (whose nuclear star cluster mass is not yet available) and NGC 1399 (whose nuclear star cluster is debatable) from Graham & Spitler’s list. In Table 1 we expand the above list of 10 (=12-2) galaxies for which black holes and nuclear star clusters coexist. We (i) provide masses for an additional three galaxies (NGC 1300, NGC 2549 and NGC 3585, see Figure 1) to give a total of 13, (ii) update the mass of the nuclear star cluster in NGC 4026, and (iii) tabulate upper limits on the star cluster masses for a further seven galaxies. Also provided in Table 1 are the names of galaxies whose spheroid mass is such that they are good candidates to house dual nuclei.
In passing, it is noted that the presence of nuclear star clusters with a different stellar population and thus a different stellar ratio to the surrounding bulge (e.g. Lotz et al. 2004; Côté et al. 2006; Paudel et al. 2011; den Brok et al. 2011, in prep.) may result in errors to the derivation of the supermassive black hole mass if one is not careful. We are not, however, in a position to quantify this, and we take the quoted supermassive black hole errors at face value. As discussed in Graham & Spitler (2008), the uncertainty on the nuclear star cluster masses is likely constrained to within a factor of 2.
The nuclear star cluster masses and host galaxy velocity dispersions shown in Ferrarese et al. (2006a), for 29 galaxies with 120 km s-1, have been included here to better populate the lower-mass end of our ()- diagram. From that study, the four nuclear star clusters with masses (VCC 1913, 1146, 1630, 1619) are reported to have half-light radii of 0.32, 0.50, 0.60 and 0.71 arcseconds, respectively (Ferrarese et al. 2006b). All of the remaining nuclei sizes are less than , i.e. less than 20 pc adopting their Virgo cluster distance of 16.5 Mpc. Ferrarese et al. (2006b) identified the first three of these four galaxies as hosting a small scale nuclear disc, and they observed a very dusty nucleus in the lenticular galaxy VCC 1619. Through application of their Sérsic-galaxy single-nucleus model, the flux which they assigned to their “nuclear star clusters” is greater than that acquired when separating nuclear discs and nuclear star clusters (e.g. Balcells et al. 2007). This explains the apparent deviant nature of at least the first three of these four galaxies in Figure 2b.
4 Results and Discussion
Expanding upon the – diagram from Graham et al. (2011, their figure 8), especially at the low- end through the inclusion of the () data from Ferrarese et al. (2006a) proves to be rather revealing. Figure 2 appears to display two markedly different slopes. While the slope at the high- end is around 5 for the “core” galaxies (Ferrarese & Merritt 2000; Hu 2008; Graham et al. 2011), the slope at the low- end is seen to be roughly consistent with a value of 2. Given that the efficiency of feedback from star clusters and massive black holes is different, it is probably preferable to separate their masses when considering slopes in – diagram.
Fitting the ordinary least squares bisector regression SLOPES (Feigelson & Babu 1992) — a code which is not sensitive to measurement uncertainties — to the (13+29) nuclear stellar masses and associated velocity dispersions mentioned in the previous section gives a slope of 2.140.31. Although one may rightly wonder if this slope has been lowered by the inclusion, at the high- end, of nuclear star clusters which have been partly eroded by massive black holes — if the scenario proposed by Bekki & Graham (2010) is correct. It is however the case that the four stellar nuclei with masses do increase the measured slope. Removing these four objects results in a slope of 1.780.24 (and an intercept at 70 km s-1 of 6.830.08), in remarkable agreement with the expected value of 1.740.52 (see section 2) based on a smaller independent data set. Using the bisector regression BCES from Akritas & Bershady (1996), and assuming a 10 and 50 per cent uncertainty on the velocity dispersion and the nuclear star cluster mass, respectively, gives a near identical slope and intercept of 1.730.23 and 6.830.07. While varying the uncertainty on the velocity dispersion by a factor of 2 has almost no affect on the fit, increasing the uncertainty on the nuclear star cluster mass to a factor of 2 yields the relation
| (1) |
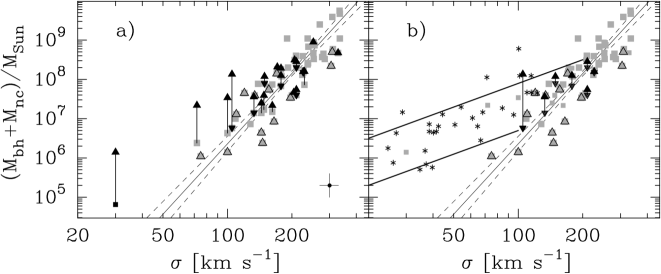
Figure 2 suggests that nuclear star clusters do not cleary define an offset parallel relation that is disconnected from the distribution of black holes in the – diagram, as suggested by Ferrarese et al. (2006a) who had found that –. Excluding what are likely to be nuclear stellar discs from four galaxies studied by Ferrarese et al. (2006a; although see Prieto et al. 2004 and Seth 2008b), while including an additional 13 nuclear star clusters in galaxies with velocity dispersions over a much larger baseline, reaching out to 200 km s-1, we have found a notably shallower – relation. The previous relation had inspired some to adapt the momentum-conserving arguments of Fabian (1999; see also King & Pounds 2003 and Murray et al. 2005) which had been used to explain why an – relation might arise. This nuclear cluster feedback mechanism involving stellar winds to produce an scaling relation may therefore require some modification (McLaughlin et al. 2006; McQuillin & McLaughlin 2012). Relaxing the assumption of an isothermal sphere for the dark matter halo might prove helpful. On the other hand, the results may be telling us that (momentum) feedback is not relevant, which would be expected if the star clusters were to have originated somewhere else and subsequently been deposited into the spheroid, rather than coevolving there.
It is noted that the distribution of points defining the – relation seen in Figure 2 may yet be shown to be tracing an upper envelope at the low- end. For-example, non-nucleated dwarf elliptical galaxies would reside below such an upper envelope if they do not contain a supermassive black hole of sufficient mass (see also Batcheldor 2010 in regard to sample selection effects).
Finally, an argument can be made for expecting a slope (or upper envelope) at the low- end of the – diagram that is actually closer to 1 than 2. While the data for galaxies with to is roughly consistent with a constant ratio (Marconi & Hunt 2003; Häring & Rix 2004), Graham & Spitler (2009, see their figure 3) found that the ratio increases as one proceeds to lower luminosities such that . Subsequently, coupled with the relation , one has that . Additional data plus a more detailed modelling of each galaxy’s individual stellar components, including inner and outer nuclear discs, will help to clarify this situation.
4.1 Predictions for a bent – and – relation
We know that for massive elliptical galaxies (Schechter 1980; Malumuth & Kirshner 1981) and (Merritt & Ferrarese 2001; Hu 2008; Graham et al. 2011). Consistent with these observations is the relation (Marconi & Hunt 2003; Graham 2007) for galaxy samples dominated by massive elliptical galaxies. One may then ask what about the lower-mass galaxies (with mag). As noted, these dwarf and intermediate-luminosity elliptical galaxies have (Davies et al. 1983; Matković & Guzmán 2005; de Rijcke et al. 2005) while they also seem to follow the relation (Ferrarese & Merritt 2000; Graham et al. 2011).111The offset nature of barred / pseudobulge galaxies in the – diagram (Graham 2008a; Hu 2008) appears to be an unrelated phenomenon. Consequently, one should find that for elliptical galaxies with mag ( – ). That is, the – relation may be broken or curved, and the and ratios may not be approximately constant values at these lower masses. This has nothing to do with pseudobulges nor the alleged divide between elliptical and dwarf elliptical galaxies at mag (see the review in Graham 2012a). Further support for the above suggestion stems from the observation that the luminosity-(Sérsic index) relation is linear (e.g. Graham & Guzmán 2003) while the –(Sérsic index) relation is curved or broken (Graham & Driver 2007). Consistency would require that the -luminosity relation be broken too.
Spheroids fainter than mag are the dominant spheroid population in the universe, and it is claimed here that past work on the – and –L relations have been severely biased by the sample selection of luminous spheroids likely built in ‘dry’ merger events. As such, the current near-linear – and –L relations (e.g. Marconi & Hunt 2003; Häring & Rix 2004; Graham 2007) should not be used to constrain the growth mechanism of supermassive black holes in galaxies (beyond simple addition in ‘dry’ merger events). This prediction, with significant implications for galaxy formation if true, will be investigated further in (Graham 2012b).
5 acknowledgment
The author wishes to have it acknowledged that more than five months elapsed between submitting his manuscript and receiving a referee letter. This research was supported by Australian Research Council grants DP110103509 and FT110100263. Graham thanks the organisers of the conference “Central Massive Objects: The Stellar Nuclei-Black Hole Connection”, June 22-25, 2010, ESO Headquarters, Garching, Germany, where this work was first presented.
References
- [1] Agarwal M., Milosavljević M., 2011, ApJ, 729, 35
- [2] Akritas M.G., Bershady M.A., 1996, ApJ, 470, 706
- [3] Antonuccio-Delogu V., Silk J., 2010, MNRAS, 405, 1303
- [4] Atkinson J.W., et al., 2005, MNRAS, 359, 504
- [5] Balcells M., Graham A.W., Domínguez-Palmero L., Peletier R.F., 2003, ApJL, 582, L79
- [6] Balcells M., Graham A.W., Peletier R.F., 2007, ApJ, 665, 1084
- [7] Batcheldor D., 2010, ApJ, 711, L108
- [8] Begelman M.C., Blandford R.D., Rees M.J., 1980, Nature, 287, 307
- [9] Bekki K., 2010, MNRAS, 401, 2753
- [10] Bekki K., Graham A.W., 2010, ApJ, 714, L313
- [11] Bianchi S., Chiaberge M., Piconcelli E., Guainazzi M., 2007, MNRAS, 374, 697
- [12] Carollo C.M., Stiavelli M., Seigar M., de Zeeuw P.T., Dejonghe H., 2002, AJ, 123, 159
- [13] Cecil G., Bland-Hawthorn J., Veilleux S, Filippenko A.V., 2001, ApJ, 555, 338
- [14] Cooke A.J., Baldwin J.A., Ferland G.J., Netzer H., Wilson A.S., 2000, ApJS, 129, 517
- [15] Côté P., et al., 2006, ApJS, 165, 57
- [16] Davies R.I., Sánchez F.M., Genzel R., Tacconi L.J., Hicks E.K.S., Friedrich S., Sternberg A., 2007, ApJ, 671, 1388
- [17] Davies R.L., Efstathiou G., Fall S.M., Illingworth G., Schechter P.L., 1983, ApJ, 266, 41
- [18] De Lucia, G., Springel, V., White, S.D.M., Croton, D., Kauffmann, G. 2006, MNRAS, 366, 499
- [19] de Rijcke S., Michielsen D., Dejonghe H., Zeilinger W.W., Hau G.K.T., 2005, A&A, 438, 491
- [20] Ebisuzaki T., Makino J., Okumura S.K., 1991, Nature, 354, 212
- [21] Faber S.M., et al., 1996, AJ, 114, 1771
- [22] Faber S.M., Jackson R.E., 1976, ApJ, 204, 668
- [23] Fabian A.C., 1999, MNRAS, 308, L39
- [24] Feigelson E.D., Babu G.J., 1992, ApJ, 397, 55
- [25] Ferrarese L., Merritt D., 2000, ApJ, 539, L9
- [26] Ferrarese L., et al., 2006a, ApJ, 644, L21
- [27] Ferrarese L., et al., 2006b, ApJS, 164, 334
- [28] Gallo E., Treu T., Marshall P.J., Woo J.-H., Leipski C., Antonucci R. 2010, ApJ, 714, 25
- [29] Gebhardt K., et al., 2000, ApJ, 539, L13
- [30] González Delgado R.M., Pérez E., Cid Fernandes R., Schmitt H., 2008, AJ, 135, 747
- [31] Graham A.W., 2004, ApJ, 613, L33
- [32] Graham A.W., 2007, MNRAS, 379, 711
- [33] Graham A.W., 2008a, ApJ, 680, 143
- [34] Graham A.W., 2008b, PASA, 25, 167
- [35] Graham A.W., 2012a, to appear in “Planets, Stars and Stellar Systems”, Springer Publishing (arXiv:1108.0997)
- [36] Graham A.W., 2012b, ApJ, 746, 113
- [37] Graham A.W., Driver S.P., 2007, ApJ, 655, 77
- [38] Graham A.W., Erwin P., Caon N., Trujillo I., 2001, ApJ, 563, L11
- [39] Graham A.W., Guzmán R., 2003, AJ, 125, 2936
- [40] Graham A.W., Onken C.A., Athanassoula E., Combes F., 2011, MNRAS, 412, 2211
- [41] Graham A.W., Spitler L., 2009, MNRAS, 397, 2148
- [42] Grant N.I., Kuipers J.A., Phillipps S., 2005, MNRAS, 363, 1019
- [43] Gualandris A., Merritt D., 2008, ApJ, 678, 780
- [44] Haehnelt M.G., Natarajan P., Rees M.J., 1998, MNRAS, 300, 817
- [45] Häring N., Rix H.-W., 2004, ApJL, 604, L89
- [46] Hartmann, M., Debattista, V.P., Seth, A., Cappellari, M., Quinn, T.R. 2011, MNRAS, 418, 2697
- [47] Held E.V., de Zeeuw T., Mould J., Picard A., 1992, AJ, 103, 851
- [48] Hu J., 2008, MNRAS, 386, 2242
- [49] Hueyotl-Zahuantitla F., Tenorio-Tagle G., Wünsch R., Silich S., Palouš J., 2010, ApJ, 716 324
- [50] King A.R., 2005, ApJ, 635, L121
- [51] King A.R., Pounds, K.A., 2003, MNRAS, 345, 657
- [52] Kormendy J., Richstone D., 1995, ARA&A, 33, 581
- [53] Kormendy J., Gebhardt K., Fisher D.B., Drory N., Macchetto F.D., Sparks W.B., 2005, AJ, 129, 2636
- [54] Komossa S., Merritt D., 2008, ApJ, 689, L89
- [55] Lauer T.R., et al., 2005, AJ, 129, 2138
- [56] Lotz J.M., Miller B.W., Ferguson H.C., 2004, ApJ, 613, 262
- [57] Lodato G., King A.R., Pringle, J.E., 2009, MNRAS, 392, 332
- [58] Lynden-Bell D., 1969, Nature, 223, 690
- [59] Magorrian J., et al., 1998, AJ, 115, 2285
- [60] Maksym W.P., Ulmer M.P., Eracleous M., 2010, ApJ, 722, 1035
- [61] Malumuth E.M., Kirshner R.P., 1981, ApJ, 251, 508
- [62] Mapelli M., Ripamonti E., Vecchio A,, Graham A.W., Gualandris A., 2011, A&A submitted
- [63] Marconi A., Oliva E., van der Werf P.P., Maiolino R., Schreier E.J., Macchetto F., Moorwood A.F.M., 2000, A&A, 357, 24
- [64] Marconi A., Hunt L.K., 2003, ApJ, 589, L21
- [65] Matković A., Guzmán R., 2005, MNRAS, 362, 289
- [66] McLaughlin D.E., King A.R., Nayakshin S., 2006, ApJ, 650, L37
- [67] McQuillin R.C., McLaughlin D.E., 2012, MNRAS, submitted
- [68] Merritt D., Ferrarese L., 2001, ApJ, 547, 140
- [69] Merritt D., Mikkola S., Szell A., 2007, ApJ, 671, 53
- [70] Muñoz Marín V.M., González Delgado R.M., Schmitt H.R., Cid Fernandes R., Pérez E., Storchi-Bergmann T., Heckman T., Leitherer C., 2007, AJ, 134, 648
- [71] Murray N., Quataert E., Thompson T.A., 2005, ApJ, 618, 569
- [72] Neumayer N., Walcher C.J., 2012, Advances in Astronomy, in press (arXiv:1201.4950)
- [73] Nowak N., Thomas J., Erwin P., Saglia R.P., Bender R., Davies R.I., 2010, MNRAS, 403, 646
- [74] Pastorini G., et al., 2007, A&A, 469, 405
- [75] Paudel S., Lisker T., Kuntschner H., 2011, MNRAS, 413, 1764
- [76] Peng Z., Gu Q., Melnick J., Zhao Y., 2006, A&A, 453, 863
- [77] Peterson C.J., 1978, ApJ, 221, 80
- [78] Prieto M.A., et al., 2004, ApJ, 614, 135
- [79] Prugniel P., Zeilinger W., Koleva M., de Rijcke S., 2011, A&A, 528, A128
- [80] Radomski J.T., et al., 2008, ApJ, 681, 141
- [81] Rest A., et al., 2001, 121, 2431
- [82] Rosswog S., Ramirez-Ruiz E., Hix W.R., 2009, ApJ, 695, 404
- [83] Sargent W.L.W., Young P.J., Lynds C.R., Boksenberg A., Shortridge K., Hartwick F.D.A., 1978, ApJ, 221, 731
- [84] Schechter P.L., 1980, AJ, 85, 801
- [85] Seth A., Agüeros M., Lee D., Basu-Zych A., 2008, 678, 116
- [86] Seth A.C., Blum R.D., Bastian N., Caldwell N., Debattista V.P., 2008b, ApJ, 687, 997
- [87] Seth A.C., et al., 2010, ApJ, 714, 713
- [88] Silk J., Rees M.J., 1998, A&A, 331, L1
- [89] Tonry J.L., 1981, ApJ, 251, L1
- [90] Tremaine S.D., Ostriker J.P., Spitzer L., Jr., 1975, ApJ, 196, 407
- [91] Tristram K.R.W., et al., 2007, A&A, 474, 837
- [92] Valluri M., Ferrarese L., Merritt D., Joseph C.L., 2005, ApJ, 628, 137
- [93] Wehner E.H., Harris W.E., 2006, ApJ, 644, L17
- [94] White S.D.M., Frenk C.S., 1991, ApJ, 379, 52
- [95] Wolfe A.M., Burbidge G.R., 1970, ApJ, 161, 419
- [96] Wold M., Galliano E., 2006, MNRAS, 369, L47