Beyond the Blacklist: Modeling Malware Spread and the Effect of Interventions
Abstract
Malware spread among websites and between websites and clients is an increasing problem. Search engines play an important role in directing users to websites and are a natural control point for intervening, using mechanisms such as blacklisting. The paper presents a simple Markov model of malware spread through large populations of websites and studies the effect of two interventions that might be deployed by a search provider: blacklisting infected web pages by removing them from search results entirely and a generalization of blacklisting, called depreferencing, in which a website’s ranking is decreased by a fixed percentage each time period the site remains infected. We analyze and study the trade-offs between infection exposure and traffic loss due to false positives (the cost to a website that is incorrectly blacklisted) for different interventions. As expected, we find that interventions are most effective when websites are slow to remove infections. Surprisingly, we also find that low infection or recovery rates can increase traffic loss due to false positives. Our analysis also shows that heavy-tailed distributions of website popularity, as documented in many studies, leads to high sample variance of all measured outcomes. These result implies that it will be difficult to determine empirically whether certain website interventions are effective, and it suggests that theoretical models such as the one described in this paper have an important role to play in improving web security.
I Introduction
The network worms which caused havoc ten years ago, such as Code Red, actively spread by ‘pushing’ themselves onto vulnerable systems through automated scanning. In contrast, a major problem today is computer infections that propagate via a ‘pull’-based mechanism. For example, in a drive-by download, an attacker infects a victim computer’s web browser without direct interaction [1, 2]. In this scenario, the attacker first compromises an otherwise benign web server, injecting executable code into its web pages, and then waits for users to visit the infected website and acquire the infection. Because many users arrive at websites through search, search engines have become a crucial battleground over the distribution of malware.
Search providers have an incentive to defend against such attacks because they degrade search results. A typical approach is that taken by Google, which attempts to detect and blacklist websites that host malicious content [3]. Blacklisting can take the form of displaying a warning message via a client side browser plugin to discourage users from visiting a website, or outright removal from the search results. Blacklisting can be used to combat many types of malicious content, and in a web environment where new attacks are developed frequently, it is important to have a general approach to reducing infection. However, because blacklisting can dramatically reduce visits to websites, search engines are very careful to avoid false positives (i.e., flagging an uninfected website as infected). Such caution can delay responses, which in turn may raise infection rates.
In this paper we devise a concise Markov model to study how web infections spread through large populations of websites, and explore how infections might be contained through blacklisting. We also propose a generalization of blacklisting called depreferencing, where a search engine reduces a website’s ranking in search results in proportion to the engine’s certainty that the website is infected. Depreferencing can be more tolerant of false positives than a binary response such as blacklisting, because the scale of the intervention can be adjusted to specific levels of false positives. Depreferencing provides a controllable depreferencing parameter, , that can be tuned to achieve specific reductions in infections or false positives. We derive exact analytic expressions that relate the depreferencing parameter, , to infection rates and traffic loss due to false positives. We also identify critical points for the model parameter values that govern the trade-off between infection and traffic loss.
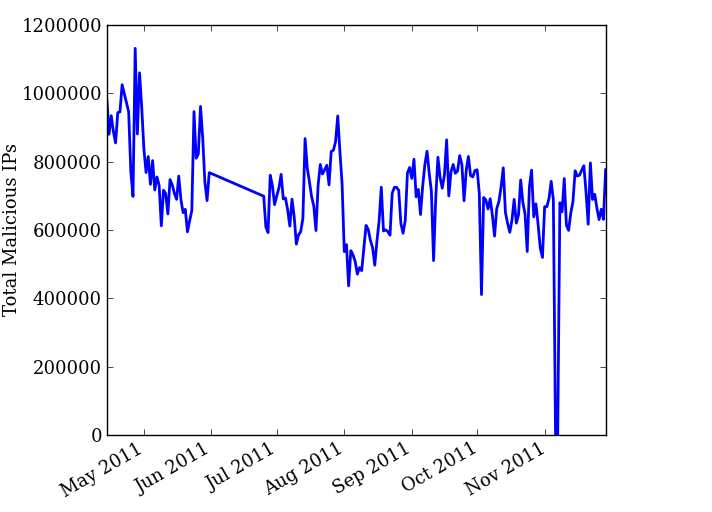
We believe that modeling is particularly well-suited to the task of examining techniques for controlling malware spread over the web. First, it allows us to examine unconventional interventions, such as depreferencing, at low cost. Given the relatively grim status quo in web security, more radical countermeasures deserve consideration, and modeling offers a good way to assess the impact of new strategies without the expense and commitment of an actual implementation. Second, modeling can deal with the extreme dynamics of the web better than empirical exploration alone. Our analysis shows that the heavy-tailed distribution of website popularity leads to high variance in outcomes. This high sample dependence makes it extremely difficult to conduct reliable comparative assessments of the benefits of different interventions, especially with a limited number of empirical measurements. For example, the infection of a single popular site can suddenly and dramatically increase overall user infection rates, an effect that can be seen in Figure 1, which contains data on malicious IP addresses collected from the Internet Storm Center111http://isc.sans.org. We show that this variance can obscure even large improvements in infection and recovery. With the modeling approach, we can easily run many simulations, and more reliably estimate the comparative impacts of different intervention strategies.
Finally, modeling lets us examine the impact of interventions across many stakeholders and identify tensions that may arise. For instance, improved security for search operators and consumers may be achieved in part at the expense of increased risk of incorrect blacklisting for website operators. Modeling allows us to more precisely quantify these trade-offs.
II Modeling Infections
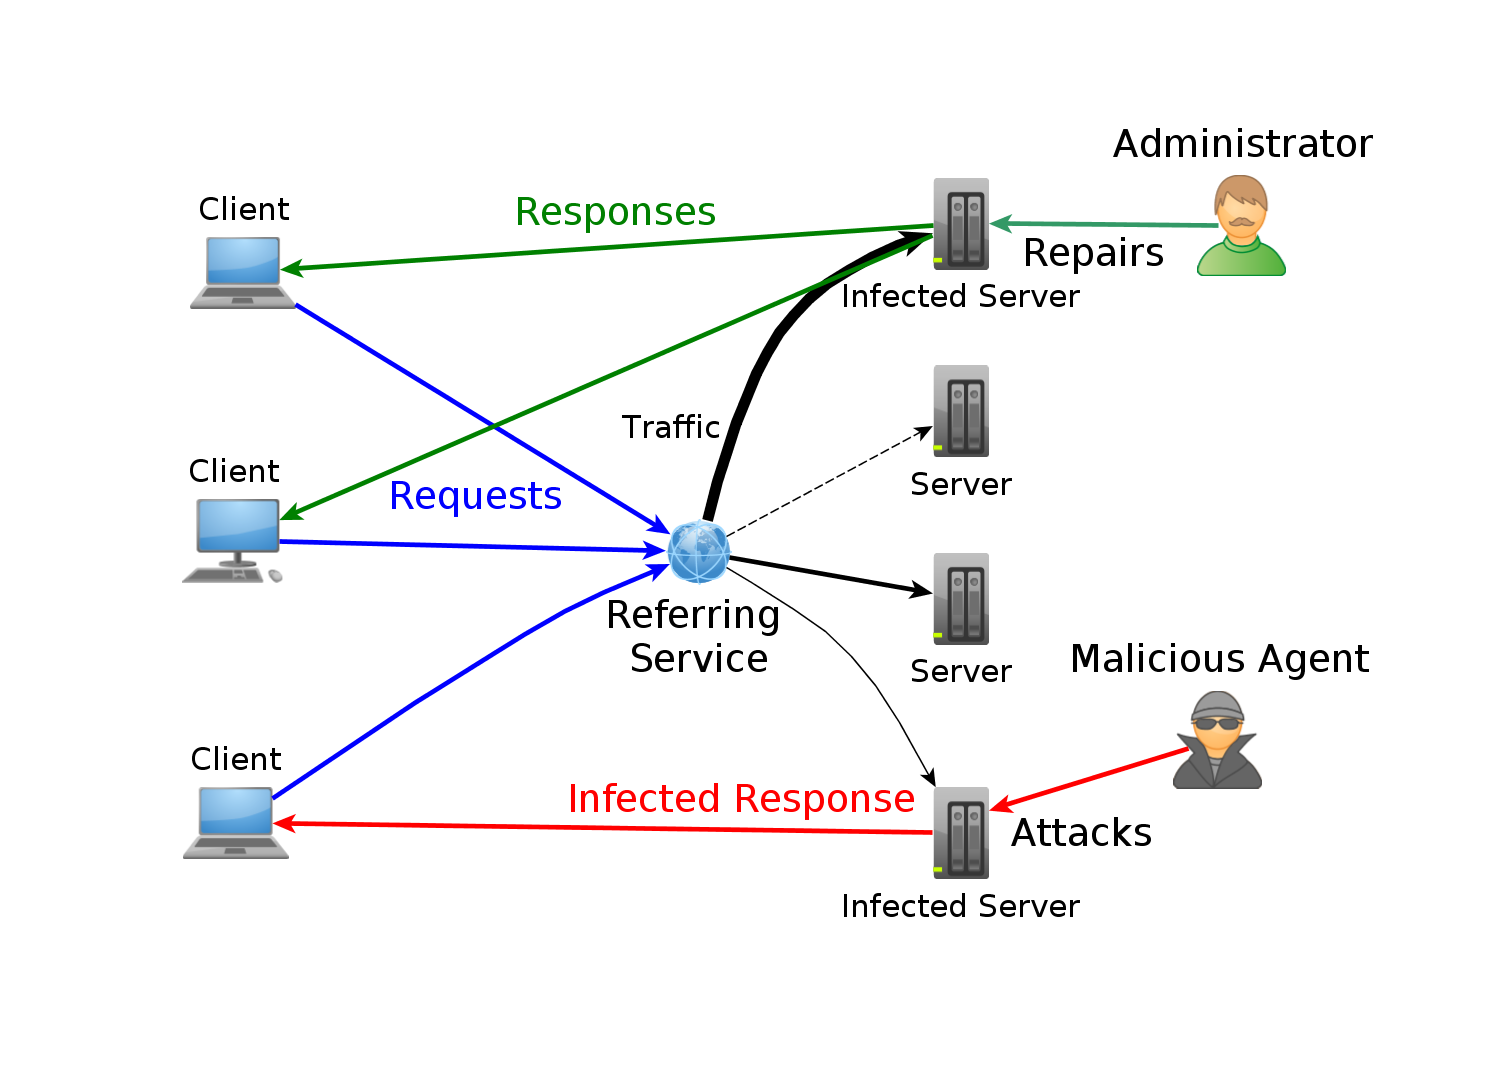
We model a population of servers that is under attack from malicious agents, as depicted in Figure 3. We do not model specific types of infections, but rather assume that an infection is any event that compromises a website such that it could be used to spread malware to users. Once infected, a server recovers when an administrator notices the infection and clears it. In this paper we explore the impact of search provider interventions and so are only interested in clients that connect to servers via referrals from a search provider. Hence, in our model, client exposure to infection is driven solely by website popularity as determined by the search provider. In an attempt to improve search results, the search provider monitors websites to determine whether they are infected, and may incorrectly identify uninfected websites as infected. We assume that an administrator clears false identifications of infection at the same rate as real infections.
Our model includes a population of websites222We will use the terms website and web server, or simply server, interchangeably., each with a popularity, , drawn at random from a specified distribution. represents the total number of visits a website receives. The key outcome we are interested in measuring is client exposure, which is directly proportional to the expected number of visits that infected websites receive. At any time, a website is in one of three possible states: infected, uninfected, or falsely infected (i.e. classified by the search provider as infected when it is actually not). Each server transitions between these states at discrete time steps, according to the Markov chain depicted in Figure 3. The key parameters are: , the probability of a website becoming infected; , the probability of recovering from an infection; and , the probability of falsely being classified as infected.

We make the simplifying assumption that the probabilities , , and are constant across the population of servers and time invariant. Unfortunately, data on the exact distributions of these parameters are not readily available and often contradictory. For example, there are no data supporting a systematic relationship between a website’s popularity and its susceptibility to infection. We examined a sample of websites infected with malware that were reported to StopBadware from 2007 to 2009, and found that more popular websites (as ranked by Alexa) are slightly more likely to be infected. By contrast, Moore et al. [4] found that more popular web search terms are less likely to include infected websites in their results. In both cases, the effects are small so we argue that assuming constant probabilities is reasonable.
Our model is discrete time; an alternative approach is to model the population of servers using differential equations. In the case of large , the steady state distribution of infection probability would be exactly the infection rates in a differential equation model[5]. We use a discrete-time model instead because it allows us to easily incorporate time-dependent phenomena (such as our interventions) and distributions of values (such as traffic), and it is simpler to explore transient effects.
III Modeling Interventions
We model two forms of intervention: blacklisting, which is currently used by search engines, and a hypothetical approach called depreferencing, which offers a way to adjust intervention parameters to specifically control the trade-off between infections and traffic loss due to false positives.
III-A Blacklisting
A common approach taken by search engines that detect a compromised website is to inform the user in the search results (through a client side application), before the user has a chance to visit the website, and then to produce further warnings if the user persists in attempting to visit the website. This is equivalent to blacklisting the site because users are unlikely to ignore the warning.333In Google, clicking on a result labeled infected takes the user to a warning page with a small text URL at the bottom of the page which the user has to copy and paste into the browser navigation bar. Because blacklisting prevents the website from receiving all or nearly all of its search traffic, minimizing false positives is essential. For example, Rajab et al. [6] claim that Google’s Safe Browsing infrastructure “generates negligible false positives.”
We assume that blacklisting takes a fixed number of time steps to detect a compromised website and blacklist it. We refer to this as the detection delay, denoted . A website infected at time will be blacklisted at time . Once blacklisted, the traffic to that the website is set to zero, i.e. . Formally, if a website, , is infected at time , its traffic, , at time is
| (1) |
The time period captures the notion that it will take a search engine a certain amount of time to determine that a website is compromised with high certainty (negligible false positives). Thus accounts for how frequently the website is crawled, how much computational time is required to confirm the infection, how much the search engine is willing to invest in malware detection, and other possibilities, such as giving the compromised site a certain grace period to clean up the infection.
In the model, we assume that immediately after a website recovers, its popularity is restored to its previous value. That is, once a website has been cleaned, the administrator informs the search engine and the blacklisting is removed without delay. In reality, there would be a small delay before the blacklisting is removed. For example, when an administrator requests Google to run an automated test for malware, it will take at most a few hours to complete [7], and up to 24 hours for the malware warning to disappear from all search results. Because the time period is small and constant, we can exclude it from our model without significantly changing the results.
III-B Depreferencing
We explore a generalized hypothetical intervention, called depreferencing, which, to the best of our knowledge, is not actually implemented by any existing search engine. The idea is that when a search engine detects a possibility of infection in a website, it reduces the traffic that website receives. This could be implemented by reducing the rank of that website in the search results, or probabilistically providing warnings to users. Because the response does not block all traffic to the website, but rather reduces the volume of traffic, the detection process can tolerate false positives, allowing the search engine to react more rapidly and aggressively. Search providers could use coarser and less precise detectors to crawl websites more frequently, requiring significantly less computation time to classify websites as infected.
We model this intervention by reducing the popularity of a website by a fixed percentage every time step after it is discovered that the website is infected. If a website is infected at time , an infected website’s traffic at time is
| (2) |
where is the depreferencing parameter, which controls the strength of the response. Note that Equation 1 is equivalent to Equation 2 when . We believe that adjusting search results is a plausible response that would be easy to implement. For example, a search engine like Google could simply reduce the page ranks of infected websites, which should directly affect their popularity in search results. Similarly to blacklisting, we assume that when a website recovers from an infection, its popularity is immediately restored to its original value. Because the response is less drastic, search engines may be able to reduce the detection delay in this new intervention.
Equation 2 is one of an even more general class of methods for combating exposure to infection. We could define a general , such that is monotonically decreasing in time. For example could be a linear or logistic function. We choose an exponential decline as it seems a natural fit for our application. Investigation into other forms appropriate for other applications is left for future work.
As a consequence of the potentially more rapid and hence imprecise detection of compromised sites, our model includes a constant probability that an uninfected website is classified as compromised and has its rank reduced. This is in contrast to the blacklisting approach, where we assume there are negligible false positives. For depreferencing, we assume that websites that are incorrectly classified as compromised recover at the same rate, , as compromised websites. In other words, the process of recovery is the same whether a website is actually infected or not. This requires that the administrator realize that the website is infected (for example, users of Google’s Webmaster Tools are notified when their sites are infected) and that appropriate steps are taken to correct the problem.
We do not model false negatives, i.e. infected websites that go undetected, because our model studies the effect of interventions on client infection rates, and we assume that in both blacklisting and depreferencing the detection process has similar levels of false negatives. Hence, the false negative rates should not affect comparison of the outcomes. From a practical perspective, data on false negatives are rare or non-existent because they are extremely difficult to gather. We leave the analysis of false negatives to future work.
IV Analysis
This section analyzes the mathematical properties of the model described in the previous section. First we describe the steady state values of the Markov chain shown in Figure 3. Second, we analyze the first and second moments of the random variables that define the traffic loss and the number of clients exposed to infection. We then provide expressions that relate the intervention parameters to the infection exposure and traffic loss, and identify critical control points.
IV-A Steady State Distribution
Let the state of a server in the Markov chain in Figure 3 be the random variable , where denotes infection, denotes no infection and denotes a false positive infection. It is easy to see that the Markov chain is ergodic except for some degenerate cases such as . However, such cases are unlikely to occur in the real world.
Because our Markov chain is ergodic it is guaranteed to converge to a unique stationary distribution, which is given by
| (3) | ||||
| (4) | ||||
| (5) |
Moreover, because this is a finite time-homogeneous ergodic Markov chain, it will have a short mixing time. Hence we focus on the steady-state in the remainder of the analysis.
IV-B Client Exposure and Website Loss
The probability that a website becomes infected at a time and remains infected until time depends on the probability that the website was not infected at time , became infected at time , and remained infected for the next timesteps. More formally, let denote the event that a server has been in a state of infection for exactly time steps. Then
| (6) |
Observe that the events and , with , are mutually exclusive, e.g. a server cannot be infected for exactly 5 and exactly 6 time steps.
Next we derive an expression for the random variable , which describes the number of clients exposed to infection from a website , when the search provider implements an intervention controlled by the parameters and . Recall that is the detection delay for infection identification and is the depreferencing parameter, i.e., the strength of the response. The expectation of exposure to infection from website is then
| (7) |
The above expression simplifies to when no intervention is taken, which would correspond to or .
The other important random variable we are interested in is , which represents the traffic lost by a website as a consequence of false positives. Following a similar analysis to the earlier one for client exposure, if denotes being in the false positive state for time steps, we have
| (8) |
The lost traffic at a specific time will be . Substituting for as given by Equation 2, the expected traffic loss is
| (9) |
We can then define the infection exposure, which is the fraction of traffic exposed to infection from all websites, as
| (10) |
and the overall traffic loss due to false positives as
| (11) |
Using linearity of expectation, the expressions for and are simply those in Equation 6 and Equation 8 respectively, while omitting , specifically:
| (12) |
| (13) |
We note that both of the infection exposure and the traffic loss are independent of the distribution from which the ’s are drawn, or how many servers there are.
The effectiveness of the depreferencing parameter, , and the detection delay, , in the control strategy for , depends only on the recovery rate . If is particularly large (a fast recovery rate), then any intervention will have a small effect. Only when websites are slow to react to infections are interventions which alter traffic likely to have significant impact.
Conversely, and both affect . In particular, a decrease in the infection rate or the recovery rate will cause an increase in loss due to false positives for a fixed false positive rate . Intuitively, a website that is unlikely to be in the infected state is more vulnerable to being falsely infected.
We now determine the variance in and . Because each of the ’s is independent and the sum of the traffic is a constant,
| (14) |
Additionally, variance can be defined as . Using these two facts and some simple algebra we have:
| (15) |
If the ’s are drawn from a distribution with finite variance and expectation and is large, then we can apply the central limit theorem to Equation 15 to rewrite it in terms of the distribution of ’s
| (16) |
Observe that LABEL:eq:VarianceInfection2 is monotonically decreasing in the number of servers . So as the population of websites increases we expect the variance in the fraction of traffic exposed to infection to go to 0.
It is almost certain, however, that the distribution of for real webservers is heavy-tailed and does not have finite variance or finite expectation [8, 9, 10]. In the case of a heavy-tailed or power-law distribution of , the variance does not converge to a single value for large , but to a distribution of values. Furthermore, because the sum of power-law i.i.d. random variables exhibits heavy tailed behavior [11] [12], the distribution of will also exhibit heavy tailed behavior.
The sum of power law distributed variables can be approximated by the maximum over the variables [13], which means that the last fraction in Equation 15 can be approximated as for particularly heavy tailed distributions and large , i.e.
| (17) |
If we take this as an upper bound, we see that improving either or to lower infection will also lower the variance in the infection exposure rate. Depending on the value of the exponent in the distribution of traffic, may not have finite variance or expectation. As we discuss later, this is important because it implies that empirical studies of infection exposure (or traffic loss) are likely to be highly sample dependent, and that even significant changes to the variables like and can be hard to discern.
A similar analysis yields slightly different results for traffic loss:
| (18) |
IV-C Critical Values
In general, changing parameter values from one set, , to another, , will result in a change in infection exposure, i.e., . However, there could be some settings of and , such that the outcome will not change, i.e., . We call these settings, or transition points, the critical values for the parameters.
The critical value, , for the depreferencing parameter is the most important, because we expect that search providers will have more control over than . For example, a new detection algorithm may require a different ; the search provider could then use the critical value of to ensure that the infection exposure did not change.
To derive the critical value for the infection exposure, we first calculate an expression for the precise value of needed to achieve a particular infection exposure rate , as
| (19) |
We can then derive the critical value for the infection exposure by substituting for in Equation 19, which gives
| (20) |
where is defined as
| (21) |
Equation 21 shows the critical value needed to ensure the infection exposure does not change when changes. An alternative goal might be to ensure that the traffic loss due to false positives does not change with a new value for , i.e. . This will be given by another critical value, . Once again, we first derive an expression for the precise value of needed to attain a particular expected traffic loss fraction ,
| (22) |
Setting in Equation 22, we get
| (23) |
where is defined as
| (24) |
As can be seen from Equation 23, the critical value for the traffic loss is independent of the false positive rate .
Using Equation 20 and Equation 23 in combination, a search provider has the ability to decide how to adjust to balance an increase in the traffic loss against an increase in infection exposure.
V Experimental Results
To verify the results derived in Section IV we used a Monte Carlo simulation of the model described in Section II. Unless otherwise noted, we used the following parameter settings for all experiments: , , and . Although we believe that these parameter settings are plausible, our goal is not to provide a precise match with real-world outcomes, but rather to investigate more general consequences of features such as variance and the comparative efficacy of interventions. For each experiment, we conducted 1000 runs, and each run was 75 time steps. This length is sufficient for the model to reach a steady state.
We examine two different distributions throughout the experiments: uniform, with , and power law with with . Although these two distributions are likely not precisely representative of the real world, they are useful in that they represent two possible extremes of variance (finite and undefined).
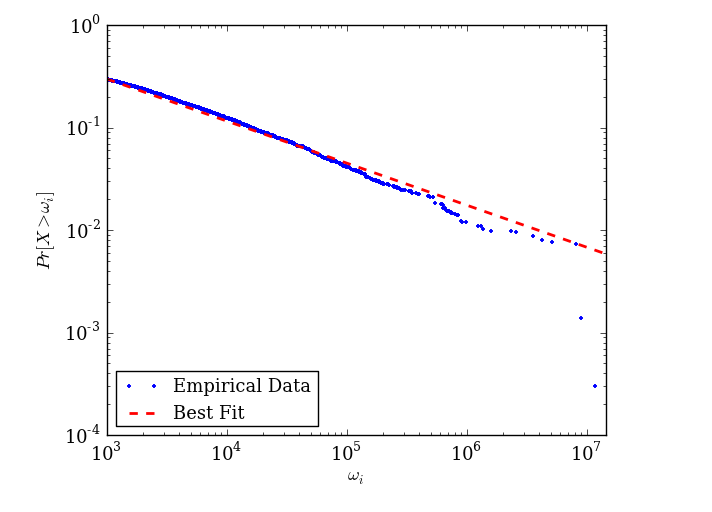
In reality, the distribution is likely heavy-tailed, possibly a power-law [8, 9, 10]. We found that a power-law with an exponent of provides a good fit with empirical data on website popularity, as can be seen in Figure 4. We calculated the exponent for a random sample of 10,000 websites listed in the top 1 million websites according to the web-analytics firm Alexa, using estimates for the daily number of visits obtained by querying the Alexa Web Information Services API.444http://aws.amazon.com/awis/
V-A Popularity Distribution
According to the analysis in Section IV, distributions of website popularity with undefined variance will result in large fluctuations in client exposure to infection and will be highly dependent on the sample of servers chosen. This is confirmed in our experiments, as can be seen in Figure 5. The uniform distribution of website popularity results in low variance in client exposure (Figure 5a), whereas the power law website popularity results in very high variance, both in a single run of the model and among different runs (Figure 5b).555Because the variance is undefined in general for a power-law, we substitute the run sample values of the ’s into Equation 15 to compute the theoretical variance shown in Figure 5b. For both popularity distributions, the experimental average of the runs rapidly converges to the expected steady-state value for (0.091), although power-law distributions can yield values as high as 0.96 in individual runs, an order of magnitude higher than the expected value.

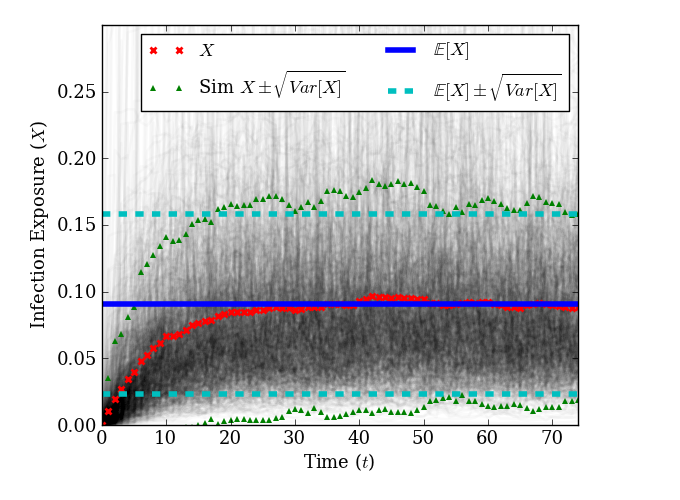
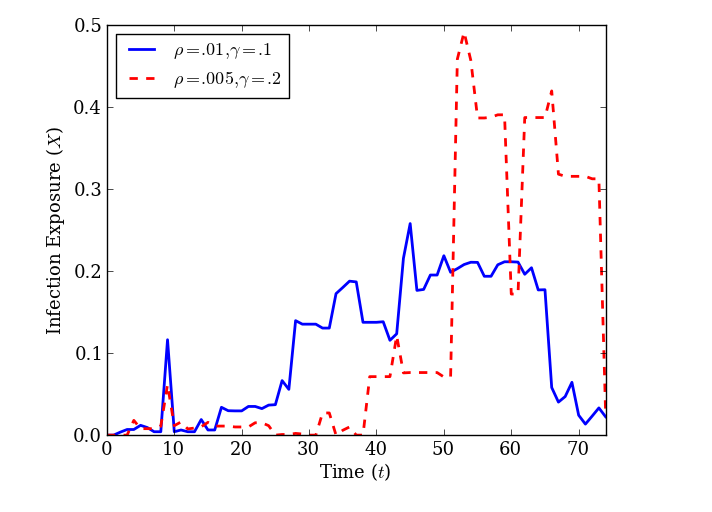
Figure 6 shows the variation in individual runs more clearly. Figure 6a shows three different runs of the simulation with the same parameters, . There are large jumps in client exposure to infection that occur when the more popular websites get infected, followed by plateaus before those websites recover, and then abrupt drops after recovery. Figure 6b shows two runs of the model with different infection and recovery rate parameters. Strikingly, the run with the infection rate cut in half and the recovery rate doubled, seems to exhibit worse infection behavior. This clearly illustrates why it might be difficult to determine whether web security improvements are effective. The high variance in the runs illustrates the importance of modeling, as running experiments in the real world could require many trials over long periods of time to reach conclusions with any confidence.

We also tested distributions other than uniform and power-law and confirmed the theoretical prediction that distributions with finite variance produce low variance in the measured outcome, whereas those with undefined variance produce high variance in the measured outcome (results not shown).
V-B Interventions
Figure 7 demonstrates the effect of varying the detection delay, , on the steady state client exposure rate. For both uniform and power-law popularity distributions, blacklisting is effective only if implemented quickly, i.e. before websites have had sufficient time to recover. The likelihood of remaining infected for time steps is , which becomes exponentially small for large . For example, once , the steady state expected exposure is very close to the theoretical value with no interventions (around 0.091). Thus, for larger , most infections will resolve before infected websites are blacklisted. The precise relationship between and is given by Equation 7.


The results of varying the depreferencing parameter, , are shown in Figure 8. Because proportional depreferencing of popularity has an exponential impact on the ranking (Equation 2), even large values of can reduce infection rates significantly, for example, when , the steady state client infection rate is half of the baseline value.


Depreferencing gives finer control to search engines, because adjusting should be relatively easy, unlike trying to reduce , the control parameter for blacklisting. This finer control might allow for algorithms that produce more false positives (which in turn would reduce the number of missed infections), because the effects of being mislabeled as infected could have far less impact on a website that was moved down in the search rankings rather than being blacklisted.
V-C False Positives
Depreferencing makes it feasible to use imprecise detection algorithms that trade faster detection for higher false positives. In our model, this would translate into a higher value for , the false positive probability. Figure 9 explores the impact of on the change in traffic loss due to false positives. Once again, a large variance in the website popularity distribution has a large impact on the outcome, i.e. the traffic loss. Further, as can be seen in Figure 9, reducing the false positive rate is only worthwhile if it can be dropped below a certain value (in this particular example, around ); when is high enough, every website is mainly in the infected or falsely infected state, and rarely in the uninfected state.


V-D Exploring the Parameter Space
Figure 10 shows how the expected infection exposure and traffic loss change as the parameters and vary from a base setting of and . We can see from the solid line at the critical value in Figure 10a that changing the depreferencing parameter, , can only correct for a small increase in , up to . Beyond that, the expected exposure increases, regardless of the setting of . The value of only starts to have a large positive impact if the detection delay, , drops significantly. We see similar results for the change in expected traffic loss, as shown in Figure 10b. Once again, only the smallest increases in can be compensated for by increasing . However, lack of compensation means a decrease in traffic loss, which is a desirable outcome. We also see that it is easy to adjust to ensure that the traffic loss does not increase for almost every change in .


It is clear that a faster response (reducing ) will reduce the infection exposure rate, and any potential traffic loss can easily be compensated for by changing . However, a faster response may be less accurate and result in a higher false positive rate, . We explore this idea by again calculating the infection exposure with base values and , and then calculating the critical value needed to maintain the same infection exposure rate for a variety of values. We then measure the change in traffic loss for a variety of false positive rates. The results can be see in Figure 11. Generally, a decrease in detection delay, , increases the traffic loss for a constant false positive rate. If the false positive rate also goes up as decreases, the problem is even worse. However, if the false positive rate can be kept sufficiently small (below 0.1 in this example), then there is flexibility to decrease the delay without a major increase in traffic loss.

VI Related Work
There are many approaches to combating web-based malware, including the use of virtual machines or kernel extensions to check for suspicious changes to the operating system [14, 15, 2, 16], emulating browsers to detect malicious JavaScript [17, 18], and detecting campaigns that promote compromised sites to the top of search results [19]. No technique is completely effective at disrupting web-based malware, according to a study of Google’s data over more than four years [6]. In our view, one limiting factor is the choice of conservative approaches that minimize false positives at the expense of speedy detection. For example, Provos et al. [2] choose to minimize false positives in a system that allows explicit trade-offs between false and true positives.
Depreferencing of search results is an example of a graduated response, which is different from the binary, all-or-nothing, response methods, such as blacklisting, that are usually taken in cybersecurity. An early implementation of graduated response was a Linux kernel extension called pH [20], which responded to anomalous system call patterns by delaying subsequent system calls in the offending process. Other graduated responses operate by slowing down, or throttling, outgoing requests [21, 22] in active networks [23], Domain Name Service [24], Border Gateway Protocol [25], and peer-to-peer networks [26]. However, this is the first work we are aware of that uses a graduated response outside of the time domain.
Several studies have focused on alternative intervention strategies, which could potentially be generalized using our depreferencing method. For example, Hofmeyr et al. modeled responses available to ISPs [27]. Other researchers have identified suitable intervention strategies based on empirical research, which might also be amenable to depreferencing. For example, Levchenko et al. [28] found that criminals relied on just three payment processors to collect money from victims, which led the authors to recommend targeting the payment processors as a low-cost intervention. Similarly, Liu et al. [29] empirically measured the effectiveness of pressuring registrars to suspend spam-advertising domain names. In a related intervention, Google has successfully pushed ad-filled sites down the results by changes to its search-ranking algorithm [4], suggesting that a similar effort to depreference malware-infected sites is technically feasible.
VII Discussion
A general theme of this research is the emphasis on modeling. Modeling is a cost-effective way to explore intervention strategies, including investigating novel ideas, without the expense of first implementing them. As our results show, modeling can be particularly helpful for understanding long-term trends in processes with high variance, where direct experimentation can be misleading. Thoroughly testing the interventions we explore in this paper would likely require an unreasonable amount of time and money for any search provider.
To the best of our knowledge, website depreferencing has not previously been deployed to combat the drive-by-download problem. A similar concept has been used previously in computer security [20, 30]. Although we believe that depreferencing is technically feasible, other issues may arise with this type of response. For example, a policy that explicitly tolerates false positives could trigger accusations of bias against search engines.666The European Union is already investigating accusations that Google abused its power by preferring its own results over rivals. See http://www.time.com/time/business/article/0,8599,2034138,00.html. Another issue is how depreferencing might be gamed. For example, there could be an incentive to deliberately infect competitors’ websites, or cause them to appear infected, so their search rankings are demoted. Such industrial sabotage may in fact already happen. However, the scope for it could increase if less precise, false-positive tolerant detection mechanisms are used.
We have made several simplifying assumptions that we believe are reasonable in the absence of more detailed information. For example, we assume that website infection and client infection probabilities are independent. In reality, this may not be the case. One variety of drive-by-download malware steals the login credentials of users who administer websites, enabling the malware to spread to those websites. Hence, when a client is infected, the probability of infecting one or more websites increases, corresponding to a change in . We have chosen not to model this form of malware spread, because it has been observed only in a handful of outbreaks (e.g., one Zeus variant in 2009 [31]). Another example is the assumption that the distribution of website popularity is time invariant, which is true in general, although the popularity of individual websites can vary over time [32]. However, the popularity of infected websites may change over time when attackers attempt to promote compromised websites in search-engine rankings [19]. In future, if sufficient information can be attained, it may be possible to accurately model this aspect. We believe, however, that even with more accurate information, the heavy tailed nature of popularity will cause similar heavy tailed behavior in infection exposure and traffic loss.
Another area of future work would be to focus on infections that spread in a general network environment where a referral service (such as search) plays a key role. Similar interventions could be applied when infections are spread from website to website, rather than simply exposing a client population. This could be a particularly good model for controlling infections of malicious software in online social networks.
In our analysis and modeling we disregard the effect of false negatives, primarily because we assume that the response methods we explore use the same detection mechanisms, subject to the same false negative rates. Usually, in real detection systems, reducing the accuracy of the system by increasing false positives usually leads to a decrease in false negatives, a feature which gives rise to the traditional ROC curve. We have insufficient data to model this effect, but it suggests that the depreferencing mechanism could have additional benefits beyond those shown by the model: increasing tolerance of false positives could also improve the rate of detection of compromised sites.
Our focus in this research has been to develop a plausible model that allows us to assess the impact of different interventions on the spread of drive-by-download malware. Our goal is to show that modeling can be a useful tool for search providers to use when considering different interventions. We do not have access to data that could enable us to make quantitative predictions about interventions. We expect search providers to have much more relevant data, especially information on the distribution of website popularity, the efficacy of infected website detection and the recovery times for infection.
VIII Conclusion
By building and analyzing plausible models, like the one presented in this work, we are able to better understand where search providers and web administrators should focus their efforts for reducing infections, while avoiding the large-scale (and potentially expensive) experiments needed to test interventions in the field. When there is a high variance in the underlying distributions, such as the website popularity, corresponding high variance in outcomes can make it difficult to assess the comparative effectiveness of interventions in one-off field experiments.
We proposed and explored a novel intervention strategy, called depreferencing, where a possibly infected website is moved down in the search results, rather than outright blacklisted. Depreferencing may be an attractive alternative to blacklisting for search providers because it allows them to use less precise detection methods with higher false positive rates, potentially increasing the speed of response to infection and reducing the cost of detection. These results imply great difficulty in determining empirically whether certain website interventions are effective, and it suggests that theoretical models such as the one described in this paper have an important role to play in improving web security.
IX Acknowledgments
The authors gratefully acknowledge the support of DOE grant DE-AC02-05CH11231. Stephanie Forrest acknowledges partial support of DARPA (P-1070-113237), NSF (EF1038682,SHF0905236), and AFOSR (Fa9550-07-1-0532).
References
- [1] N. Provos, D. McNamee, P. Mavrommatis, K. Wang, and N. Modadugu, “The ghost in the browser: Analysis of web-based malware,” in Proc. 1st USENIX Workshop on Hot Topics in Understanding Botnets (HotBots’07), Cambridge, MA, Apr. 2007.
- [2] N. Provos, P. Mavrommatis, M. Rajab, and F. Monrose, “All your iFrames point to us,” in Proc. 17th USENIX Security Symp., Aug. 2008.
- [3] Google, “Safe browsing api,” http://code.google.com/apis/safebrowsing/.
- [4] T. Moore, N. Leontiadis, and N. Christin, “Fashion crimes: trending-term exploitation on the web,” in Proc. ACM CCS’11, Chicago, IL, Oct. 2011.
- [5] C. Zou, W. Gong, and D. Towsley, “Code red worm propagation modeling and analysis,” in Proceedings of the 9th ACM conference on Computer and communications security. ACM, 2002, pp. 138–147.
- [6] M. Rajab, L. Ballard, N. Jagpal, P. Mavrommatis, D. Nojiri, N. Provos, and L. Schmidt, “Trends in circumventing web-malware detection,” Google, Tech. Rep., Jul. 2011, http://static.googleusercontent.com/external_content/untrusted_dlcp/res%earch.google.com/en/us/archive/papers/rajab-2011a.pdf.
- [7] U. Parasites, “Practical guide to dealing with google’s malware warnings,” http://www.unmaskparasites.com/malware-warning-guide/.
- [8] L. A. Adamic and B. A. Huberman, “Power-law distribution of the world wide web,” Science, vol. 287, p. 2115, 2000.
- [9] A. Clauset, C. Shalizi, and M. Newman, “Power-law distributions in empirical data,” Arxiv preprint arxiv:0706.1062, 2007.
- [10] M. Meiss, B. Gonçalves, J. Ramasco, A. Flammini, and F. Menczer, “Modeling traffic on the web graph,” in Algorithms and Models for the Web-Graph, ser. Lecture Notes in Computer Science, R. Kumar and D. Sivakumar, Eds. Springer Berlin / Heidelberg, 2010, vol. 6516, pp. 50–61.
- [11] J. Voit, The statistical mechanics of financial markets. Springer Verlag, 2005.
- [12] B. Gnedenko, A. Kolmogorov, K. Chung, and J. Doob, Limit distributions for sums of independent random variables. Addison-Wesley Reading, MA:, 1968, vol. 195.
- [13] I. Zaliapin, Y. Kagan, and F. Schoenberg, “Approximating the distribution of pareto sums,” Pure and Applied Geophysics, vol. 162, no. 6, pp. 1187–1228, 2005.
- [14] A. Moshchuk, T. Bragin, S. D. Gribble, and H. M. Levy, “A crawler-based study of spyware in the web,” in NDSS, 2006.
- [15] Y.-M. Wang, D. Beck, X. Jiang, R. Roussev, C. Verbowski, S. Chen, and S. T. King, “Automated web patrol with strider honeymonkeys: Finding web sites that exploit browser vulnerabilities,” in NDSS, 2006.
- [16] L. Lu, V. Yegneswaran, P. Porras, and W. Lee, “Blade: An attack-agnostic approach for preventing drive-by malware infection,” Proceedings of the 17th ACM Conference on Computer and Communications Security, 2010.
- [17] M. Cova, C. Kruegel, and G. Vigna, “Detection and analysis of drive-by-download attacks and malicious javascript code,” in Proc. WWW ’10, 2010, pp. 281–290. [Online]. Available: http://doi.acm.org/10.1145/1772690.1772720
- [18] C. Curtsinger, B. Livshits, B. Zorgn, and C. Seifert, “ZOZZLE: Fast and precise in-browser javascript malware detection,” in Proc. 20th USENIX Security Symp., Aug. 2011.
- [19] J. John, F. Yu, Y. Xie, M. Abadi, and A. Krishnamurthy, “deSEO: Combating search-result poisoning,” in Proc. USENIX Security Symp. 2011, San Francisco, CA, 2011.
- [20] A. Somayaji and S. Forrest, “Automated response using system-call delays,” in In Proceedings of the 9th USENIX Security Symposium, 2000, pp. 185–197.
- [21] M. M. Williamson, “Throttling viruses: Restricting propagation to defeat malicous mobile code,” in Proc. ACSAC ’02, Las Vegas, Nevada, Dec. 2002.
- [22] HP, “Immunity manager,” Website, http://www.hp.com/rnd/ pdfs/ProCurve_Network_Immunity_Manager1_0.pdf.
- [23] A. Hess, M. Jung, and G. Schfer, “Fidran: A flexible intrusion detection and response framework for active networks,” in ISCC ’03, 2003.
- [24] C. Wong, S. Bielski, A. Studer, and C. Wang, “On the effectiveness of rate limiting mechanisms,” in Proc. RAID ’05, 2005.
- [25] J. Karlin, J. Rexford, and S. Forrest, “Pretty good bgp: Improving bgp by cautiously adopting routes,” in Proc. CNP ’06, 2006.
- [26] A. Ghosh and A. Schwartzbard, “A study in using neural networks for anomaly and misuse detection,” in Proc. USENIX Security Symp., 1999.
- [27] S. Hofmeyr, T. Moore, B. Edwards, S. Forrest, and G. Stelle, “Modeling Internet-scale policies for cleaning up malware,” in Proc. 10th Workshop on the Economics of Information Security, 2011.
- [28] K. Levchenko, N. Chachra, B. Enright, M. Felegyhazi, C. Grier, T. Halvorson, C. Kanich, C. Kreibich, H. Liu, D. McCoy, A. Pitsillidis, N. Weaver, V. Paxson, G. Voelker, and S. Savage, “Click trajectories: End-to-end analysis of the spam value chain,” in Proc. IEEE Sym. and Security and Privacy, Oakland, CA, 2011.
- [29] H. Liu, K. Levchenko, M. Félegyházi, C. Kreibich, G. Maier, G. M. Voelker, and S. Savage, “On the effects of registrar-level intervention,” in Proc. USENIX Workshop on Large-scale Exploits and Emergent Threats (LEET), Boston, MA, March 2011.
- [30] J. Balthrop, S. Forrest, M. E. J. Newman, and M. M. Williamson, “Technological networks and the spread of computer viruses,” Science, vol. 304, no. 5670, pp. 527–529, 2004. [Online]. Available: http://www.sciencemag.org/content/304/5670/527.short
- [31] J. Erasmus, “Compromised ftp details being exploited by in the wild malware,” Jun. 2009, http://www.prevx.com/blog/132/Compromised-FTP-details-being-exploited-b%y-in-the-wild-malware.html.
- [32] S. A. Krashakov, A. B. Teslyuk, and L. N. Shchur, “On the universality of rank distributions of website popularity,” Comput. Netw., vol. 50, pp. 1769–1780, August 2006. [Online]. Available: http://portal.acm.org/citation.cfm?id=1167648.1167655