Electromagnetic Transition Strengths in Heavy Nuclei
Abstract
We calculate reduced B(E2) and B(M1) electromagnetic transition strengths within and between K-bands in support of a recently proposed model for the structure of heavy nuclei. Previously, only spectra and a rough indication of the largest B(E2) strengths were reported. The present more detailed calculations should aid the experimental identification of the predicted , and bands and, in particular, act to confirm or refute the suggestion that the model and bands correspond to the well known and widespread beta and gamma bands. Furthermore they pinpoint transitions which can indicate the presence of a so far elusive band by feeding relatively strongly into or out of it. Some of these transitions may already have been measured in 230Th, 232Th and 238U.
pacs:
21.10.Re, 21.60.Ev, 21.60.Gx, and 27.90.+bI Introduction
We have recently proposed a model for excited states of heavy nuclei involving the coupling of a excitation to a rotor [BMP_Spectrum] . An important characteristic of this model is the generation of excited , and K-bands, at similar excitation energies, as a generic feature. Such triplets of K-bands, have been seen in the light nuclei 160 [BBR_O16] , 24Mg [BMH_Mg24] and 40Ca [Ca40] , and there is no obvious reason why they should not also occur in heavier rare-Earth and Actinide nuclei.
It is difficult to make a conclusive identification of the three predicted K-bands from the calculated excitation energies alone. Their precise ordering depends on the details of the cluster-core interaction and the excitation energy of the core state. If that interaction is overwhelmingly a quadrupole-quadrupole coupling, with model parameters appropriate to the Actinide region, then our previous calculation [BMP_Spectrum] has the bands, in order of increasing excitation energy above the ground state band, as , then and finally . However, even if we restrict ourselves to this simplest form, we are unable to predict the absolute values of the bandhead excitation energies with any confidence because we do not know the true strength of the non-central part of the cluster-core interaction.
Since beta and gamma bands are a generic feature of the spectra of heavy nuclei, at about 1 MeV above the ground state, we have chosen our interaction strength so as to place the excited K-bands in this region. The value required to do this is not particularly large and indicates an intermediate strength, rather than a truly strong coupling regime. Nevertheless, the suggestion that our calculated and bands might be identifiable with the beta and gamma bands needs to be confirmed or refuted.
An obvious form of confirmation would be that an accompanying band should be detected in the same region of excitation energies as the other two. Tell tale signs of such a band would include the discovery of a state (the bandhead) and also pairs of odd-J states (members of the proposed and bands) at similar excitation energies. However, as pointed out previously [BMP_Spectrum] , the population of the bandhead is likely to be experimentally difficult. In addition, the intermediate strength interaction leads us to predict a staggering of the energies of the states in the band, which would make it unclear that they belong in a common band from casual comparison of their excitation energies, even if they were successfully populated. (This feature of staggering is common to the bands of 160 [BBR_O16] , 24Mg [BMH_Mg24] and 40Ca [Ca40] , as well as to the band of 238U [U238a] ; [U238b] .) Hence, additional information such as predicted electromagnetic transition strengths within and between the proposed band members is needed to enable experimental groups to recognise the states of the band if they do succeed in exciting them.
Here, we seek to improve on our previous rough indications of where strong E2 transitions should be expected by calculating in-band and cross-band reduced B(E2) and B(M1) transition strengths for the ground and excited , and K-bands in far greater detail. We cannot provide a definitive and unambiguous account of the E2 and M1 transitions because not only does their direction depend on the details of the ordering of the states in the spectrum, but also the wave functions are sensitive to how close in energy the states they represent lie. Subject to these provisos, this paper presents a detailed account of the calculated E2 and M1 transition strengths appropriate to the states generated previously [BMP_Spectrum] which should be of considerable assistance to experimental groups searching for the predicted triplet of K-bands.
Theoretical studies of positive parity bands in the Actinide nuclei including calculation of some electromagnetic transition rates (but generally only in-band rather than cross-band) have also been presented within the cranked RPA [Neergard] ; [Vogel] ; [Ward] ; [Kuliev] , the collective model [Minkov1] ; [Minkov2] ; [Raduta] , the interacting boson approximation [Zamfir] ; [Cottle] , the variable moment of inertia model [Lenis] and the alpha particle cluster model [Schneidman] .
In the next Section we briefly outline the structure model leading to the generation of K-bands. Then, we calculate reduced B(E2) and B(M1) electromagnetic transition strengths within and between these K-bands. Insofar as possible, we compare our calculated B(E2) strengths with experimental values for some isotopes of Th and U. Finally we summarize our conclusions.
II Cluster model to generate K-bands
We model a nucleus (,) as a core (,) and a cluster (,) interacting via a deep, local potential consisting of nuclear and Coulomb terms and , respectively, where is the separation of their centres. We parametrise the nuclear term as [univ] :
| (1) |
and take to represent a cluster point charge interacting with a uniformly charged spherical core of radius . If the cluster and core were both restricted to their ground states a single band of states would be produced by solving the Schrödinger equation with this potential for a fixed value of the global quantum number ( the number of internal nodes in the radial wave function and the orbital angular momentum). The value of must be chosen large enough to satisfy the major requirements of the Pauli exclusion principle by excluding the cluster nucleons from states occupied by the core nucleons. This can be achieved in the Actinide region by taking . This programme leads to a band of states and excitation energies .
The situation becomes a little more complicated if we accept the possibility of the core being in either its ground state or an excited state having spin-parity (we restrict attention to excitations here) and excitation energy . The cluster-core potential may now contain non-central terms and the system must be described in terms of coupled basis states formed by combining the core spin with the relative orbital angular momentum to obtain a total angular momentum . The simplest form of non-central potential compatible with considerations of time reversal and parity invariance is a quadrupole-quadrupole interaction. The matrix elements of such a non-central potential between our coupled basis states are
| (2) |
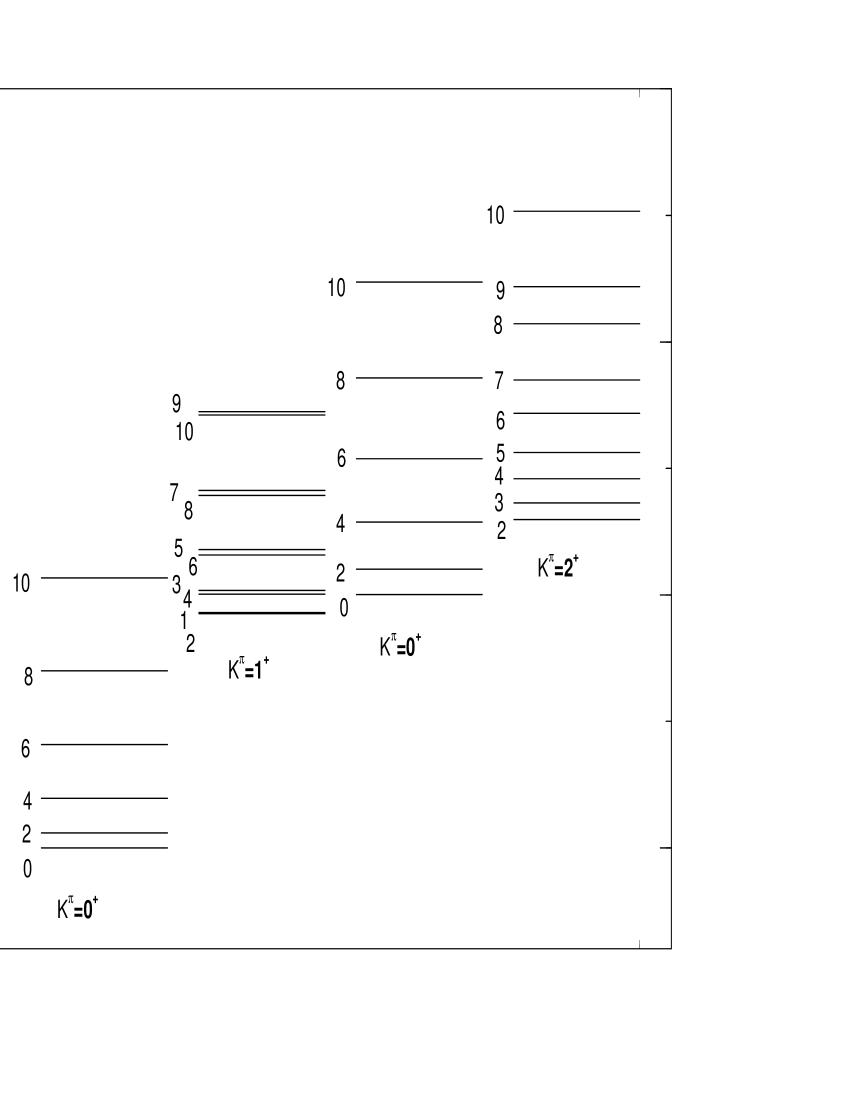
where etc. By combining these with the diagonal elements of the cluster-core rotational motion, simplified to , and the core excitation energy, zero for and for , and assuming that all the radial integrals can be parametrised by a single strength we can obtain eigenvalues and eigenvectors by diagonalization of low-dimensional matrices. Figure 1 shows the spectrum resulting from such a calculation using the parameters of Ref.[BMP_Spectrum] , where more details of the calculation are given.
III Calculation of electromagnetic transition strengths
We calculate reduced B(E2) and B(M1) electromagnetic transition strengths appropriate to the spectrum shown in Fig.1. The general features of these results are expected to be common to all those nuclei for which the triplet of K-bands produced by coupling a excitation to a rotor is an appropriate description of part of the spectrum. There should be strong in-band E2 transitions (typically a few hundred Weisskopf units in the Actinide region), related to one another rather closely by Clebsch-Gordan coefficients, and usually much weaker cross-band E2 transitions of typically a few Weisskopf units (although there turn out to be a few interesting exceptions to this general statement).
Magnetic dipole transitions are possible between some of the levels due to mixing of the relative motion -values (e.g. the states are a mixture of while the states contain mixtures of as well as ) which allow a transition to take place between certain components of these states without changing or . These B(M1) strengths should be rather small, typically 0.01 Weisskopf units, but the simple existence of such transitions between and states, where E2 transitions are impossible, can provide a strong indication of our proposed band structure.
The precise details of the transition rates will vary from nucleus to nucleus. Accidental near-degeneracy of excited states in a particular nucleus can lead to exceptionally large mixing with accompanying strong E2 transition strengths. It must also be borne in mind that any given real nucleus may have some of the predicted levels in a different order from those exhibited in Fig.1 so that the transitions go in the opposite direction. Indeed, the excited bandhead ordering may differ from that shown in Fig.1. Even then, our results can still be useful because it is straightforward to transform the calculated strength for into a corresponding value for on multiplication by .
To maintain generality as far as possible we give the calculated B(E2) transition strengths as ratios to the value for B(E2; ) in the ground state band. However, we give the B(M1) strength estimates directly in Weisskopf units because they only depend on the Z/A ratios (which are all very similar in the Actinide region) with the appropriate Weisskopf unit independent of the charge and mass of the nucleus in question.
III.1 Reduced B(E2) strengths
In the limit of strong coupling there would be no cross-band E2 transitions at all, and the in-band transitions would be given by (see for example Ref.[Leander] )
| (3) |
where is the constant intrinsic electric quadrupole transition strength. We have checked that by increasing the strength of our quadrupole-quadrupole interaction to very large values this situation does indeed emerge from our calculation. Even with a much reduced interaction strength, Eq.(3) still provides a reasonable zeroth order approximation to the calculated in-band reduced E2 transition strengths, as can be seen from Table 1. The stretched E2 transitions between states with differing by 2 are uniformly strong and much more prominent than most of the transitions between states whose values differ by 1. This simple distinction does not hold at low spins where many states lie close together in energy and consequently their wave functions are thoroughly mixed. There we see equally strong and transitions within the band and , and transitions in the band. The general pattern of strong and much weaker transitions reasserts itself at higher values of as state mixing gradually decreases and individual states become more widely separated in energy.
In view of the staggering of energy levels predicted for the band, this general preference for stretched E2 transitions could easily lead to the perception that the band consists of two separate bands with angular momentum sequences and such that their common origin is not apparent. See also Fig.3 of Ref.[BMP_Spectrum] .
| Transition | ||||
|---|---|---|---|---|
| 1.00 | 0.60 | |||
| 1.43 | 0.93 | 1.06 | 0.38 | |
| 1.58 | 1.09 | 1.22 | 0.74 | |
| 1.67 | 1.14 | 1.30 | 0.92 | |
| 1.72 | 1.15 | 1.34 | 1.03 | |
| Transition | Transition | |||
| 1.45 | 1.21 | |||
| 0.22 | 0.83 | |||
| 0.80 | 0.70 | |||
| 0.63 | 0.64 | |||
| 0.07 | 0.37 | |||
| 1.25 | 0.42 | |||
| 0.27 | 0.89 | |||
| 0.02 | 0.18 | |||
| 1.39 | 0.29 | |||
| 0.17 | 1.03 | |||
| 0.01 | 0.10 | |||
| 1.45 | ||||
| 0.12 | ||||
In general, the E2 transitions in our model are produced by a sum of three terms. One is due to intrinsic excitations of the core, another is due to intrinsic excitations of the cluster and the third is due to the relative motion of cluster about core. Since we restrict the cluster to its ground state there is no contribution from intrinsic cluster excitations and the electromagnetic operator reduces to
| (4) |
where is a core internal coordinate and the cluster core separation, and and are the relevant charge factors, with . We follow the convention of Brink and Satchler [BS] in defining reduced matrix elements of rank tensor operators through the Wigner-Eckart theorem by
| (5) |
so that we have to modify Eq.(3C-17) of Ref.[BM_E2] and write the reduced transition strengths as
| (6) |
and the corresponding Weisskopf unit is [BM_WU]
| (7) |
To keep our results as general as possible we need to avoid explicit dependence on charge and mass values. To this end we note that in 208Pb, a typical core for our model, the B(E2 ) from the excited state at 4.08524 MeV to the ground state is measured as Wu. The strengths of the corresponding E2 transitions in our parent nuclei are of order 200–300 Wu (which we model as a combination of intrinsic core and relative motion contributions). We use this information to estimate the relative strengths of the orbital and core excitation terms in the operator. This is sufficient because we are not concerned with the absolute values of the B(E2) strengths, and intend to calculate them only as ratios to the strength of the ground state band transition. If we write , then we can estimate by fitting to a ratio of a mid mass range Actinide B(E2) value and the 208Pb B(E2) value which, on ignoring the niceties of angular momentum coupling, yields
| (8) |
We therefore expect relative coefficients of the corresponding terms in the M(E2) matrix elements to be roughly in the ratio , which is to say roughly between 4:1 and 5:1. In view of this, we use an operator
| (9) |
and present our results in Tables 1 and 2 as ratios to the strength of the transition in the ground state band.
Table 1 shows our results for in-band E2 transitions. Stretched E2 transitions are all strong and due principally to the relative motion term in the operator. Their values are not generally far from the expectations of the rotational model given in Eq.(3), despite the strength of our quadrupole-quadrupole interaction being so weak that only intermediate strength coupling is produced. Therefore, the measurement of in-band stretched E2 transitions will not distinguish between the two models to any convincing degree. The weaker values between states with differing by less than 2 can largely be attributed to angular momentum coupling effects (i.e. Clebsch-Gordan coefficients).
On the other hand, our predictions for the cross-band E2, transitions shown in Table 2, are very different from the strong-coupling rotational model according to which they should all be zero. It is interesting to note that if we had only included the relative motion term in the operator, we would have obtained very weak cross-band transitions and so reached an indistinguishable conclusion, despite not having attained a truly strong coupling limit. However, the presence of the core excitation term in gives rise to small, but nevertheless significant cross-band E2 transition strengths — a few hundreths of those seen for the in-band cases. These strengths typically amount to a few Wu and should be experimentally measurable. We also note that in a few cases, where the state mixing is especially favourable, there are some transitions between the excited and bands whose strengths are about one tenth (or even larger) than characteristic in-band values. These cross-band features differ substantially from the expectations of the strong-coupling rotational model and thus distinguish our model from it. At present, the experimental data in the Actinide region (which we examine later) are too sparse to draw any firm conclusion. However, similar effects are expected in the rare-Earth region, and we hope to turn our attention to some of those nuclei in due course.
| Transition | |||||||
|---|---|---|---|---|---|---|---|
| 0.0533 | 0.6878 | ||||||
| 0.0299 | 0.0002 | 0.0076 | 0.0166 | ||||
| 0.0479 | |||||||
| 0.2301 | 0.0019 | ||||||
| 0.0143 | 0.0060 | 0.0184 | 0.0154 | 0.0051 | 0.0841 | ||
| 0.1898 | 0.0000 | ||||||
| 0.0022 | 0.0471 | 0.0070 | 0.0027 | 0.0029 | 0.0129 | ||
| 0.0032 | |||||||
| 0.0179 | 0.0125 | 0.0051 | 0.0253 | ||||
| 0.0007 | |||||||
| 0.0288 | 0.0132 | 0.0116 | 0.0975 | ||||
| 0.0021 | |||||||
| 0.0354 | 0.0000 | 0.0010 | 0.0026 | 0.0054 | 0.0045 | ||
| 0.0776 | 0.0001 | ||||||
| 0.0065 | 0.0118 | 0.0013 | 0.0140 | 0.0084 | 0.0934 | ||
| 0.0737 | 0.0017 | ||||||
| 0.0010 | 0.0399 | 0.0001 | 0.0108 | 0.0108 | |||
| 0.0038 | |||||||
| 0.0232 | 0.0075 | 0.0047 | 0.0012 | ||||
| 0.0002 | |||||||
| 0.0217 | 0.0185 | 0.0183 | 0.1461 | ||||
| 0.0071 | |||||||
| 0.0334 | 0.0001 | 0.0000 | 0.0012 | 0.0026 | 0.0240 | 0.0156 | |
| 0.0389 | 0.0001 | ||||||
| 0.0045 | 0.0180 | 0.0081 | 0.0085 | 0.0059 | 0.0683 | ||
| 0.0295 | 0.0039 | ||||||
| 0.0007 | 0.0292 | 0.0001 | 0.0212 | 0.0192 | |||
| 0.0029 | |||||||
| 0.0250 | 0.0047 | 0.0032 | 0.0031 | ||||
| 0.0001 | |||||||
| 0.0178 | 0.0213 | 0.0220 | |||||
| 0.0131 | |||||||
| 0.0293 | 0.0001 | 0.0002 | 0.0006 | 0.0012 | 0.0216 | 0.0057 | |
| 0.0242 | 0.0001 | 0.1330 | |||||
| 0.0035 | 0.0217 | 0.0134 | 0.0045 | 0.0033 | 0.0381 | ||
| 0.0115 | 0.0042 | ||||||
| 0.0006 | 0.0206 | 0.0000 | 0.0288 | 0.0261 | |||
| 0.0020 | |||||||
| 0.0249 | 0.0031 | 0.0022 | 0.0097 | ||||
| 0.0000 | |||||||
| 0.0156 | 0.0223 | 0.0246 | |||||
| 0.0241 | 0.0001 | 0.0003 | 0.0003 | 0.0006 | 0.0106 | 0.0006 | |
| 0.0170 | 0.0001 | 0.1219 | |||||
| 0.0029 | 0.0228 | 0.0168 | 0.0022 | 0.0018 | 0.0200 |
III.2 Reduced B(M1) strengths
In principle, magnetic dipole transitions in our model are mediated by contributions from the cluster-core relative motion and also from the magnetic dipole moments of the cluster and core. Since the cluster remains in its ground state there is no contribution from this to the M1 transition rates. Furthermore, we intend to take the magnetic dipole moment of the excited core state as zero as well (its ground state is unable to make any contribution). This is mainly a matter of expediency since we do not have sufficient information to make any other choice. Very few state magnetic dipole moments have been measured in the 208Pb region [Stone] . However, one of the few that has is for the state in 206Pb at keV which has a measured value of nm [Stone] , which tends to support our proposed assignment of zero. One other piece of evidence in support of a negligible value is provided by our ability to describe the magnetic dipole moment of the lowest lying state of 224Ra with the simplest form of our model. This means taking the state as a 210Pb core in its ground state orbited by a 14C cluster with relative orbital angular momentum . The magnetic dipole moment is then given by
| (10) |
which for and reduces to
| (11) |
For 224Ra treated as 210Pb + 14C this yields a numerical value of 0.852 nm, which compares favourably with the measured value of nm [Stone] .
Using the relative motion term alone leads to a magnetic dipole operator in our model of
| (12) |
To avoid explicit use of charge and mass values we use an average value appropriate to 208Pb + 14C, 20O, 24Ne and 28Mg of 0.42 for the charge-mass dependent factor above. Thus
| (13) |
The Weisskopf unit in these same units is [BM_WU] .
Table 3 shows our results for B(M1) reduced transition strengths between states in the spectrum of Fig.1 with values differing by 1 or 0. The values are only meant to be indicative of typical strengths, subject to the same provisos mentioned in discussing the E2 transitions, that the level ordering might be different from that illustrated, and accidental near-degeneracies can give rise to strong mixing which results in fortuitously strong predicted transitions. The calculated values are generally rather small, scarcely exceeding 0.01 Wu. Their possible importance lies in the existence of transitions between the heads of the and bands, which could not be mediated by gamma rays of any other multipolarity.
| Transition | |||||||
|---|---|---|---|---|---|---|---|
| 0.1028 | |||||||
| 0.0084 | |||||||
| 0.0022 | |||||||
| 0.0045 | 0.0271 | ||||||
| 0.0052 | 0.0023 | 0.0064 | 0.0001 | 0.0124 | 0.0112 | ||
| 0.0480 | 0.0042 | ||||||
| 0.0066 | 0.0001 | 0.0118 | 0.0081 | ||||
| 0.0217 | |||||||
| 0.0067 | 0.0001 | 0.0033 | 0.0122 | ||||
| 0.0069 | 0.0106 | ||||||
| 0.0112 | 0.0023 | 0.0007 | 0.0005 | 0.0111 | 0.0256 | ||
| 0.0466 | 0.0055 | ||||||
| 0.0058 | 0.0002 | 0.0050 | 0.0049 | ||||
| 0.0196 | |||||||
| 0.0079 | 0.0002 | 0.0034 | 0.0287 | ||||
| 0.0072 | 0.0040 | ||||||
| 0.0123 | 0.0018 | 0.0000 | 0.0009 | 0.0080 | 0.0267 | ||
| 0.0508 | 0.0029 | ||||||
| 0.0052 | 0.0002 | 0.0028 | 0.0014 | ||||
| 0.0158 | |||||||
| 0.0091 | 0.0003 | 0.0031 | |||||
| 0.0061 | 0.0014 | 0.0371 | |||||
| 0.0139 | 0.0012 | 0.0003 | 0.0012 | 0.0057 | 0.0193 | ||
| 0.0542 | 0.0011 | ||||||
| 0.0048 | 0.0003 | 0.0018 | 0.0001 | ||||
| 0.0124 | |||||||
| 0.0106 | 0.0004 | 0.0027 | |||||
| 0.0047 | 0.0005 | 0.0453 | |||||
| 0.0159 | 0.0009 | 0.0005 | 0.0014 | 0.0043 | 0.0124 |
IV Comparison with existing data
On examining the even-even Actinide nuclei for experimental B(E2) transitions involving any states other than those within the ground state band, we have found surprisingly few measurements [NNDC] . Only the four nuclei 230Th, 232Th, 234U and 238U can act as present testing grounds for our model. We defer discussion of 238U until later becauses its structure is so complicated, and concentrate initially on the first three of these nuclei.
| B(E2) | B(E2) | |||
| Exp | Theo | |||
| Wu | Wu | |||
| 230Th | ||||
| (677.515) | (174.111) | 10(4) | 9.2 | |
| (677.515) | (0.0) | 2.7(9) | 0.04 | |
| (781.375) | (174.111) | 0.37(14) | 0.53 | |
| (781.375) | (53.227) | 5.5(18) | 3.0 | |
| (781.375) | (0.0) | 2.9(9) | 1.5 | |
| (1009.601) | (677.515) | 3.6 | ||
| (1009.601) | (174.111) | 0.43 | ||
| (1009.601) | (53.227) | 2.8 | ||
| (1009.601) | (0.0) | 5.9 | ||
| 232Th | ||||
| (774.15) | (162.12) | 9.2 | ||
| (774.15) | (49.369) | 1.2 | ||
| (774.15) | (0.0) | 2.8(12) | 0.04 | |
| (785.25) | (162.12) | 0.53 | ||
| (785.25) | (49.369) | 7.2(7) | 3.0 | |
| (785.25) | (0.0) | 2.9(4) | 1.5 | |
| (1387.1) | (162.12) | 0.51(18) | 0.44 | |
| (1413.8) | (829.6) | 3.8 | ||
| (1413.8) | (785.25) | 23(7) | 1.9 | |
| 234U | ||||
| (809.907) | (43.4981) | 1.3 | ||
| (851.74) | (143.352) | 11.1 | ||
| (851.74) | (43.4981) | 1.4 | ||
| (851.74) | (0.0) | 0.05 | ||
| (926.720) | (143.352) | 0.28(5) | 0.64 | |
| (926.720) | (43.4981) | 4.9(8) | 3.6 | |
| (926.720) | (0.0) | 2.9(5) | 1.8 | |
Table 4 compares the measured cross-band B(E2) strengths with our calculated values, in Wu. In each case we accept the evaluators’ identifications of beta and gamma bands. We identify the former with our band and the latter with our band. This allows us to compare the measured values for transitions from these bands to the ground state band with our corresponding calculated transition strengths. More interesting, is the observation that in 230Th and 232Th there are other transitions, not emanating from the beta or gamma bands, which feed into the other labelled bands, for which measured B(E2) strengths are available. In the table we tentatively identify these gamma rays as coming from states in our predicted band. We thus include a comparison of the strengths calculated for these putative transitions with the otherwise unassigned experimental values.
Overall, we then obtain quite a good description of all the cross-band transitions in these three nuclei for which measured B(E2) strengths are available. Agreement is generally rather good, although we have to admit that our values for decays from the state of the beta band to the ground state are generally too small (although the measured values come with rather large uncertainties). Given the generality of our calculation due to the uncertainties surrounding its input parameters we feel that this is a highly satisfactory first step.
The experimental situation for 238U is much less transparent. Lifetimes have been measured for nine separate states in this nucleus. The Nuclear Data Centre evaluation [NDS_238] labels these as follows: (44.916) is a member of the ground state band, (966.13) and (1037.25) are members of two distinct beta bands, (1060.27) is the head of a gamma band, and the remaining five states at excitation energies of 1223.78, 1278.54, 1414.0, 1530.2 and 1782.3 keV are all seen in Coulomb excitation and assigned through angular distribution analysis.
| B(E2) | B(E2) | |||
|---|---|---|---|---|
| Exp | Theo | |||
| Wu | Wu | |||
| 238U | ||||
| (966.13) | (148.38) | 3.3(14) | 13.2 | |
| (966.13) | (44.916) | 1.1(4) | 1.7 | |
| (966.13) | (0.0) | 0.38(16) | 0.05 | |
| (1037.25) | (148.38) | 2.28(23) | 0.63 | |
| (1037.25) | (44.916) | 1.23(14) | 4.0 | |
| (1037.25) | (0.0) | 1.47(16) | 8.4 | |
| (1060.27) | (148.38) | 0.33(3) | 0.75 | |
| (1060.27) | (44.916) | 5.3(4) | 4.3 | |
| (1060.27) | (0.0) | 3.04(18) | 2.1 | |
| (1223.78) | (966.13) | 32 | ||
| (1223.78) | (927.21) | 27 | ||
| (1223.78) | (148.38) | 0.017 | ||
| (1223.78) | (0.0) | 0.29 | ||
| (1278.54) | (148.38) | 0.29(3) | ||
| (1278.54) | (44.916) | 0.37(5) | ||
| (1278.54) | (0.0) | 0.098(9) | ||
| (1414.0) | (1060.27) | 36 | ||
| (1414.0) | (0.0) | 0.125 | ||
| (1530.2) | (966.13) | 55 | ||
| (1530.2) | (148.38) | 3.57(43) | ||
| (1530.2) | (0.0) | 0.240(24) | ||
| (1782.3) | (44.916) | 0.57(6) | ||
| (1782.3) | (0.0) | 0.41(4) | ||
The allocation of two separate beta bands worries us and probably warrants further investigation. There appear to be associated band heads at 927.21 and 997.23 keV for these proposed beta bands, although this latter state’s value is based on an E0 transition to the ground state. However, we also note that there is a state at 1105.71 keV (assigned to the gamma band) and a () state at 1059.66 keV. The appearance of two states, close in energy, is a signature of our three excited K-band model, with the two states belonging to the excited and bands. We therefore compare the measured reduced E2 transition strengths to our calculated ones by accepting the evaluator’s identification of the ground state band, the gamma band and the lower of the two beta bands (i.e. the one based on a band head at 927.21 and containing the (966.13) state). We treat the decays from the (1037.25) state as if that state were a member of our band. This interpretation places the ordering of the experimental bands as and . Since this differs from the ordering in our generic spectrum, shown in Fig.1, we expect that our calculation would need some fine-tuning to yield a good description of 238U.
Nevertheless, Table 5 compares the experimental cross-band reduced E2 strengths with the values calculated for our “typical” Actinide nucleus. The level of agreement for transition strengths into the ground state band from the beta and gamma bands is good, but our calculated values from the proposed band are too large by a factor 3–6. This is about as good as we could expect without fitting the model parameters specifically to 238U properties.
We leave the higher states in abeyance for the present time. Our model could accommodate (many) higher lying states if we introduced a cluster excitation in addition to the core excitation. In fact, this cluster excitation could combine with the core excitation to form a total excitation “spin” value of , 1, 2, 3 or 4 with associated K-bands running from K=0 to in each case. Indeed, this extra excitation would introduce several extra beta bands. In this context it is worth bearing in mind that a multiplicity of beta bands can be produced by a microscopic particle-hole description of the excitations of the system. This point has been successfully made by Chasman in his studies of 232,234,236U [Chasman] , and his conclusions are likely to hold across all nuclei discussed in the present paper.
V Conclusion
Consideration of a structure model where a cluster rotates around a core having a ground state and an excited state, leads to a spectrum containing a ground state band and three excited bands having and . These features are observed in light nuclei such as 16O [BBR_O16] , 24Mg [BMH_Mg24] and 40Ca [Ca40] , and there is no obvious reason why they should not be replicated in heavier nuclei.
We are unable to predict the energies of the excited bandheads but are tempted to identify the excited and bands with the widespread beta and gamma bands. We therefore choose the free parameters of our model to place the excited bands in the vicinity of the beta and gamma bands in Actinide nuclei. This gives the generic spectrum for heavy nuclei shown in Fig.1, although we accept that the details, and even the precise band orderings, could change with moderate fine-tuning of the model parameters.
The band has not been widely seen in heavy nuclei, although Tables 4 and 5 tentatively indicate its presence in 230Th, 232Th and 238U. However, our model suggests that it ought to be a feature common to many more heavy nuclei. The irregularly spaced state energies emerging from our intermediate strength coupling calculation for this band indicate that it will be a difficult task to identify it on the basis of state excitation energies alone. To this end, we have presented a calculation of the reduced E2 and M1 electromagnetic transition strengths between the states of the spectrum of Fig.1. Of course, only the gross features and not the details should be sought in any particular nucleus, since the B(E2) and B(M1) strengths will probably be even more sensitive to fine-tuning of the model parameters than the spectrum. Nevertheless, these transition rate predictions differ sufficiently from those of the strong coupling limit of the standard collective rotational model [Leander] ; [Rowe] that they suggest a realistic possibility of identifying the elusive band and differentiating between that model and our own.
The in-band E2 transitions of both models are very similar, and related to each other by angular momentum coupling coefficients. The cross-band E2 transitions are very different. A combination of state mixing due to our intermediate strength non-central interaction and the effects of including a excited core lead to small but measurable cross-band transitions of typically a few Wu in our model. These transitions are absent from the strong coupling limit of the rotational model. We also predict small M1 transitions of typically a few hundredths of a Wu. The significance of the M1 transitions is mainly that they allow the presence of gamma rays connecting the and bandheads, where otherwise there would be nothing.
Our examination of the existing data in the Actinide nuclei is tantalising but not conclusive. The first comment we make is that there are surprisingly few well measured cross-band E2 transition strengths in these nuclei. Despite this, there are some indications of the cross band E2 electromagnetic transitions predicted by our model in 230Th, 232Th, 234U and 238U. We have considered all reported B(E2) strengths in these four nuclei. In three of them there are certainly excited states, not accommodated in beta and gamma bands, that decay into the ground state band with strengths of a few Wu, in line with our model expectations. We also give a reasonable description of cross-band E2 transitions from the beta and gamma bands in all four nuclei. The only blemish being that the predicted decays from the state of the beta band to the ground state are generally too small.
In the near future we hope to apply our model in the rare-Earth region, where qualitatively similar results are expected. We also urge our experimental colleagues to reexamine existing data and initiate new experiments to improve the overall level of spectroscopy in the Actinide region and, in particular, to verify or deny the existence of the proposed band which is a key distinguishing characteristic of our model.
Acknowledgements: S.M.P. would like to thank the National Research Foundation of S.A. and the University of Cape Town, for financial support.
References
- (1) B.Buck, A.C.Merchant and S.M.Perez, Phys. Rev. C84 034310 (2011)
- (2) R.A.Baldock, B.Buck and J.A.Rubio, Nucl. Phys. A426 222 (1984)
- (3) B.Buck, P.J.B.Hopkins and A.C.Merchant, Nucl. Phys. A513 75 (1990)
- (4) A.C.Merchant, Phys. Rev. C37 414 (1988)
- (5) B.Buck, A.C.Merchant and S.M.Perez J. Phys. G: Nucl. Part. Phys. 35 085101 (2008)
- (6) B.Buck, A.C.Merchant and S.M.Perez, T.T.Ibrahim and S.M.Wyngaardt, J. Phys. G: Nucl. Part. Phys. 36 085101 (2009)
- (7) K.Neergård and P.Vogel, Nucl. Phys. A149 217 (1971)
- (8) P. Vogel, Phys. Lett. B60 431 (1976)
- (9) D.Ward et al. Nucl. Phys. A600 88 (1996)
- (10) A.A.Kuliev, E.Gugliev, F.Ertugral and S.Özkan, Eur. Phys. Jour. A43 313 (2010)
- (11) N.Minkov, S.Drenska, P.Yotov and W.Scheid, Phys. Atomic Nuclei, 67 1760 (2004)
- (12) N.Minkov, P.Yotov, S.Drenska and W.Scheid, J. Phys. G: Nucl. Part. Phys. 32 497 (2006)
- (13) A.A.Raduta and C.M.Raduta, Nucl. Phys. A768 170 (2006)
- (14) N.V.Zamfir and D.Kusnezov, Phys. Rev. C67 014305 (2003)
- (15) P.D.Cottle and N.V.Zamfir, Phys. Rev. C58 1500 (1998)
- (16) D.Lenis and D.Bonatsos, Phys. Lett. B633 474 (2006)
- (17) T.Schneidman, G.G.Adamian, N.V.Antonenko, R.V.Jolos and W.Scheid, Phys. Lett. B526 322 (2002)
- (18) B.Buck, A.C.Merchant and S.M.Perez, Nucl. Phys. A614 129 (1997)
- (19) G.A.Leander, W.Nazarewicz, G.F.Bertsch and J.Dudek, Nucl. Phys. A453 58 (1986)
- (20) D.M.Brink and G.R.Satchler, Angular Momentum 3rd Ed. (OUP, Oxford, 1993) p. 57
- (21) A.Bohr and B.R.Mottelson, Nuclear Structure Vol 1 (Benjamin, New York, 1969) p.382
- (22) A.Bohr and B.R.Mottelson, Nuclear Structure Vol 1 (Benjamin, New York, 1969) p.389
- (23) N.J.Stone, Atomic Data and Nuclear Data Tables, 90 75 (2005)
- (24) Brookhaven National Nuclear Data Centre at http://www.nndc.bnl.gov/ensdf
- (25) Y.A.Akovali, Nuclear Data Sheets 69 155 (1993)
- (26) E.Browne, Nuclear Data Sheets 107 2579 (2006)
- (27) E.Browne, Nuclear Data Sheets 108 681 (2007)
- (28) F.W.Chukreev, V.E.Makarenko and M.J.Martin, Nuclear Data Sheets 97 129 (2002)
- (29) D.J.Rowe, Nuclear Collective Motion, (Methuen, London, 1970), p.73
- (30) R.R.Chasman, Phys. Rev. Lett. 42 630 (1979)