Microwave Quasi-periodic Pulsation with Millisecond Bursts in A Solar Flare on 2011 August 9
Abstract
An peculiar microwave quasi-periodic pulsation (QPP) accompanying with a hard X-ray (HXR) QPP of about 20 s duration occurred just before the maximum of an X6.9 solar flare on 2011 August 9. The most interesting is that the microwave QPP is consisting of millisecond timescale superfine structures. Each microwave QPP pulse is made up of clusters of millisecond spike bursts or narrow band type III bursts. There are three different frequency drift rates: global frequency drift rate of microwave QPP pulse group, frequency drift rate of microwave QPP pulse, and frequency drift rate of individual millisecond spikes or type III bursts. The physical analysis indicates that the energetic electrons accelerating from a large-scale highly dynamic magnetic reconnecting current sheet above the flaring loop propagate downwards, impact on the flaring plasma loop, and produce HXR bursts. The tearing-mode (TM) oscillations in the current sheet modulate HXR emission and generate HXR QPP; the energetic electrons propagating downwards produce Langmuir turbulence and plasma waves, result in plasma emission. The modulation of TM oscillation on the plasma emission in the current-carrying plasma loop may generate microwave QPP. The TM instability produces magnetic islands in the loop. Each X-point will be a small reconnection site and accelerate the ambient electrons. These accelerated electrons impact on the ambient plasma and trigger the millisecond spike clusters or the group of type III bursts. Possibly each millisecond spike burst or type III burst is one of the elementary burst (EB). Large numbers of such EB clusters form an intense flaring microwave burst.
1 Introduction
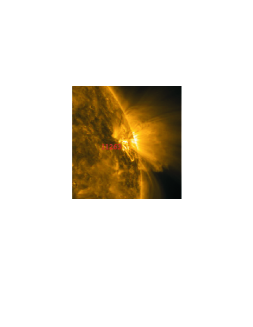
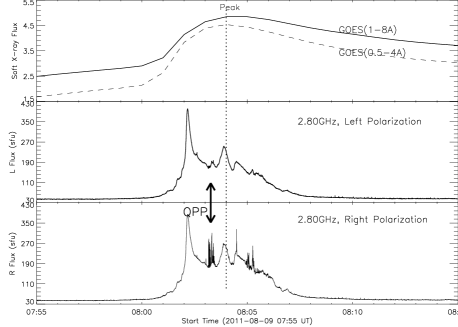
On 2011 August 9, a most powerful X6.9 solar flare took place in active region NOAA 11263, near west limb on the solar disk (left panel of Figure 1, observed at EUV wavelength of 171Å by Atmospheric Imaging Assembly on Solar Dynamics Observatory (AIA/SDO)). The X6.9 flare event starts at 08:00 UT, reaches to the maximum at 08:04 UT, and ends at 08:14 UT (the top-right panel in Figure 1). It is the largest one in the current solar Schwabe cycle, resulting in a coronal mass ejection. Accompanied with this flare, an strongly microwave burst (right panels of Figure 1) was observed at a frequency of 2.60 - 3.80 GHz by the Chinese Solar Broadband Radio Spectrometer in Huairou (SBRS/Huairou). The microwave burst starts at 08:01 UT, ends at 08:07 UT, lasts for only about 6 minutes. As a comparison, we know that the microwave burst associated with other X-class flare event always has a long-duration of several tens of minutes or 1 - 2 hours, for example, the X3.4 flare event on 2006 December 13 has a duration of 110 minutes (Tan et al. 2010). In the peculiar short duration of microwave burst in the X6.9 flare event, the most prominent feature is the quasi-periodic pulsation (QPP) and its accompanied superfine structures of millisecond timescales. The main task of this work is to investigate the peculiar features of the microwave QPP in detail and its related physical processes.
It is well known that the flare-related QPP, especially at the microwave frequency range, can be a valuable diagnostic tool for in situ conditions in the flaring source region, and the investigations can obtain unique insight into the coronal plasma dynamic processes. For example, the duration of a QPP can be a measure of the plasma density inhomogeneity in the source region, and the periodicity can be a measure of the diameter or width of the inhomogeneity, and so on (Roberts et al. 1984). Many people studied the features and physical mechanism from observations and theoretical models (Young et al. 1961, Gotwols 1972, Fu et al. 1990, Kliem et al. 2000, Nakariakov et al. 2003, Tan et al. 2007, etc.). Aschwanden (1987) presented an extensive review of QPP models and classified them into three groups: (1) MHD oscillations modulate the microwave emissivity with standing or propagating waves (Roberts et al. 1984, Nakariakov & Melnikov 2009), (2) periodic self-organizing systems of plasma instability, and (3) the periodic particle accelerations. Different kind of model can explain different timescale QPP. Recently, a series of microwave QPPs with multi-timescale and forming a broad hierarchy are also reported and proposed that different timescales of QPP may have different generation mechanisms. The broad hierarchy of timescales of QPP that occurred in a same flare event may imply that there is a multi-scale hierarchy of sizes of the magnetic configurations and the timescales of the dynamic magnetic reconnection processes in the flaring region (Tan et al. 2010).
On the spectrogram of broadband microwave observations, the QPP behaves as a train of approximated vertical bright stripes with almost equidistance. Each bright stripe is a QPP pulse. Generally, the previous works regarded the pulse as a relatively isolated element. So far, there is very rare work to investigate if there are some further superfine structures in each QPP pulse. Chernov et al. (2008) reported a flare event of which some pulses of the weakly rapid microwave QPP were completely consisting of several small-scale narrow band drifting millisecond fibers, and the frequency drift rate of the fibers were in the range of from -160 MHz s-1 to -270 MHz s-1. In this work, we find that each individual pulse of the rapid microwave QPP is made up of clusters of millisecond spike bursts or narrow band type III bursts with frequency drift rates of about 20 GHz s-1. We will introduce the peculiar features of the superfine structures in the QPP in Section 2, and make a physical analysis in Section 3. Finally, some conclusions are obtained in Section 4.
2 Observations and Data Analysis
2.1 Observational Data and Analysis Method
In this work, we mainly apply the microwave observations obtained from SBRS/Huairou to investigate the detailed peculiar features of the microwave QPP. SBRS/Huairou is an advanced solar radio telescope with super high cadence, broad frequency bandwidth, and high frequency resolution, which can distinguish the super fine structures of microwave bursts from the spectrogram (Fu et al. 1995, 2004, Yan et al. 2002). It includes 3 parts: 1.10 - 2.06 GHz (with the antenna diameter of 7.0 m, cadence of 5 ms, frequency resolution of 4 MHz), 2.60 - 3.80 GHz (with the antenna diameter of 3.2 m, cadence of 8 ms, frequency resolution of 10 MHz), and 5.20 - 7.60 GHz (share the same antenna of the second part, cadence of 5 ms, frequency resolution of 20 MHz). The antenna points to the center of solar disk automatically controlled by a computer. The spectrometer can receive the total flux of solar radio emission with dual circular polarization (left- and right-handed circular polarization), and the dynamic range is 10 dB above quiet solar background emission. And the observation sensitivity is: , here is the standard flux value of the quiet Sun. From the Solar Geophysical Data (SGD) we can obtain the data at frequencies of 1415 MHz, 2695 MHz, 2800 MHz, and 4995 MHz, and make the calibration of the observational data followed the method reported by Tanaka et al. (1973). As for the strong burst, the receiver may work beyond its linear range and a nonlinear calibration method will be used instead (Yan et al. 2002).
Similar to other congeneric instruments, such as Phoenix (100 - 4000 MHz, Benz et al. 1991), Ondŕejov (800 - 4500 MHz, Jiricka et al. 1993) and Brazilian Broadband Spectrometer (BBS, 200 - 2500 MHz, Sawant et al. 2001), SBRS/Huairou has no spatial resolution. However, as the Sun is a strong radio emission source, a great deal of works (e.g. Dulk 1985, etc.) show that the microwave bursts received by spectrometers are always coming from the solar active region when the antenna points to the Sun.
In order to make the QPP clearer and more reliable, we adopt the analysis methods which is described in detail by Tan et al. (2010). With this method, we can obtain the related parameters of the microwave QPP easily, such as the period, duration, polarization degree, the global frequency drifting rates (GFDR), and the single-pulse frequency drifting rates (SPFDR), etc. These parameters are explained by Tan (2008). Because of the close relationships between the hard X-ray (HXR) emission and the microwave bursts (Dennis 1988), we also adopt the HXR observations obtained by the Reuven Ramaty High Energy Solar Spectroscopic Imaging (RHESSI) to make a complementary comparison.
2.2 Observational Results
During the X6.9 flare, SBRS/Huairou obtained high-quality observations at a frequency of 2.60 - 3.80 GHz. The right panels of Figure 1 present the profiles of the microwave flux at a frequency of 2.80 GHz with left- and right-handed circular polarization around the flaring event. As a comparison, the profiles of GOES soft X-ray (SXR) intensities at wavelengths of 1 - 8 Å(GOES8) and 0.5 - 4 Å(GOES4) are also plotted in Figure 1. Here, we find that the main part of the microwave burst occurred in the flare rising and peak phase, and decay rapidly after the flare peak. The microwave intensity profile has two obvious enhancements, the first one is at about 08:02:04 UT, the second one is at about 08:03:56 UT. A obvious QPP occurred in 08:03:09 - 08:03:30 UT, just in the midst of the two enhancements (marked with thick bidirectional arrow in the right panel of Figure 1), very closed to the maximum of the SXR GOES flare (08:04 UT).
The careful scrutinizing of the RHESSI HXR observations displays that HXR emission are also existing QPP features at energy of 12 - 100 keV. The wavelet analysis indicates the evidence of HXR QPP is most obvious at energy of 25 - 50 keV. Figure 2 presents the light curve of HXR at energy of 25 - 50 keV during the microwave QPP occurrence, which shows that the intensity of HXR emission also has an obvious feature of QPP, and the average period is about 2.46 s, which belongs to short period pulsation (SPP).

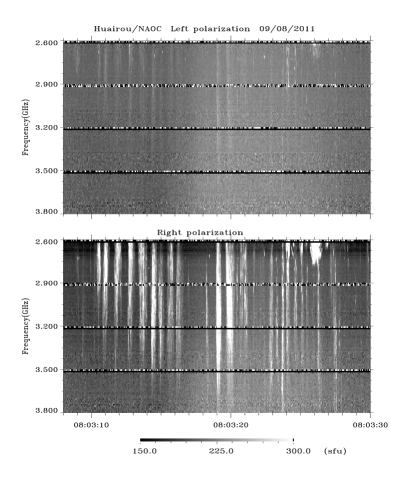
Figure 3 presents the microwave QPP observed at a frequency of 2.60 - 3.80 GHz by SBRS/Huairou. The top-left panels show the spectrogram of the QPP at left- and right-handed circular polarization, and the QPP behaves as a series of bright pulses, which indicates that the QPP can be divided into three different pulse groups: the first pulse group begins at 08:03:09 UT, ends at 08:03:17 UT, lasts for 8 s (marked as group A); the second begins at 08:03:18, ends at 08:03:22 UT, lasts for 4 s (marked as group B); and the third begins at 08:03:23, ends at 08:03:29 UT, and lasts for 6 s (marked as group C). The frequency bandwidth of each pulses is in the range of 400 - 1100 MHz. The comparison between the left- and right-handed circular polarizations show that the QPP is strongly right-handed circular polarized with the polarization degree of about 70%. The measurement of the time intervals between each adjacent vertical bright stripe indicate that the period of the QPP are about 0.70s, 0.86s, and 0.42s at the first, second, and third pulse group, respectively. All of them are belong to broad bandwidth very short-period pulsation (VSP) (Wang & Xie 2000, Tan et al. 2007). The comparison between the microwave and HXR, we find that the period of the microwave QPP is much shorter than that of the HXR QPP. The top-right panels of Figure 3 show the profiles of the flux intensities of the microwave QPP at left- and right-handed circular polarization at a frequency of 2.84 GHz (above and middle panel). It indicates that the emission enhancement at each QPP pulse respect to the background emission is about 100 - 250 sfu, which demonstrates that the QPP is very obvious and strong.
The arranged patterns of microwave QPP pulse groups indicate that there are frequency drifts in each pulse group (GFDR). In order to obtain the frequency drift rate, we define the central frequency of each pulse at its central time as follows:
| (1) |
Here, the central time of the pulse is when the flux intensity approaches to the maximum around the pulse. is the frequency, and is the corresponding flux intensity which subtract the background emission around the occurrence of the microwave QPP. The below of the top-right panel of Figure 3 presents the distribution of the central frequency () at each QPP pulse. The dotted lines are fitted by linear square-least methods. In QPP group A, the central frequency of QPP pulses can be fitted by a single line, the slopes of the fitted lines gives the average GFDR as: 53.3 MHz s-1. In QPP group B, the central frequency of QPP pulses also can be fitted by a single line with GFDR as -78.9 MHz s-1. In QPP group C, the central frequency of QPP pulses decreases slowly at the first half with GFDR of -98.2 MHz s-1, and then turns to increase slowly with GFDR of 129.5 MHz s-1 at the second half. It seems that there are some dynamic processes occurred in the emission source region.
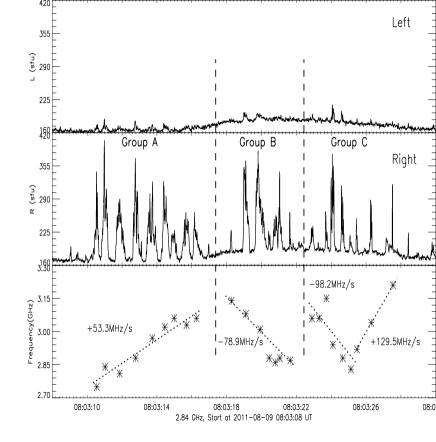
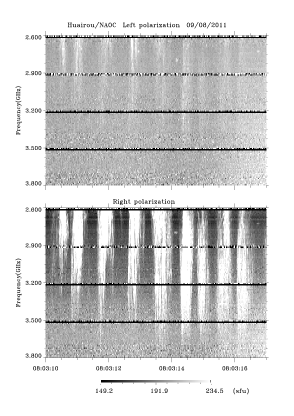
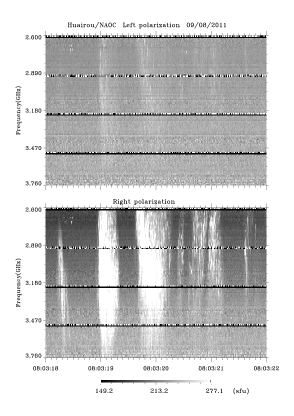
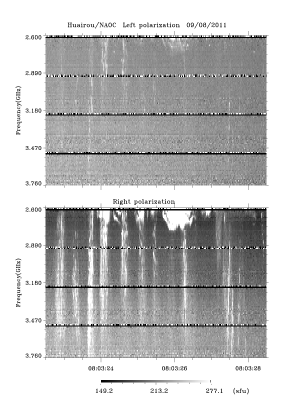
The bottom panels of Figure 3 present the expanded spectrograms of QPP pulse group A (left), B (middle), and C(right), at left- and right-handed circular polarization, respectively, which can present the details of the superfine structures on each QPP pulse. With a careful scrutinizing, we find that the frequency drifts are also occurred at each QPP pulse (SPFDR). We apply the similar method as described in Tan et al. (2010) to determine the SPFDR. The top-left panel of Figure 4 presents examples of the method, the SPFDR can be calculated by the slope rate of the fitted lines. The top-right panel of Figure 4 plots the calculated results of the SPFDR in the whole QPP. Here, we find that all of the SPFDRs of QPP pulse group A are negative, and their absolute values are in the range of 3.51 - 13.84 GHz s-1, the average value is 7.73 GHz s-1. However, the SPFDRs in QPP pulse group B and C are rapidly changed from negative to positive, and the absolute values are from 4.38 GHz s-1 to 14.61 GHz s-1 in group B and 2.91 GHz s-1 to 26.25 GHz s-1 in group C, the average value is about 7.78 GHz s-1 in group B and 15.88 GHz s-1 in group C. Additionally, almost all of the SPFDRs are at least two orders higher than that of GFDR in the QPP pulse groups.


At the same time, the careful scrutinizing on each individual QPP pulse presents another important feature: each pulse has a superfine structures in shorter time scales. The expanded spectrograms (the bottom panels of Figure 3) present the details of the millisecond superfine structures in each QPP pulses. Here we find that almost all of the microwave QPP pulses are structured with clusters of millisecond spike bursts. The bandwidth of the spike bursts is in the range of 20 - 60 MHz, the duration is in the range of 8 - 24 ms (however, being restricted by the 8 ms cadence of the telescope, we can not know if there are any spike bursts with duration shorter than 8 ms. In fact, some spike bursts are only observed by a single data point, this evidence is enough to let us believe that some spike bursts may have a life-time shorter than 8 ms), the flux intensity is in the range of 50 - 100 sfu, and the polarization degree is closed to 100% (bottom-left panel of Figure 4). Additionally, part of the millisecond spikes show the obvious evidence of fast negative frequency drifting rate with value of from -18 GHz s-1 to -25 GHz s-1, and the average is -20 GHz s-1.
The bottom-right panel of Figure 4 is the expanded profile at a frequency of 3.23 GHz of a QPP pulse which shows that the QPP pulse is structured with a cluster of type III bursts. The type III bursts form a drifting pulsating structure (DPS) with local GFDR of about 2.91 GHz s-1, the pulsating period of about 0.16 s. As for each individual type III burst, the instantaneous duration is about 8 - 24 ms, frequency bandwidth is about 500 - 1000 MHz, the polarization degree is above 85%, the frequency drift rate is in the range of from -14.58 GHz s-1 to -20 GHz s-1, and the average value is about -17.30 GHz s-1.
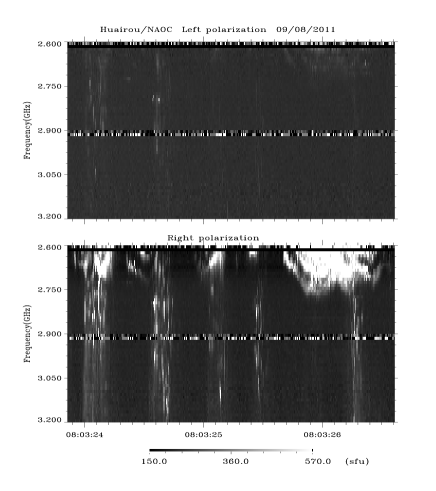
From the bottom-right panel of Figure 3, several segments of strong zebra pattern (ZP) structures can be found at frequency of 2.60 - 2.75 GHz at 08:03:24 - 08:03:27 UT accompanying with the microwave QPP pulses. Three zebra stripes can be seen in the extended spectrogram in Figure 5 around 08:03:26 UT, the flux intensities on individual stripe are degressive from the low frequency to high frequency (about 1100 - 1300 sfu on the low frequency stripe, 700 - 1000 sfu on the middle stripe, and 200 - 600 sfu on the high frequency stripe above the adjacent background emission). It is strong right-handed circular polarization. The frequency separation between the adjacent zebra stripes is about 70 - 100 MHz. Generally, the ZP structure is always regarded as one of the most important microwave fine structure which can be used to diagnose the magnetic field strength in the coronal source regions (Zlotnik 2009, Chernov 2010). Adopting the similar method of magnetic field estimation from ZP structure with double plasma resonance model in the same frequency range of the work of Tan et al. (2012), we may obtain the magnetic field strength in the coronal source region of the ZP structure is about 147 - 210 G, and the averaged value is about 178 G.
In brief, the RHESSI HXR observation at energy of 25 - 50 keV implies a HXR QPP existence with period of 2.46 s. At the same time, the microwave observation at frequency of 2.60 - 3.80 GHz indicates the occurrence of a much fast QPP with average period of 0.705s. Each pulse of the microwave QPP is structured with clusters of spikes or type III bursts in millisecond timescales. All of them are strongly right-handed circular polarization; and there are three distinct different frequency drifting rates:
(1) GFDR of microwave QPP pulse group: in several decades of MHz s-1, positive or negative;
(2) SPFDR of microwave QPP pulse: in several or more than 10 GHz s-1, positive or negative;
(3) SPFDR of millisecobd spike bursts or type III bursts: around 20 GHz s-1, negative.
3 Physical Discussions
What physical implications hinted in the millisecond superfine structures of each individual microwave QPP pulse? and how do we understand the three distinct different kinds of frequency drift rates?
At first, we need to determine the mechanism of the QPP. Here we are only interested in the HXR QPP with period of 2 - 3 s and the microwave VSP with period of subsecond. It is well known that propagating MHD oscillation modes or the standing fast sausage mode in dense magnetic traps may produce the QPP with period of the above values (Roberts et al. 1984, Aschwanden 1987, Tan et al. 2010). Zaitsev et al. (1984) demonstrated that the variation of plasma density in a magnetic loop by fast magnetosonic waves excited by energetic protons in Cherenkov or bounce resonance might produce QPP with period of seconds. Zaitsev et al. (1998, 2000) proposed another model of which a current-carrying plasma loop should be a LRC-circuit resonator, which might cause periodic modulation of the loop magnetic field, energy release rate, and energetic electron production, therefore, the microwave emission, and the corresponding period should be dependent on the longitudinal electric current (, is the longitudinal electric current in the loop). In order to produce the VSP in this work, the longitudinal electric current in the loop should be in the range of (1.16 - 2.38) A. Such value is very popular in a general flaring plasma loop (Gary & Demoulin 1995, Tan 2007, etc.). It seems that the above models are the possible candidates for the QPP with periods in this work. However, these models seem to be a bit of difficult to explain the frequency drifting rates and the superfine structures with clusters of millisecond spike bursts or type III bursts. Here, we need a model which can explain the properties including the rapid QPP and the superfine spiky structures.
Kliem et al. (2000) and Karlicky et al. (2004) proposed that microwave QPP can be caused by quasi-periodic particle acceleration from a highly dynamic regime of magnetic reconnection in an extended large-scale current sheet above the flaring loop. The reconnection is dominated by repeated formation and subsequent coalescence of magnetic islands, known as secondary tearing modes. This model can explain the QPP with period of 0.5 - 5 s in solar flares. In particular, they may explain the global frequency drifting rate of QPP as a motion of the plasmoid in the density gradient of the solar atmosphere. Here, particles are accelerated near the magnetic X-points in the DC electric field associated with magnetic reconnection. The strongest electric fields occur at the main magnetic X-points adjacent to the plasmoid, and a large fraction of the accelerated particles may only be temporarily trapped in the plasmoid; the accelerated process itself may form an anisotropic velocity distribution, which may excite the microwave emission. Based on particle-in-cell simulation, Karlicky & Barta (2007) found that electrons are accelerated most efficiently in the region near the X-point of the magnetic configuration at the end of the tearing process and the beginning of plasmoid coalescence. The most energetic electrons are localized along mainly the X-lines of the magnetic configuration. During these process, plasma emission generated and propagated.
Tan et al. (2007) proposed that modulations of the resistive tearing-mode (TM) oscillations in electric current-carrying flaring plasma loops can also produce VSP with sub-second periods. The duration of the VSP is dominated by the current density distribution, magnetic configuration and plasma resistivity, as well as the period of VSP is dominated by the total electric current, the loop’s geometrical parameters, and the distribution of current density in the cross-section of the loop. The pulsating emission is localized in some regions with small size, for example, localized around magnetic islands in flaring plasma loops. From the bandwidth of the emission we may estimate the perturbation of the plasma density. The frequency drifting rate can reflect the motion of the plasma loop and the energetic particles. Combining all these observable parameters, we may probe many physical conditions and their evolutions.
As for the mechanism of the millisecond spike bursts or narrow-band type III bursts, Benz (1986) proposed that decimeter narrow band millisecond spikes are coherent emission as a signature of electron acceleration in flare, and the flare energy release must be fragmented with each spike indicating a single energy release episode in the smallest time and space scale originated from magnetic reconnection sites (Huang & Nakajima 2005, Wang et al. 2008). Fleishman & Melnikov (1999) made a detailed comparison of the observed spike properties with various theoretical models, and found that the electron cyclotron maser emission (ECME) driven by nonthermal electrons can explain almost all the observed properties. Fleishman et al. (2003) proposed that the source of spike cluster should be a coronal loop filled by fast electrons and relatively tenuous background plasma. Each spike is generated by ECME in a local small source inside the loop. ECME takes place only when the following conditions satisfied (Melrose & Dulk 1982):
| (2) |
and
| (3) |
Here, is the emission frequency, is the electron gyro-frequency, is the electron plasma frequency, is the harmonic number, is the Lorentz factor of the energetic electrons, and are the parallel components of the wave number and particle velocity, respectively. Equation 3 implies that the source region of ECME must have a relatively strong magnetic field. Because of the accompanying of ZP and microwave QPP structures, we may suppose that their source regions are close to each other, and the magnetic field strengths are also similar to each other. However, the estimation of ZP structures indicates that the magnetic field strength is about 147 - 210 G, and the corresponding gyrofrequency is about 412 - 588 MHz, which is much lower than the observed frequency ( 3.00 GHz). This fact implies that ECME seems not to be the formation mechanism of the millisecond spiky bursts observed in this work.
It is well known that there is another kind of coherent emission: plasma emission, which is always generated from the coupling of two excited plasma waves with frequency of about 2 and weakly polarizations, or the coupling of an excited plasma wave and a low-frequency electrostatic wave with frequency of about and strongly polarizations (Zheleznyakov & Zlotnik 1975, Chernov et al. 2003). Generally, the plasma emission is triggered by some Langmuir turbulence produced from nonthermal energetic electrons.
Combining the above analysis, we may plot qualitatively the physical processes associated with the QPP as in Figure 6:
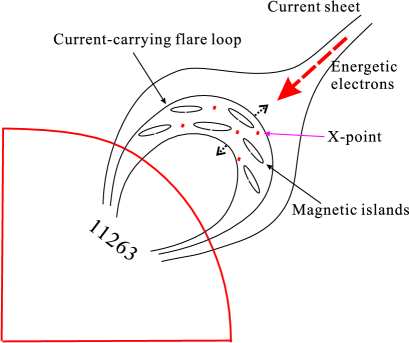
(1) From the idea of Kliem et al. (2000), we may propose that the energetic electrons accelerating from a highly dynamic magnetic reconnection in an extended large-scale current sheet above the flaring loop propagate downwards, interact with the plasma in the flaring loop, and produce HXR bursts by bremsstrahlung mechanism. The TM oscillation in the current sheet may modulate the HXR emission and form the HXR QPP (the big red arrow in Figure 6);
(2) The energetic electrons propagating downwards may impact on the flaring loop and trigger Langmuir turbulence and plasma waves in the loop. The coupling between the plasma wave and the low frequency electrostatic wave emits the microwave radiation by the mechanism of plasma emission. From the idea of Tan et al. (2007), the modulation of the TM oscillation in the current-carrying plasma loop may lead to the formation of microwave QPP. As the frequency of plasma emission depends on the plasma density, the motion of the flaring loop with respect to the background may change the plasma density, and result in the frequency drifting rate of the microwave QPP pulse groups. The motion of the energetic electron beam with respect to the background result in the frequency drifting rate of the QPP pulses. From the mechanism of plasma emission, the GFDR of QPP pulse group is due to the motion of the plasma loop (Aschwanden & Benz 1986):
| (4) |
Here, is the scale length of the density inhomogeneity in the ambient plasma of the loop, is the velocity of the loop’s motion, and is the angle between the line-of-sight and magnetic field line. Generally, we may assume km, and . Substitute the GFDR of QPP group into Equation (4), we may obtain the velocity of the loop is about 550 km s-1 upwards in group A, 526 km s-1 downwards in group B, and from 655 km s-1 downwards to 863 km s-1 upwards in group C.
In Equation (4), if we replace the by the velocity of the energetic electron beams (), then we may obtain the SPFDR of QPP pulse. Substitute the values of SPFDR of QPP pulses into Equation (4), we obtain the velocity of the energetic electron beams as about km s-1. And the corresponding kinetic energy of the energetic electrons is about 1.07 - 86.7 keV.
(3) The TM instability cause the formation of many magnetic islands in the current-carrying plasma loop. Each X-point between the adjacent magnetic islands will be a small reconnection site and make a secondary acceleration on the ambient electrons (Drake et al. 2006). These accelerated electrons impact on the adjacent plasmas around the X-point, trigger the Langmuir turbulence and plasma waves, produce microwave bursts by plasma mechanism. Such microwave bursts are just the spikes or type III bursts. As there are many magnetic X-points in the current-carrying plasma loop, each X-point will be a small reconnection site, and the region around each X-point will be a source of a spike burst or type III burst. As a result, the spike bursts or the type III bursts can arise in huge clusters. Because from X-point to the space between two adjacent rational surfaces the plasma density always has a negative gradient (Furth et al 1973, Drake et al. 2006), so the frequency drifting rates of spike bursts or type III bursts are negative. Because the scale length of the density inhomogeneity () around the X-point is shorter than that in the ambient plasma of the loop, from Equation (4) we may conclude that the frequency drifting rates of spike bursts or type III bursts are higher than that of the microwave QPP pulses.
4 Conclusions
Based on the above observations and physical analysis, we may come to the following conclusions:
(1) Just before the flare maximum, there are HXR QPP and microwave QPP with durations of about 20 s. The HXR QPP belongs to a SPP, and the microwave QPP belongs to a VSP. Each individual microwave QPP pulse is structured with clusters of millisecond bursts, most of the millisecond bursts are cluster of spike bursts, and the rest are type III bursts. There are three distinct different frequency drifting rates: GFDR of microwave QPP pulse group, SPFDR of microwave QPP pulse, SPFDR of millisecond spike bursts or narrow band type III bursts.
(2) The physical processes associated with the QPP can be described as: the energetic electrons accelerating from a highly dynamic magnetic reconnection in an extended large-scale current sheet above the flaring loop propagate downwards, interact with the plasma of the flaring loop, and produce HXR bursts by bremsstrahlung mechanism. The TM oscillation in the current sheet may modulate the HXR emission and form HXR QPP; the energetic electrons propagating downwards may produce Langmuir turbulence and plasma waves in the loop, trigger the plasma emission. The modulation of the TM oscillations in the current-carrying plasma loop may lead to formation of microwave QPP. The TM instability cause the formation of magnetic islands in the current-carrying plasma loop. Each magnetic X-point between the adjacent two magnetic islands will be a small reconnection site and make a secondary acceleration on the ambient electrons. These accelerated electrons may impact on the ambient plasma and trigger the millisecond spike clusters or the group of type III burst by plasma mechanism.
(3) Each magnetic X-point is an energy releasing site in the current-carrying plasma loop, and possibly each millisecond spike burst or type III burst is one of the elementary burst (EB). Large numbers of EB clusters form an intense flaring microwave burst.
(4) We may apply the above conclusions to analyze the conditions of the source regions, e.g. the GFDR of microwave QPP pulse group can be adopted to estimate the motion of the flaring loop, the SPFDR of microwave QPP pulse can be adopted to estimate the velocity of the energetic electrons and the corresponding energies, and the SPFDR of millisecond spike bursts or type III bursts can be applied to estimate the density inhomogeneity () around the X-point in the flaring plasma loops.
However, as we are lack of imaging observations with spatial resolutions in the corresponding frequency range, there are many unresolved problems of the QPPs, for example, the spatial behaviors, the spatial scales of the source region, etc. To overcome these problems, some new instruments are needed, for example, the constructing Chinese Spectral Radioheliograph (CSRH, 0.4 - 15 GHz) in the decimetric to centimeter-wave range (Yan et al, 2009) and the proposed American Frequency Agile Solar Radiotelescope (FASR, 50 MHz - 20 GHz) (Bastian, 2003). Maybe, when these instruments begin to work, we will get more and more cognitions of the solar activities.
References
- Aschwanden (1986) Aschwanden, M.J., & Benz, A.O.: 1986, Astron. Astrophys. 158, 102.
- Aschwanden (1987) Aschwanden, M.J. 1987, Sol. Phys., 111, 113
- Bastian (2003) Bastian, T.: 2003, Proc. SPIE. 4583, 98.
- Benz (1986) Benz, A. O., 1986, Solar Phys., 104, 99
- Benz et al (1991) Benz, A.O., Gudel, M., Isliker, H., Miszkowicz, S. & Stehling, W., 1991, Solar Phys., 133, 385.
- Chernov (2003) Chernov, G. P., Yan, Y.H., & Fu, Q.J., 2003, Astron. Astrophys., 406, 1071
- Chernov (2008) Chernov, G. P., Yan, Y.H., Fu, Q.J., Tan, C.M., & Wang, S.J., 2008, Solar Phys., 250, 115
- Chernov (2010) Chernov, G. P., 2010, Res. Astron. Astrophys., 10, 821
- Dennis (1988) Dennis, B. R., 1988, Solar Phys., 118, 49
- Drake (2006) Drake, J.F., Che, H., & Shay, M.A. 2006, Nature, 443, 553
- Dulk (1985) Dulk, G. A., 1985, Ann. Rev. Astron. Astrophys., 23, 169
- Fleishman (1999) Fleishman, G.D. & Melnikov V.F., 1999, Proc. 9th European Meeting on Solar Phys., 1247
- Fleishman (2003) Fleishman, G.D., Gary, D.E., & Nita, G.M. 2003, ApJ, 593, 571
- Fu (1990) Fu, Q.J., Gong, Y.F, Jin, S.Z., & Zhao, R.Y.: 1990, Solar Phys. 130, 161.
- Fu (1995) Fu, Q.J., Qin, Z.H., Ji, H.R., & et al, 1995, Solar Phys., 160, 97
- Fu (2004) Fu, Q.J., Ji, H.R., Qin, Z.H. & et al., 2004, Sol. Phys., 222, 167
- Furth (1973) Furth, H.P., Rutherford, P.H., & Selberg, H., 1973, Phys. Fluids, 16, 1054
- Gary (1995) Gary, D.E., & Demoulin, P. 1995, ApJ, 445, 982
- Gotwols (1972) Gotwols, B.L. 1972, Sol. Phys., 25, 232
- Huang (2005) Huang, G.L., & Nakajima, H., 2005, ApSS, 295, 423
- Jiricka et al (1993) Jiricka, K., Karlicky, M., Kepka, O., & Tlamicha, A.: 1993, Solar Phys. 147, 203.
- Karlicky (2004) Karlicky, M.: 2004, Astron. Astrophys. 417, 325.
- Karlicky (2007) Karlicky, M., & Barta, M.: 2007, Astron. Astrophys. 464, 735.
- Kliem et al (2000) Kliem, B., Karlicky, M., and Benz, A.Q.: 2000, Astron. Astrophys. 360, 715.
- Melrose (1982) Melrose, D.B., & Dulk, G.A. 1982, ApJ, 259, 844
- Nakariakov et al (2003) Nakariakov, V.M., Melnikov, V.F., and Reznikova, V.E.: 2003, Astron. Astrophys. 412, L7.
- Nakariakov (2009) Nakariakov, V.M., & Milnikov, V.F.: 2009, Space Sci. Rev. 149, 119.
- Roberts (1984) Roberts, B., Edwin, P.M., & Benz, A.O. 1984, ApJ, 279, 857
- Sawant (2001) Sawant, H.S., Subramanian, K.R., Faria, C., et al: 2001, Solar Phys., 200, 167.
- Tan (2007) Tan, B.L., Yan, Y.H., Tan, C.M., & Liu, Y.Y., 2007, ApJ, 671, 964
- Tan (2007) Tan, B.L. 2007, Adv. Space Res., 39, 1826
- Tan (2008) Tan, B.L. 2008, Solar Phys., 253, 117
- Tan (2010) Tan, B.L. 2010, ApSS, 325, 251
- Tan et al (2010) Tan, B.L., Zhang, Y., Tan, C.M., & Liu, Y.Y., 2010, ApJ, 723, 25
- Tan et al (2012) Tan, B.L., Yan, Y.H., Tan, C.M., Sych, R., & Gao, G.N., 2012, ApJ, 744, 166
- Tanaka (1973) Tanaka, H., Castelli J.P., Covington A.E., et al: 1973, Solar Phys. 29, 243.
- Wang et al (2008) Wang, S.J, Yan, Y.H., Liu, Y.Y., Fu, Q.J., Tan, B.L., & Zhang, Y.: 2008, Solar Phys. 253, 133.
- Wang & Xie (2000) Wang, M., & Xie, R.X.: 2000, Chin. Astron. Astrophys. 24, 95.
- Yan et al (2002) Yan, Y.H., Tan, C.M., Xu, L., Ji, H.R., Fu, Q.J., & Song, G.X., 2002, Sci. Chin. A Suppl., 45, 89.
- Yan et al (2009) Yan, Y.H., Zhang, J., Wang, W., Liu, F., Chen, Z.J., & Ji, G.S.: 2009, Earth. Moon. Planet 104, 97.
- Young (1961) Young, C.W., Spencer, C.L., Moreton, G.E., & Roberts, J.A. 1961, ApJ, 133, 243
- Zaitsev (1984) Zaitsev, V.V., Stepanov, A.V., & Chernov, G.P.: 1984, Sol. Phys. 93, 363.
- Zaitsev (1998) Zaitsev, V.V., Stepanov, A.V., Urpo, S., & Pohjolainen, S.: 1998, Astron. Astrophys. 337, 887.
- Zaitsev (2000) Zaitsev, V.V., Urpo, S., & Stepanov, A.V.: 2000, Astron. Astrophys. 357, 1105.
- Zheleznyakov (1975) Zheleznyakov, V.V., & Zlotnik, E.YA.: 1975, Sol. Phys. 44, 461.
- Zlotnik (2009) Zlotnik E. Ya, 2009, Cent. Eur. Astrophys. Bull., 33, 281