NANTEN 12CO (J=10) observations around the star WR 55
Abstract
Context. A complete study of the molecular and ionized gas in the environs of the nebula RCW 78 around WR 55 is presented.
Aims. The aim of this work is to investigate the spatial distribution, physical characteristics, and kinematical properties of the molecular gas linked to the galactic nebula RCW 78 to achieve a better understanding of its interaction with the star and with the ionized gas.
Methods. This study was based on 12CO(1-0) fully sampled observations of a region of 045 in size around the star WR 55 and the nebula RCW 78 obtained with the 4-m NANTEN telescope, radio continuum archival data at 1.4 and 4.85 GHz, obtained from SGPS and PMNRAO Southern Radio Survey, respectively, and available infrared MIPSGAL images at 24 m.
Results. A molecular gas component in the velocity range from –58 to –45 km s-1 , compatible with the velocity of the ionized gas, was found to be associated with the optical nebula. Adopting a distance of 5 kpc, the mass of this molecular component is about 3.4 104 M⊙. The analysis of the molecular data revealed the presence of a velocity gradient, in agreement with the H line.
New radiocontinuum flux density determinations confirm the thermal nature of RCW 78. This indicates that the ionized gas in RCW 78 arises from photoionization of the molecular gas component in the velocity range from 58 km s-1 to 45 km s-1 .
A molecular concentration at a velocity of 56.1 km s-1 (identified as C1) is very likely associated with the star HD 117797 and with a collection of candidate YSOs, lying at a distance of 3.9 kpc, while the rest of the molecular gas at velocities between –56 and -46 km s-1 constitute an incomplete ring-like structure which expands around WR 55 at a velocity of about 5 km s-1 . Mechanical energy and time requirements indicate that WR 55 is very capable of sustaining the expansion of the nebula.
Key Words.:
ISM: molecules, radio continuum, ISM: Hii regions, Individial object: RCW 78, Stars: WR 55, HD 1177971 Introduction
Wolf-Rayet (WR) stars are the descendants of massive ( 25 M⊙) O-type stars and represent the last evolutionary phase of a massive stellar object prior to its explosion as supernova. WR stars are some of the most powerful sources of ionizing radiation and they have lost a significant portion of their atmospheres through intense winds, which leads to the formation of the well known “WR ring nebulae” (WRRN) (Chu, 1981) and/or “interstellar bubbles” (IB) (Castor et al., 1975; Dyson, 1977; Weaver et al., 1977). WRRN and IBs are consistents with an evolution of an O-type star to the WR phase through a sequence of three stages. Along this evolutionary path, each stage is characterized by a different kind of wind (Garcia-Segura & Mac Low, 1995). During the O phase, the gas around the star is first ionized by the high Lyman continuum flux, giving rise to an Hii region which expands in the surrounding cold neutral medium as a result of its higher pressure. Afterwards, the Hii region is evacuated via powerful stellar winds creating an IB. IBs were succesfully detected mainly in the 21 cm line of atomic hydrogen (Arnal, 1992; Arnal & Cappa, 1996; Cappa et al., 1996; Arnal et al., 1999; Vasquez et al., 2005). When the star becomes a red super giant (RSG), the stellar wind is dense and has a low terminal velocity. Afterwards, the WR phase begins, and their fast wind rapidly reaches and interacts with the previous RSG wind creating a WRRN.
The physics and kinematics of molecular gas around ring nebulae and IBs are issues far from being completely understood. During the expansion of the Hii region, a dense shell of neutral material accumulates between the ionization front (IF) and the shock front (SF), that in an ideal case completely surrounds the Hii region or the IB. In most of the cases studied so far, the molecular gas is interstellar in origin, and shows signs of interaction with the stellar radiation and winds (Rizzo et al., 2001a, b; Cappa et al., 2001; Marston, 2001; Vasquez et al., 2009).
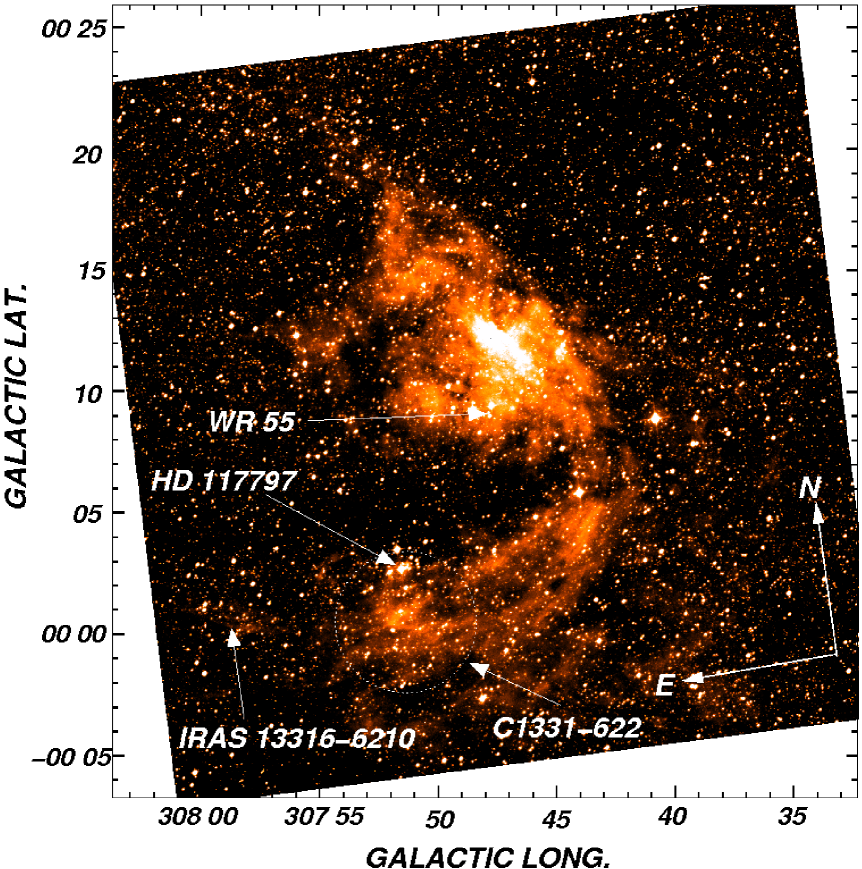
RCW 78 is a WRRN which was first noticed in the catalogue of H emission regions of the Southern Milky Way (Rodgers et al., 1960). The brightest part of this nebula is about 15′ in diameter and is centered on the position of the star HD 117688 (Fig. 1). HD 117688 ( WR 55) is a WN7 star located at (l,b) = (307∘.80, +0∘.160) (van der Hucht, 2001) and the H ring nebula RCW 78 is likely to be associated with this star. About 7′ southeast of WR 55 (in equatorial coordinates) the open cluster C1331-622 is located. This cluster is 7′ in diameter and is 820 pc (Dias et al., 2010) away from the Sun. The O8Ib(f) star (Walborn, 1982) HD 117797, located at (l,b) = (307∘.8593,+0∘.0447), is seen projected onto C1331-622. This star is located at a distance of 3.9 1.0 kpc (Turner & Forbes, 2005) and is unlikely to be related to the open cluster C1331-622. The error in the distance of HD 117797 stems from assuming a cosmic dispersion of 0.5 in absolute magnitude (Walborn, 1972). The location of HD 117797 prevents us from determining whether the intense H emission observed towards lower galactic longitudes is caused by the presence of nebular emission associated with this star or is part of RCW 78. The IRAS source 13316-6210 is situated almost 5′ eastwards from HD 117797.
The distance of WR 55 and its associated nebula is far from being known. On the one hand, several authors quote distances in the range from 4.0 kpc to 5.0 kpc (Georgelin et al., 1988; Cappa et al., 2009), while others authors have determined distances mostly in the range from 5.5 kpc to 7.6 kpc (Chu & Treffers, 1981; Conti & Vacca, 1990; van der Hucht, 2001)
Several spectroscopic studies of RCW 78 were carried out in the past. Chu & Treffers (1981), showed that the H line at the brightest central part of the nebula displays a slight north-south velocity gradient. The velocity of the H line varies from 44 km s-1 (at the position of WR 55) to 53.4 km s-1 ( 7′ northwards of WR 55). These authors claimed that this gradient is the result of an outflow of the ionized gas at the surface of a molecular cloud. They classified RCW 78 as Ra-type nebula (amorphous) since no signs of expansion are found. Spatially resolved spectroscopy was carried out by Esteban et al. (1990). The derived abundances of nitrogen and helium are consistent with a self-enrichment. Later on, Esteban (1993) claimed that photoionization is the main source of excitation of the nebula. 12CO (J = 10) and (J = 21) lines using SEST data and (J = 10) line using NANTEN data were observed towards RCW 78 by Cappa et al. (2009). They found a CO ring-like structure in the velocity range from 52.5 to 43.5 km s-1 which is almost coincident with the brightest western part of the nebula. A second CO structure in the velocity range from 43.5 to 39.5 km s-1 was also detected. The molecular gas in a region 12′ 10′ centered on WR 55 shows similar characteristics in the line velocities to those of the ionized gas (Chu & Treffers, 1981), i.e. larger negative velocities to the north, whilst more positive velocities close to the star. The authors suggest that WR 55 is not only responsible for the ionization at the surface of the molecular cloud, but also for the shape and kinematics of RCW 78. Infrared MSX, IRAS, and GLIMPSE data were also analyzed by these authors. They reported two well separated spots centered at about RA,Dec(J2000) = (13h34m15.0, 62∘26′) (l,b = 307∘52′, 00∘02′) and RA,Dec(J2000) = (13h35m10, 62∘26′) (l,b = 307∘51′, 00∘02′), where a high number of candidate YSOs are found. The positions of these spots are coincident with two bright extended infrared sources observed at 60 m (referred in that work as source B and source C, respectively). They also claim that the expansion caused by WR 55 could have triggered the star formation disclosed by the presence of Young Stellar Objects (YSO) candidates observed in the direction of the molecular gas in the velocity range of to km s-1 .
Given the information above, it is worth further exploring the physical and kinematical characteristics of the molecular gas in RCW 78. Is this nebula simply a non-expanding Hii region? Is WR 55 interacting with the molecular and/or ionized gas of the nebula? How can the velocity gradient observed in the ionized and molecular gas be explained?
In order to perform a thorough study of the distribution of the molecular and ionized gas of RCW 78, as well as their physical and kinematical properties, optimal fully sampled and high velocity resolution 12CO (J = 10) observations covering a region of 25′ 25′ around the star WR 55 were carried out. The molecular observations were analyzed in conjuction with archival data of both radiocontinuum at 1.4 and 4.85 GHz, and H observations to account for the ionized gas. The databases used in this work are outlined in Sect. 2, the results are described in Sect. 3, and the discussion in Sect. 4. Conclusions are presented in Sect. 5. This is the first of a series of papers aimed at studying the characteristics of molecular gas around Wolf-Rayet ring nebulae.
2 Observations and data reduction
The databases used in this work are:
-
1.
Intermediate angular resolution, medium sensitivity, and high-velocity resolution 12CO (J=10) data obtained with the 4-m NANTEN millimeter-wave telescope of Nagoya University. At the time the authors carried out the observations, April 2001, this telescope was installed at Las Campanas Observatory, Chile. The half-power beamwidth and the system temperature, including the atmospheric contribution towards the zenith, were 2′.6 (3.8 pc at 5 kpc) and 220 K (SSB) at 115 GHz, respectively. The data were gathered using the position switching mode. Observations of points devoid of CO emission were interspersed among the program positions. The coordinates of these points were retrieved from a database that was kindly made available to us by the NANTEN staff. The spectrometer used was an acusto-optical with 2048 channels providing a velocity resolution of 0.055 km s-1 . For intensity calibrations, a room-temperature chopper wheel was employed (Penzias & Burrus, 1973). An absolute intensity calibration (Ulich & Haas, 1976; Kutner & Ulich, 1981) was achieved by observing Orion KL (RA(1950.0)=5h 32m 47s.0, Dec (1950.0) = 5∘ 24′ 21′′), and Oph East (RA(1950.0) =16h 29m 20s9, Dec (1950.0) = 24∘ 22′,13′′). The absolute radiation temperatures, T, of Orion KL and Oph East, as observed by the NANTEN radiotelescope were assumed to be 65 K and 15 K, respectively (Moriguchi et al., 2001). The CO observations covered a region (l b) of 86′.486′.4 centred at (l,b)=(307∘.8, 0∘.16) and the observed grid consists of points located every 1′.35 (full sampling). A total of 489 positions were observed.Typically, the integration time per point was 16s resulting in an rms noise of 0.3 K. A second-order degree polynomial was substracted from the observations to account for instrumental baseline effects. The spectra were reduced using CLASS software (GILDAS working group)111htto://www.iram.fr/IRAMFR/PDB/class/class.html.
-
2.
Narrow-band H data retrieved from SuperCOSMOS H-alpha Survey (SHS) 222http://www-wfau.roe.ac.uk/sss/halpha/index.html. The images have a sensitivity of 5 Rayleigh, and 1′′ spatial resolution (Parker et al., 2005)
-
3.
Radio continuum observations:
-
•
1.4 GHz data retrieved from the Southern Galactic Plane Survey (SGPS)333http://www.atnf.csiro.au/research/HI/sgps/queryForm.html. The angular resolution is 100′′ and the rms sensivity is below 1 mJy beam-1(Haverkorn et al., 2006).
-
•
4.85 GHz data retrieved from the Parkes-MIT-NRAO (PMN) Southern Radio Survey. The images have 5′ resolution and 8 mJy beam-1rms noise plus confusion (Condon et al., 1993).
-
•
843 MHz image retrieved from the Molonglo Galactic Plane Survey (MGPS)444http://www.astrop.physics.usyd.edu.au/MGPS/ . The angular resolution is 43′′ x 43′′cosec(dec) and the rms sensitivity is 1-2 mJy beam-1.
-
•
-
4.
Infrared data at 24 m (angular resolution 5′′) obtained from the Multiband Imaging Photometer for Spitzer (MIPS) from the MIPS Inner Galactic Plane Survey (MIPSGAL)555http://sha.ipac.caltech.edu/applications/Spitzer/SHA// (Carey et al., 2005).
3 Results and analysis of the observations
3.1 CO emission
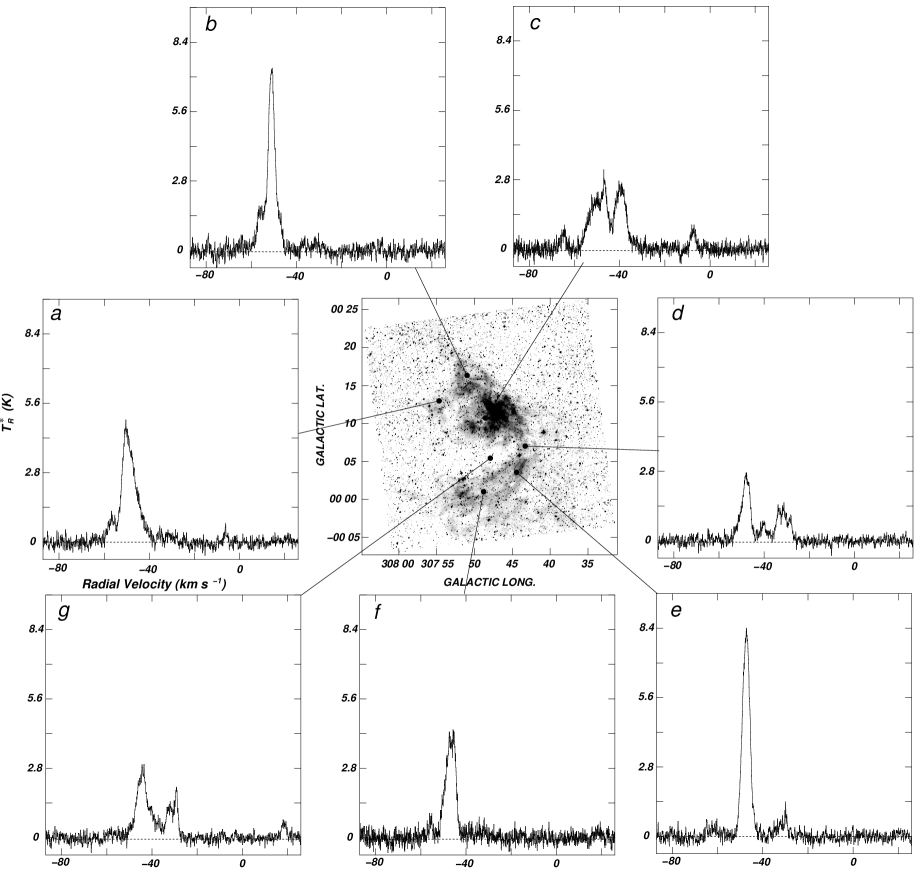
Representative CO profiles obtained at different positions towards RCW 78 are shown in Fig. 2. The CO emission shows three main velocity components: i) 58 to 46 km s-1 (profiles a to g), ii) 44 to 38 km s-1 (profile c, and probably d), and iii) 33 to 28 km s-1 (profiles d, e, and g).
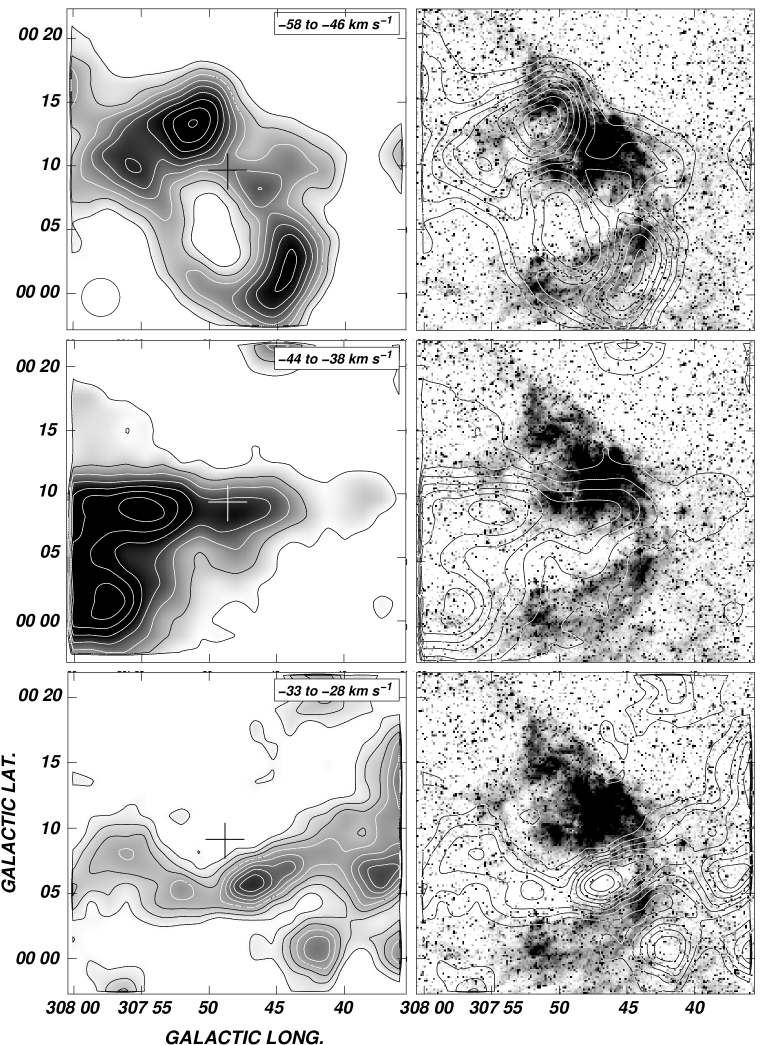
It is noticeable from Fig. 3 that the molecular gas distribution is quite dissimilar among the three velocity ranges mentioned above. In the velocity range from 58 to 46 km s-1 (upper left panel of Fig. 3) the molecular gas displays a very clumpy ring-like structure which has an excellent morphologic correlation with the H nebula, except for the lane of molecular gas betwen (l,b) (307∘54′, +00∘09′) and (l,b) (307∘52′, 00∘02′) (see Fig. 1 and Fig. 3, right panel) that has no H counterpart. The velocities of the CO line are similar to those observed at H by Chu & Treffers (1981). This molecular structure was reported by Cappa et al. (2009). In the second velocity range, 44 to 38 km s-1 (middle left panel of Fig. 3), the CO emission is mostly confined to a region whithin 307∘45′ 308∘00′and 00∘02′ +00∘12′. This molecular structure, also reported by Cappa et al. (2009), shows no resemblance with the H nebula. Along the third velocity range, 33 to 28 km s-1 (lower left panel of Fig. 3), the molecular gas appears as an elongated feature mostly confined along = +00∘05′
For the three molecular components, mean radial velocities weighted by line temperature () were derived using
| (1) |
where and are the peak temperature and the peak radial velocity of the -spectrum obtained within the first contour level used in Fig. 3 for each molecular component. The mean weighted radial velocities for the molecular gas in the three velocity ranges depicted in Fig. 3 are –49.5 km s-1 , –40.7 km s-1 , and -29.3 km s-1 , respectively. Using and the Galactic velocity field of Brand & Blitz (1993) along l = 307∘50′, kinematical distances for the molecular features were derived. It ought to be pointed out that along this galactic longitude radial velocities more negative than 47.5 km s-1 are forbidden. Nonetheless, it is well established that noncircular motions of the order of 8 km s-1 (Burton & Gordon, 1978) are known to exist in the Galaxy. Keeping this in mind, the molecular component at –49.5 km s-1 was assumed to be in the neighborhood of the tangential point at a distance of 5 kpc. This distance is in agreement with one of the quoted distance ranges of WR 55. Based on this distance agreement, and the excellent correspondence in morphology and line velocities between the CO and H emission, we believe that this molecular component is very likely related to both WR 55 and RCW 78. For the molecular component at –40.7 km s-1 , near and far kinematical distances of 3.5 kpc and 6.9 kpc are derived. In Fig. 3 (middle right panel) an overlay of this component with the H emission of RCW 78 is shown. Though the southern border of the CO feature appears to delineate very well the inner boundary of the H providing evidence in favour of a possible relationship, we suggest that this feature is very likely a background object with respect to RCW 78. The visual extinction (Av) at (l,b) (307∘47′, +00∘09′) can be obtained using the equation of Bohlin et al. (1978)
| (2) |
were is the molecular hydrogen column density (see below). We obtain in this direction a value of 4 1021 molecules cm-2, which yields to Av 4 magnitudes. Bearing in mind this figure, the visual absorption that would arise from the molecular gas do not diminish the brightness of the optical nebula in the way one would expect. Therefore, we suggest this object is unrelated to RCW 78 and it is located at the far kinematical distance. On the other hand, the CO feature at –29.3 km s-1 (Fig. 3, lower panel) shows an excellent spatial correlation with the high optical absorption lane seen at b +00∘05′ between 307∘44′ 307∘55′. Based on this, we suggest this feature is a foreground object with respect to RCW 78, locating it at its near kinematical distance ( 2.8 kpc). Based on the above, from here onwards we shall only concentrate on the analysis of the molecular gas distribution observed between –58 and –44 km s-1 , which is the only one likely to be associated with RCW 78.
| Parameter | C1 | C2 | C3 | C4 | C5 |
|---|---|---|---|---|---|
| Angular size (′) | 5 | 10 | 9 | 7 | 13 |
| Linear size (pc) | 5.6† | 14.5‡ | 13‡ | 10.2‡ | 19‡ |
| (km s-1 ) | 56.1 0.2 | 52.8 1.6 | 49.8 1.3 | 49.4 1.2 | 47.1 0.9 |
| (km s-1 ) | 2.8 0.5 | 5.1 1.1 | 8.2 2.3 | 5.1 1.1 | 4.7 0.9 |
| (K) | 3.1 0.9 | 3.9 0.5 | 4.8 1.2 | 4.1 0.8 | 5.4 1.1 |
| (1021 cm-2) | 0.9 0.2 | 3.3 0.5 | 4.0 0.6 | 2.2 0.3 | 3.9 0.7 |
| (103 M⊙) | 0.6 0.2† | 6.8 2.9‡ | 8.7 3.4‡ | 4.2 1.6‡ | 13.8 5.5‡ |
| (cm-3) | 16 5 | 118 50 | 108 42 | 91 34 | 101 41 |
| (K) | 7.6 | 8.9 | 10.2 | 9.4 | 11.1 |
† considering a distance of 3.9 kpc (see Sect 4.1)
‡ considering a distance of 5 kpc (see Sect. 3.1
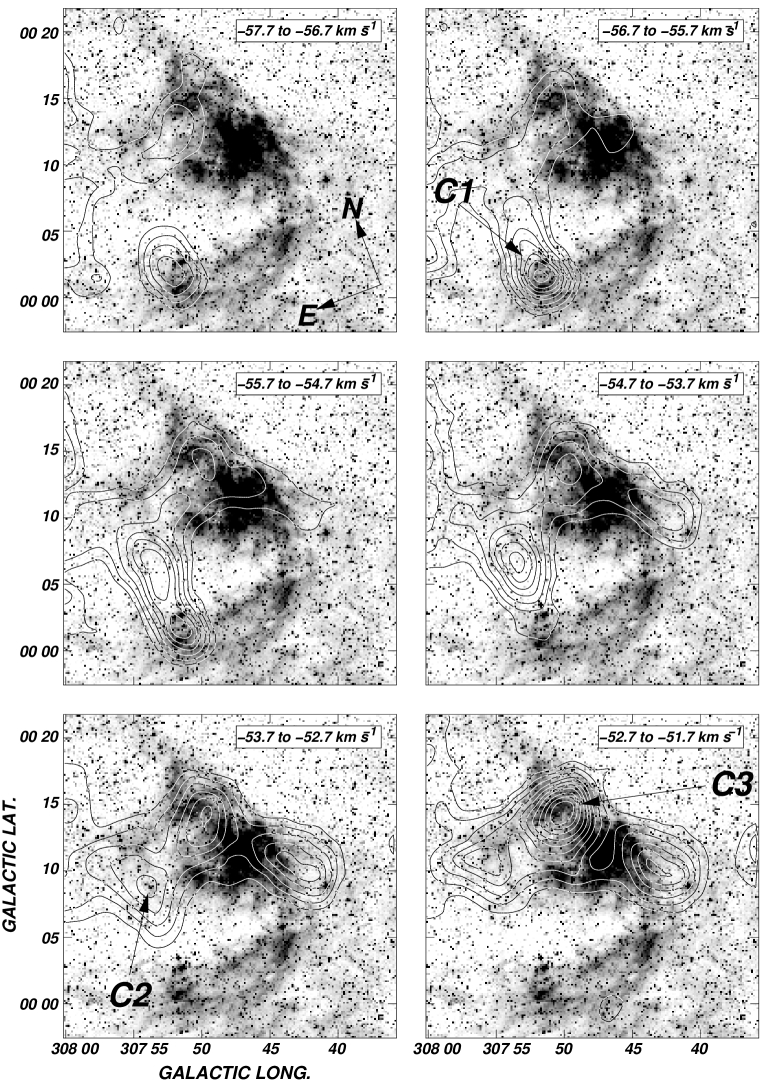
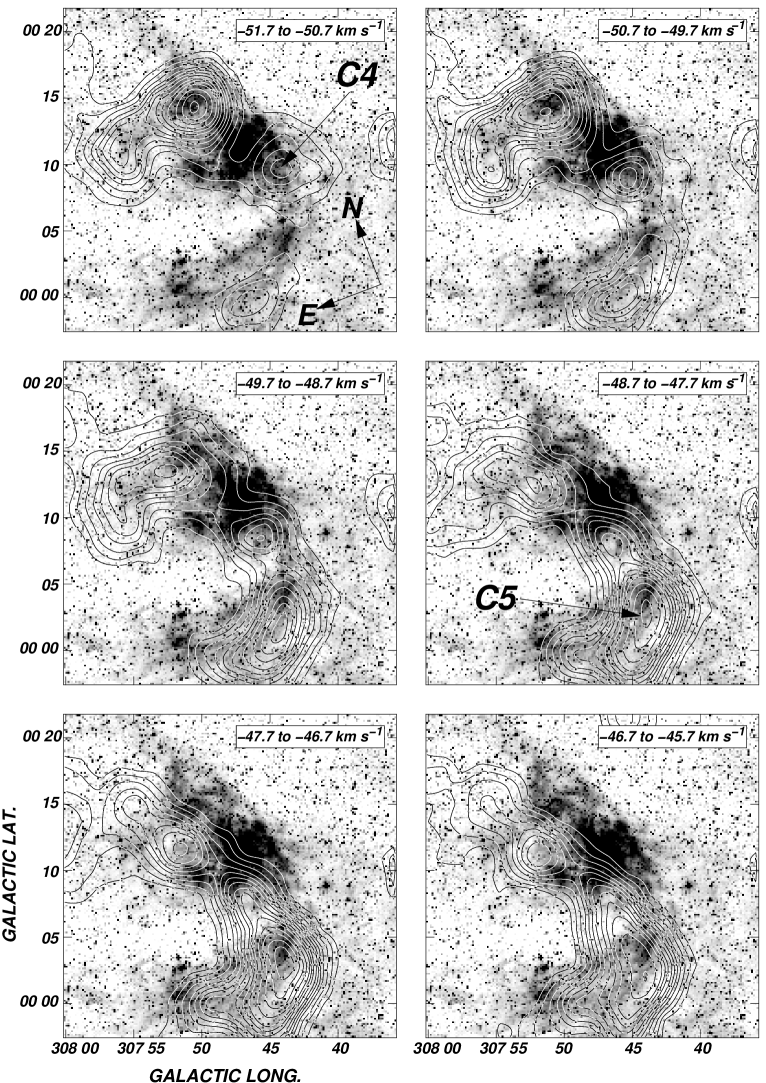
In Fig. 4 a collection of narrow velocity images depicting the CO spatial distribution in the velocity range from 57.7 to 45.7 km s-1 is shown. Every image represents an average of the CO emission over a velocity interval of 1 km s-1 (20 individual channel maps). The CO emission distribution shown in Fig. 4 (in contours) is projected onto the SHS H image of RCW 78 (greyscale). The velocity interval of the individual images is indicated in the upper right corner.
For the sake of further analysis, five molecular concentrations are identified. They are labelled from C1 to C5 in order of increasing radial velocity. Concentration C1, whose maximum is at (l,b) (307∘53′, 00∘03′), is visible from 57.7 to 54.7 km s-1 attaining a maximum emission temperature of 4.8 K. This feature appears projected onto the region where HD 117797 and the open cluster C1331-622 are located. This region is also coincident with the area where candidate YSOs were reported by Cappa et al. (2009). At slightly more positive velocities, concentration C2 is found. This feature, is first noticed in the velocity interval from 56.7 to 55.7 km s-1 , as an extension of C1, along a position angle of 45∘. Towards more positive velocities, the peak emission of this feature is shifted towards slightly higher longitudes and latitudes. In the velocity range from 52.7 to 48.7 km s-1 , C2 has a very good spatial correlation with the faint H emission seen in the northeastern part of RCW 78, at 307∘50′. Concentration C3, spans the velocity range from 55.7 to 48.7 km s-1 and has a very good morphological correlation with the H emission of RCW 78 seen 5′ northwards of WR 55. This component reaches a maximum emission temperature of 7.7 K at (l,b) (307∘50′, 00∘14′) in the velocity range from 51.7 to 50.7 km s-1 . Concentration C4 becomes first noticeable in the velocity range from 55.7 to 54.7 km -1 as a weak feature seen projected onto the low galactic longitude extreme of RCW 78. This feature remains clearly visible as a separate feature till 47.7 km -1. At more positive velocities this concentration is very difficult to follow because it merges with the northernmost extreme of C5. The latter is first observed in the velocity range 51.7 to 50.7 km -1 as a detached CO emission feature seen projected slightly offset from the H southernmost extreme of RCW 78. Concentration C5 reaches a maximum temperature of 8.9 K at at (l,b) (307∘44′, 00∘03′) in the velocity interval from 47.7 to 46.5 km s-1 .
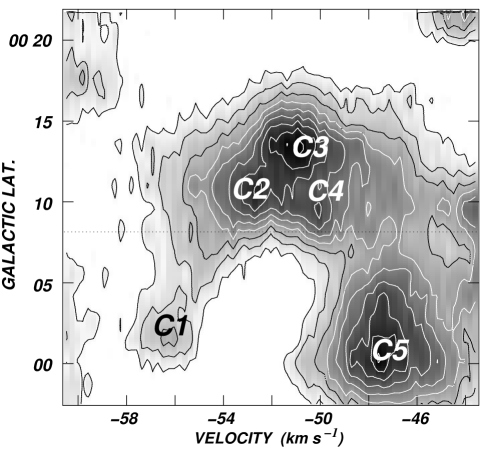
In Table 1 we list some physical and geometrical properties of the molecular concentrations C1 to C5. The angular and linear sizes of the concentrations are listed in rows 1 and 2, respectively. Figure 4 shows that a velocity gradient is present among the five molecular concentrations. In Table 1 the averaged velocity (), width (), and peak temperature , obtained from a gaussian fitting to the mean CO profile of each molecular concentration, are given in rows 3, 4, and 5, respectively. To obtain these profiles all individual CO spectra within the 0.5 K contour level in Fig. 3 were added up and averaged. Clearly, the mean velocity of the concentrations increases from C1 to C5. This velocity gradient is also noticeable in the velocity-galactic longitude image shown in Fig. 5. This image shows the averaged CO emission in the galactic longitud range 307∘42′ 308∘00′. Concentrations C1, C2, C3, C4, and C5 are identified.
The mass of the molecular gas was derived making use of the empirical relationship between the molecular hydrogen column density, , and the integrated molecular emission, (). The conversion between and ) is given by the equation
| (3) |
(Digel et al., 1996; Strong & Mattox, 1996). The total molecular mass , was calculated through
| (4) |
where is the solar mass ( 2 1033 g), is the mean molecular weight, assumed to be equal to 2.8 after allowance of a relative helium abundance of 25% by mass (Yamaguchi et al., 1999), is the hydrogen atom mass ( 1.67 10-24 g), is the solid angle subtended by the CO feature in ster, is the distance, expressed in cm, and is given in units of solar masses. Values of , , and molecular volume density () for each molecular concentration are quoted in rows 4, 5, and 6 of Table 1, respectively.
To probe the surface conditions of the molecular gas, mean excitation temperatures () were calculated. Assuming 12CO emission to be optically thick, averaged excitation temperatures were obtained from
| (5) |
(Dickman, 1978) where is the Planck function at a frequency , and is the background temperature ( 2.7 K). These values are presented in row 7 of Table 1. It is worth noting that Equation 5 assumes a filling factor unity, which implies that the values of quoted in Table 1 must be considered as lower limits.
3.2 Radio continuum emission
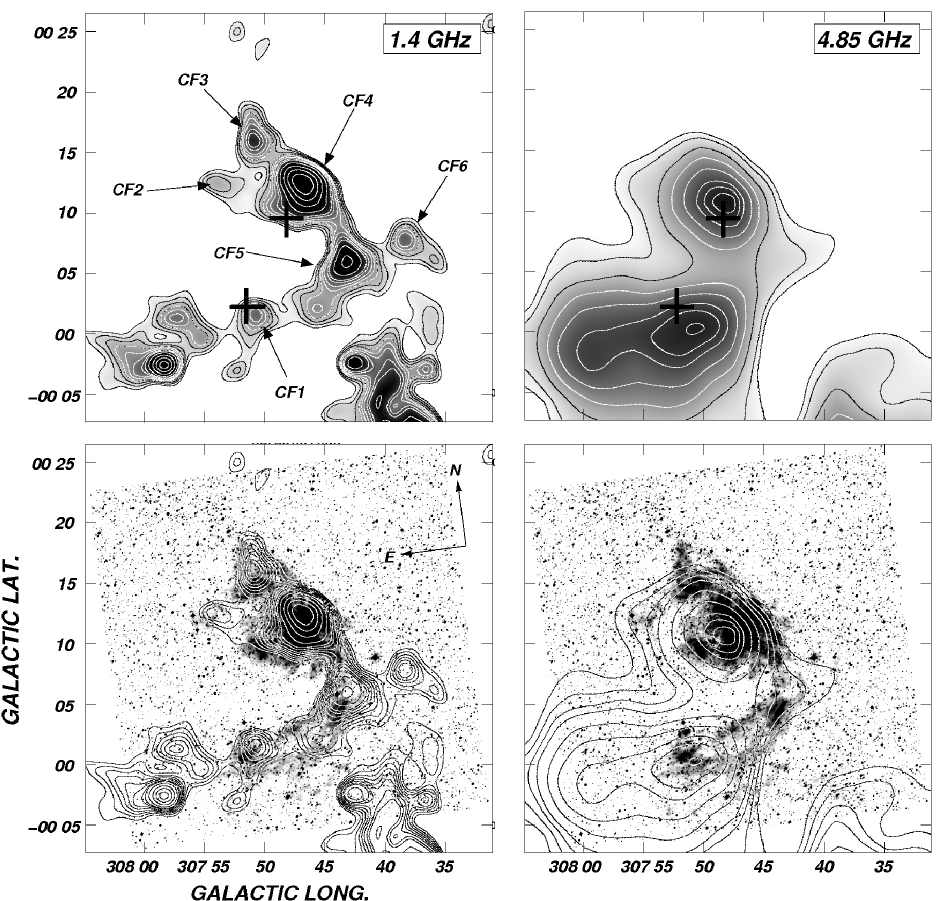
The radio continuum emission distribution at 1.4 GHz obtained from the ATCA archives is shown in the upper left panel of Fig. 6. Regardless of the difference in the angular resolution with the SuperCOSMOS image, radio continuum emission distribution resembles the H emission of the nebula (see Fig. 6, left lower panel). Two intense features, having no counterpart with the optical emission of RCW 78, are seen toward the south and southeast of the optical nebula. The southern feature, located in a region between 307∘35′ 307∘45′ and 0∘06′ 0∘02′ is probably related to an intense radio continuum source located at (l,b) = (307∘37′, 0∘18′) (not shown here), while the southeastern feature, located in a region between 307∘55′ 308∘05′ and 0∘05′ 0∘02′ is likely related to the source IRAS13316-6210. These features will not be considered any further in our analysis.
Six intense features peaking at about (l,b) = (307∘51′, 0∘02′), (l,b) = (307∘54′, 0∘12′), (l,b) = (307∘51′, 0∘16′), (l,b) = (307∘47′, 0∘13′), (l,b) = (307∘44′, 0∘06′), and (l,b) = (307∘38′, 0∘08′) are seen projected onto the optical nebula. Considering their positions, in accordance with the molecular concentrations described in Sect. 3.1, these features will be referred to as CF1, CF2, CF3, CF4, CF5 and CF6, respectively. In order to determine their radio continuum flux densities at 1.4 GHz (S1.4), the emission distribution was analysed making use of the NOD2 package (Haslam, 1974). The values of S1.4 for each feature were calculated, after substracting a background emission, and were summarized in Table 2. The error quoted for S1.4 stems from the uncertainty of the first contour level used to define the sources.
| CF1 | CF2 | CF3 | CF4 | CF5 | CF6 | |
|---|---|---|---|---|---|---|
| S1.4 (mJy) | 23 7 | 21 7 | 55 8 | 287 21 | 131 25 | 27 8 |
| Peak position (l,b) | 307∘51′, 0∘02′ | 307∘54′, 0∘12′ | 307∘51′, 0∘16′ | 307∘47′, 0∘13′ | 307∘44′, 0∘06′ | 307∘38′, 0∘08′ |
| (K) | 2.4 | 1.9 | 3.0 | 5.9 | 4.1 | 2.5 |
| (103 pc cm6) | 1.5 | 1.2 | 1.9 | 3.7 | 2.6 | 1.6 |
| ne (cm3) | 21 7 † | 20 6‡ | 21 6‡ | 20 5‡ | 22 6‡ | 20 5‡ |
‡ considering a distance of 5 kpc (see text)
† considering a distance of 3.9 kpc (see Sect 4.1)
To better characterize the nature of the radio continuum emission arising from RCW 78, the 4.85 GHz image obtained from the PMN Southern Radio Survey (Fig. 6, upper right panel) was also analysed. Though a detailed comparison between the 4.85 GHz and the H emission is difficult due to the difference in angular resolution, two different features at 4.85 GHz, peaking at about (l,b) = (307∘48′, 0∘11′) and (l,b) = (307∘51′, 0∘01′), seem to be morphologically correlated with the optical nebula. The first of them appears projected onto the brightest region of the optical nebula and its first contour level engulfs CF2, CF3, CF4, CF5, and CF6. As expected, the intense emission at 4.85 GHz arises from the central part of the nebula, toward the region of CF3 and CF4. The 4.85 GHz emission counterpart of CF2 is the low brightness elongation seen around (l,b) (307∘54′, +00∘13′), while the corresponding to CF5 and CF6 is the low intensity sharp-pointed structure observed around (l,b) (307∘43′, +00∘07′). The morphological correspondences described above are better visualized after convolving the 1.4 GHz image down to the angular resolution of the 4.85 GHz image (not shown here). The contiuum flux density measured for this feature is S4.85 = 440 50 mJy. To obtain the spectral index towards this region, the flux density at 1.4 GHz of features CF2, CF3, CF4, CF5, and CF6 were added up. These values provide an spectral index of = 0.14 0.05, which is compatible with the optically thin regime of an Hii region.
The second feature detected at 4.85 GHz is seen projected onto HD 117797 and very likely represents the 4.85 GHz counterpart of CF1. Unfortunately, the angular resolution of these observations makes it almost impossible to isolate this feature from the near by emission structure peaking approximately at (l,b) (307∘58′, –00∘02′). This fact prevents us from deriving a reliable continuum flux density at this frequency. The radio continuum image at 843 MHz retrieved from MGPS (not shown here) do not show instrumental artifacts in the area of CF1. Using this survey we derived for CF1 at this frequency a flux density of 24 5 mJy. Using this value and the 1.4 GHz flux density quoted from CF1 in Table 2, a spectral index of = 0.08 0.15 is derived. Again, the spectral index is compatible, within the error, with free-free emission of an Hii region in the optically thin regime. This speaks in favour of interpreting CF1 as the Hii region created by the early type star HD 117797.
The emission measure ( n ) of an Hii region can be obtained via the relationship between optical depth at a frequency () and given by
| (6) |
were is the electron temperature (considered to be 104 K), and the optical depth () is given by
| (7) |
In Eq. 7, is given in GHz and in pc cm-6. Using the radio continuum emission at 1.4 GHz, values of were calculated for each feature. These values are shown in row 4 of Table 2. Considering pure hydrogen plasma and adopting an extent along the line of sight equal to the observed minor axis, and using the values determined before electron densities (ne) were calculated. These values are quoted in row 5 of Table 2.
4 Discussion
4.1 Concentration C1
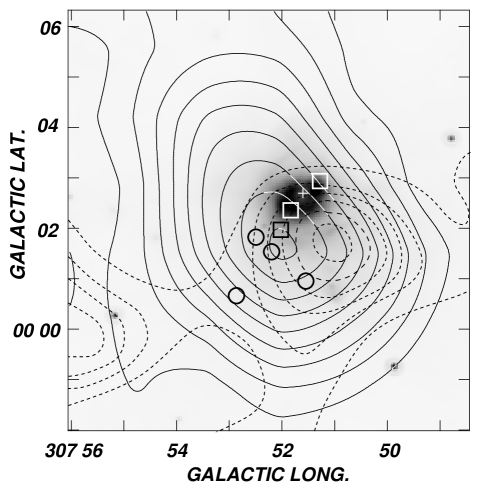
A look at Table 1 shows that the mean CO line width (), the molecular column density (), the total mass (), and volume density () of concentration C1 are systematically lower than the corresponding physical parameters of the other CO concentrations. The fact that its mean line width is on the average almost half of the line width of the other concentrations may be indicative that its dynamical state is different. In Fig. 7 the MIPSGAL 24 m emission of a 8′ 8′ region centered on HD 117797 superimposed on the mean CO emission in the velocity interval from 57.7 to 54.7 km s-1 (concentration C1) and radiocontinuum emission at 1.4 GHz of CF1 are shown. This image shows that the star HD 117797 and the Hii region CF1 are seen projected onto the molecular concentration C1 and that HD 117797 appears projected close to the centre of CF1. In the same figure a series of candidates YSOs reported by Cappa et al. (2009) are also seen in projection onto C1. Based on above, we may speculate that C1 is a molecular concentration that: a) is being partially ionized by HD 117797, and b) may be experiencing a star-forming process, revealed by the presence of candidate YSOs.
In order to check the first assumption, the total number of Lyman continuum photons () needed to keep CF1 ionized will be calculated. This figure is given by
| (8) |
(Chaisson, 1976), where is the electron temperature in units of 104 K, is the frequency in units of GHz, is the distance in kpc, and is the total flux density in Jy. Substituting in Eq. 8 the appropiate values, 3 1046 s-1 is obtained. This number is a lower limit to the total number of Lyman continuum photons required to maintain the gas ionized, since about 50 of the UV photons is absorbed by dust mixed with the gas in the Hii region (Inoue, 2001). Therefore, the number of Lyman continuum photons needed to power CF1 could be provided by HD 117797, since this number is a small fraction of the total ionizig photons emitted by a O8I star ( 1 1048 s-1) (Martins et al., 2005).
A noticeable feature in Fig. 7 is a ringlike structure 1′ diameter centered at the position of HD 117797, seen at 24 m emission. The MIPSGAL image allowed us to conclude that the observed IR emission detected by Cappa et al. (2009) in this direction (source “B”) arises from this feature.
If HD 117797 is the powering source of the Hii region CF1 and the latter is associated with the molecular concentration C1, then the distance of this complex is the distance to the star, namely 3.9 1.0 kpc. If the star WR 55 and its associated nebula RCW 78 were close to the values determined by Chu & Treffers (1981) and van der Hucht (2001), around 6 - 7.6 kpc, then there will be no relationship between HD 117797 and WR 55. In turn this implies that the molecular concentration C1 and the Hii region CF1 are not related to RCW 78 and its associated molecular and ionized gas. On the other hand, if the distance to WR 55 were close to the estimates of Georgelin et al. (1988), namely 4 kpc, a physical association with HD 117797 (and its associated molecular and ionized gas) could not be ruled out. More accurate distance determinations to WR 55 and HD 117797 are necessary to shed some light on this issue.
4.2 A simple scheme for the molecular gas associated with RCW 78
In an attempt to explain the morphology and radial velocity of the remaining molecular concentrations (C2, C3, C4, and C5), a simple geometrical model was elaborated taking into account the following constraints: 1) the morphology of the molecular gas, 2) the velocity gradient exhibited by the molecular gas, 3) the angular distribution of the different CO concentrations, and 4) the morphology of the H emission.
Because massive stars are born deeply buried within dense molecular clouds, the classical IB scenario predicts that the molecular gas should expand spherically around the star. Under the assumption of a spherically symmetric expansion, a shell having a central velocity V0 and an expansion velocity Vexp should depict in a position-position diagram a “disk-ring” pattern when observed at different velocities. At V0 the shell should attain its maximum diameter while at extreme velocities (either approaching or receding) the molecular emission should look like a disk. At intermediate velocities the radious of the ring shrinks as the extreme velocity are approaching. According to Fig. 4, this behaviour is not observed in our CO observations, which disagrees with the IB model.
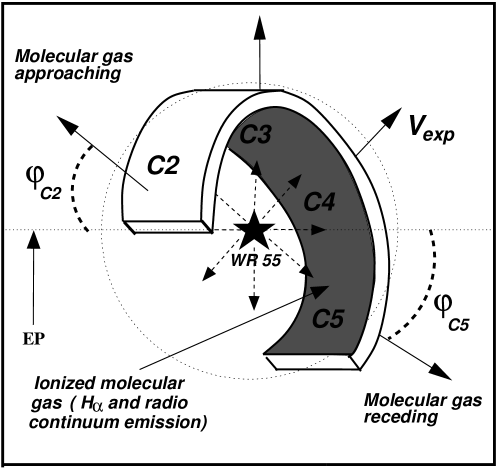
Instead, concentrations C2 to C5 are best explained by an spherically expanding ring-like structure partially surrounding WR 55, and tilted with respect to the plane of the sky. A sketch of this model is given in Fig. 8 where the approximate location of the different CO concentrations is given. The expansion of the molecular gas (filled arrows) is revealed by the velocity gradient (see Fig. 5). The ultimate cause of the expanding molecular gas are the stellar winds (dashed line arrows) of WR 55. From here onwards the structure composed by concentrations C2, C3, C4, and C5 will be labelled molecular belt (or MB for short). To facilitate further analysis, we divided MB into two hemispheres with a plane which contains the WR star and the observer (equatorial plane). This plane (dubbed EP for short) is also shown in Fig. 8
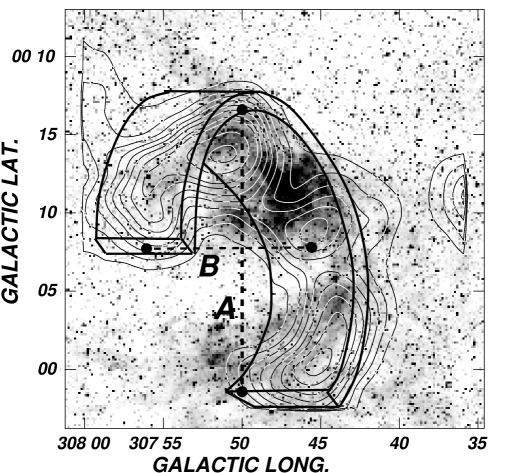
Under the assumption that MB is expanding with respect to WR 55 with a velocity Vexp, the observed radial velocity is determined by two angles and . The former represents the inclination of MB with respect to the plane of the sky, whilst represents the angle between Vexp and the plane EP (see Fig. 8). is single valued, whilst can take any value between 0∘ and 360∘. For the sake of clarity only the angles for concentrations C2 () and C5 () are shown in Fig. 8. Based on the sketch shown in Fig. 8, concentration C2 is approaching the observer (should show the most negative radial velocity) and concentration C5 is moving away from the observer (should show the most positive radial velocity). The other molecular concentrations (C3 and C4) should show intermediate radial velocities. A rough estimate of the angle can be obtained from the observed distribution of the molecular gas, bearing in mind that a ring-like structure in space will become an elliptical feature when projected onto the sky plane. In Fig. 9, the ring-like distribution of our model is projected onto both the observed CO distribution in the velocity range from –54 to –46 km s-1 and the H image of RCW 78. The approximate minor/major semiaxis ratio (B/A) of the elliptical structure can give an estimate of through the trigonometric relation B/A cos . A value of B/A 0.5 can be obtained, which leads to 60∘.
Based on Fig. 8, the maximum radial velocity difference among the molecular gas belonging to MB (), will be given by the radial velocity difference between concentrations C2 () and C5 (). From Table 1, = - 6 km s-1 . Based in our model
| (9) |
Using a coarse approximation (see Fig. 8), Eq. 9 can be written as
| (10) |
Based on Fig. 8 it will be assumed that 45∘. Admittedly, the uncertainty of can be very high. Inserting the appropiate values of and in Eq. 10, we obtain 5 km s-1 . The main physical and geometrical properties of MB are listed in Table 3. The kinetic energy () and momentum () were obtained by considering an expansion velocity of 5 km s-1 .
The proposed model is able to explain the main features of the optical nebula. The inner face of MB, which is exposed to the far-UV radiation field of WR 55, may be ionized. This ionized layer gives rise to both the radio continuum and H emission. Since concentration C2 is located between the observer and the ionized gas, it will diminish the intensity of the H emission that arises from the region of MB that faces WR 55. On the other hand, since towards concentrations C3, C4, and C5 the observer is directly viewing the inner ionized layer of MB, the H emission of these regions is not absorbed by the molecular gas. Since concentrations C3 and C4 may be closer to WR 55 than C2 and C5, the intensity of both the H and radio continuum emission is expected to be stronger there.
Though the proposed model is very simple, it is able to explain in a reasonable way the main observed characteristics of the H, radio continuum, and molecular gas associated with RCW 78. Furthermore, the velocity gradient exhibited by the CO is also nicely accounted for.
Certainly, more elaborated models are needed to better understand the origin and evolution of WRRN. Molecular ring-like structures have been reported previously around several massive stars. Recently, Beaumont & Williams (2010) surveyed the CO (3-2) line towards 43 identified Spitzer bubbles in the Galactic plane. They concluded that the molecular gas tends to lie in rings, rather than shells. The authors suggest that the parental molecular clouds, in which the massive stars and IBs are formed, are oblate with one dimension of a few parsecs in thickness. Then, expanding bubbles break out of the parental molecular cloud and only a circular or elliptical ring of CO emission is detected, depending on the orientation of the axis. The authors claimed that if the wind emitted by the star powering the bubble is sufficiently strong, the ring’s expansion continues after breaching the flattened cloud. Nevertheless, Deharveng et al. (2010) claimed that a possible shortcoming of the scenario proposed by Beaumont & Williams (2010) is the absence of a bipolar nebula as a result of a double champagne flow effect along the poles of the IB (Tenorio Tagle et al., 1979) .
| Parameter | Value |
|---|---|
| Major semiaxis (′) | 9 |
| Minor semiaxis (′) | 4.5 |
| Major semiaxis (pc) | 13 |
| (km s-1 ) | 6 |
| (km s-1 ) | 5 |
| (km s-1 ) | 51 |
| (104 M⊙) | 3.4 1.3 |
| ( erg) | 9 |
| (10 4 M⊙ km s-1 ) | 1.7 |
4.3 Energetics of RCW 78 and MB
In our simple model, the main ionizing source of RCW 78 is the Lyman continuum flux of the WR star WR 55. The latter is also the driving source, via the mechanical energy injected by its stellar wind, of the expansion of the molecular gas associated with RCW 78. Is WR 55 capable of powering RCW 78 and providing the mechanical energy needed to set in the expansion of the molecular gas?
To answer the first part of the question, the number of Lyman continuum photons needed to keep the current level of ionization in RCW 78 must be calculated. To this end, the continuum flux densities of CF2, CF3, CF4, CF5, and CF6 were added up, and using Eq. 8 under the assumption that 104 K and 5 kpc, we derived 1 1048 s-1. Considering that the number of Lyman continuum photons emitted by a WN7 star is 2.5 1049 s-1 (Crowther, 2007), the WR star may be capable of mantaining the ionization level of RCW 78.
In regards to the point of whether the mechanical energy injected by WR 55 could be driving the expansion of MB we shall derive a rough figure for the total mechanical energy injected via stellar winds by both WR 55 and its progenitor. The wind mechanical energy () will be estimated using
| (11) |
where is the mass loss rate in units of M⊙ yr-1, is the wind terminal velocity in units of km s-1 , and is the time spent by the star during either the WR or the main sequence phase. Adopting for WR 55 a mass loss rate = 210-5 M⊙ yr-1, a terminal wind velocity = 1960 km s-1 (Smith et al., 2002), and 5 105 yr (van der Hucht, 2001), a mechanical energy of 3.8 1050 erg is obtained. Considering an O3V star as the progenitor of the WN star (Massey, 1998), and adopting = 1.41 10-6 M⊙ yr-1and Vw = 3150 km s-1 for this spectral type (Smith et al., 2002), and adopting a main sequence lifetime of 2 106 yr (Massey, 1998), the mechanical energy injected during the main sequence is EO 2.8 1050 erg. Therefore, the total mechanical energy injected into the interstellar medium is 6.6 1050 erg. Taking into account that the expanding kinetic energy of MB is 9 erg (see Table 3), only about 1.4 of the mechanical energy released by WR 55 and its projenitor would be needed to account for the kinetic energy of the expanding molecular gas. This estimates is in good agreement with the conversion efficiencies of the order of 2-5 reported by Hi line studies of IBs (Cappa et al., 1996; Cichowolski et al., 2001, 2003). Theoretical models also suggest that in adiabatic wind bubbles only a few percent of the injected mechanical energy will be converted into kinetic energy of the expanding gas (Weaver et al., 1977; Koo & McKee, 1992; Arthur, 2007). Based on the above consideration, the stellar winds of both WR 55 and its progenitor are able to provide the observed kinetic energy of MB. In Regards to the momentum injected by the WR star and its progenitor to the ISM we obtain 2.1 104 M⊙ km s-1 which is almost in agreement with the momentum of MB (see Table 3). This indicates that the momentum is better conserved in the system star-MB.
The dynamical age (yr) of a wind blown bubble in the momentum conserving case can be calculated using
| (12) |
(McCray, 1983; Howarth & Lamers, 1999), where is the radius of the bubble (pc), and is the expansion velocity (km s-1 ). Adopting 13 pc (linear length of major semiaxis) and = 5 km s-1 , a value of 1.3 106 yr is obtained for MB. Considering uncertainties, this value is almost in agreement with the duration of the O and WN phases combined.
It is worth mentioning that the small solid angle ( 4) subtended by MB reduces the wind mechanical energy and ionizing power of WR 55 available to it. This may also help to explain the tightness in the energy requirements (radiative and mechanical) and dynamical age obtained before.
5 Summary
The 12CO (1-0) and radio continuum emission distribution whithin a square region 25′ 25′ in size centered on the WN7 star HD 117688 (WR 55) around the optical nebula RCW 78 have been analyzed using intermediate angular resolution CO data, high angular resolution radiocontinuum data at 1.4 GHz and 4.85 GHz, and H data.
The CO data have allowed us to identify a molecular feature likely to be associated with RCW 78. This gas has a mean velocity of –49.5 km s-1 , and its spatial distribution shows an excellent morphological correlation with the optical nebula. This feature is far from being homogeneous and five molecular concentrations have been identified. Each one of them is very well correlated with different areas of RCW 78. These molecular concentrations exhibit a clear radial velocity gradient. The mean radial velocity of the different molecular concentrations and the radial velocity gradient shown by the CO is in good agreement with the H data. The molecular gas related to RCW 78 has a total mass of 3.4 104 M⊙
High resolution continuum data have revealed the presence of six features towards RCW 78. Five of them, identified as CF2, CF3, CF4, CF5, and CF6 are likely to be associated with the nebula. Based on radio continuum flux densitiy determinations at 1.4 and 4.85 GHz all these sources are thermal in nature. A sixth radio continuum fature (labelled CF1) is also thermal and very likely is related to HD 117797. Due to the uncertainty in the distances of both HD 117797 and WR 55 (the WR star is associated with RCW 78) it is not clear whether both objects are related to each other, or HD 117797 is a foreground object to RCW 78.
A very simple model has been elaborated in order to explain the radial velocity gradient depicted by the molecular gas, and same of the morphological properties shown by RCW 78. The model consits of an expanding ring-like structure of molecular gas, whose inner face is being ionized by the Lyman continuum photons emitted by WR 55. The ring-like feature is inclined by 60∘ with respect to the sky plane, and has a low expansion velocity of 5 km s-1 . The WR star may well be the main ionization source of the nebula RCW 78 and the driving source of the expansion of the associated molecular gas.
Acknowledgements.
We acknowledge the referee, Prof. You-Hua Chu, and the editor, Malcolm Walmsley for their helpful comments and suggestions that improved the presentation of this paper. This project was partially financed by the Consejo Nacional de Investigaciones Científicas y Técnicas (CONICET) of Argentina under projects PIP 112-200801-01299, Universidad Nacional de La Plata (UNLP) under project 11G/091, and Agencia Nacional de Promoción Cientíca y Tecnológica (ANPCYT) under project PICT 14018/03. This research has made use of the VIZIER database, operated at the CDS, Strasbourg, France. We greatly appreciate the hospitality of all staff members of Las Campanas Observatory of the Carnegie Institute of Washington. We thank all members of the NANTEN staff, in particular Prof. Yasuo Fukui, Dr. Toshikazu Onishi, Dr. Akira Mizuno, and students Y. Moriguchi, H. Saito, and S Sakamoto. We also would like to thank Dr. D. Miniti (Pontífica Universidad Católica, Chile) and Mr. F Bareilles (IAR) for their involment in early stages of this projectReferences
- Arnal (1992) Arnal, E. M. 1992, A&A, 254, 305
- Arnal & Cappa (1996) Arnal, E. M. & Cappa, C. E. 1996, MNRAS, 279, 788
- Arnal et al. (1999) Arnal, E. M., Cappa, C. E., Rizzo, J. R., & Cichowolski, S. 1999, AJ, 118, 1798
- Arthur (2007) Arthur, S. J. 2007, Wind-Blown Bubbles around Evolved Stars, ed. Hartquist, T. W., Pittard, J. M., & Falle, S. A. E. G., 183
- Beaumont & Williams (2010) Beaumont, C. N. & Williams, J. P. 2010, ApJ, 709, 791
- Bohlin et al. (1978) Bohlin, R. C., Savage, B. D., & Drake, J. F. 1978, ApJ, 224, 132
- Brand & Blitz (1993) Brand, J. & Blitz, L. 1993, A&A, 275, 67
- Burton & Gordon (1978) Burton, W. B. & Gordon, M. A. 1978, A&A, 63, 7
- Cappa et al. (1996) Cappa, C. E., Niemela, V. S., Herbstmeier, U., & Koribalski, B. 1996, A&A, 312, 283
- Cappa et al. (2001) Cappa, C. E., Rubio, M., & Goss, W. M. 2001, AJ, 121, 2664
- Cappa et al. (2009) Cappa, C. E., Rubio, M., Martín, M. C., & Romero, G. A. 2009, A&A, 508, 759
- Carey et al. (2005) Carey, S. J., Noriega-Crespo, A., Price, S. D., et al. 2005, in Bulletin of the American Astronomical Society, Vol. 37, American Astronomical Society Meeting Abstracts, 1252
- Castor et al. (1975) Castor, J., McCray, R., & Weaver, R. 1975, ApJ, 200, L107
- Chaisson (1976) Chaisson, E. J. 1976, in Frontiers of Astrophysics, ed. E. H. Avrett, 259–351
- Chu (1981) Chu, Y.-H. 1981, ApJ, 249, 195
- Chu & Treffers (1981) Chu, Y.-H. & Treffers, R. R. 1981, ApJ, 250, 615
- Cichowolski et al. (2003) Cichowolski, S., Arnal, E. M., Cappa, C. E., Pineault, S., & St-Louis, N. 2003, MNRAS, 343, 47
- Cichowolski et al. (2001) Cichowolski, S., Pineault, S., Arnal, E. M., et al. 2001, AJ, 122, 1938
- Condon et al. (1993) Condon, J. J., Griffith, M. R., & Wright, A. E. 1993, AJ, 106, 1095
- Conti & Vacca (1990) Conti, P. S. & Vacca, W. D. 1990, AJ, 100, 431
- Crowther (2007) Crowther, P. A. 2007, ARA&A, 45, 177
- Deharveng et al. (2010) Deharveng, L., Schuller, F., Anderson, L. D., et al. 2010, A&A, 523, A6
- Dias et al. (2010) Dias, W. S., Alessi, B. S., Moitinho, A., & Lepine, J. R. D. 2010, VizieR Online Data Catalog, 10, 2022
- Dickman (1978) Dickman, R. L. 1978, ApJS, 37, 407
- Digel et al. (1996) Digel, S. W., Grenier, I. A., Heithausen, A., Hunter, S. D., & Thaddeus, P. 1996, ApJ, 463, 609
- Dyson (1977) Dyson, J. E. 1977, A&A, 59, 161
- Esteban (1993) Esteban, C. 1993, PASP, 105, 320
- Esteban et al. (1990) Esteban, C., Vilchez, J. M., Manchado, A., & Edmunds, M. G. 1990, A&A, 227, 515
- Garcia-Segura & Mac Low (1995) Garcia-Segura, G. & Mac Low, M.-M. 1995, ApJ, 455, 145
- Georgelin et al. (1988) Georgelin, Y. M., Boulesteix, J., Georgelin, Y. P., Le Coarer, E., & Marcelin, M. 1988, A&A, 205, 95
- Haslam (1974) Haslam, C. G. T. 1974, A&AS, 15, 333
- Haverkorn et al. (2006) Haverkorn, M., Gaensler, B. M., McClure-Griffiths, N. M., Dickey, J. M., & Green, A. J. 2006, ApJS, 167, 230
- Howarth & Lamers (1999) Howarth, I. & Lamers, H. J. G. 1999, Journal of the British Astronomical Association, 109, 347
- Inoue (2001) Inoue, A. K. 2001, AJ, 122, 1788
- Koo & McKee (1992) Koo, B.-C. & McKee, C. F. 1992, ApJ, 388, 93
- Kutner & Ulich (1981) Kutner, M. L. & Ulich, B. L. 1981, ApJ, 250, 341
- Marston (2001) Marston, A. P. 2001, ApJ, 563, 875
- Martins et al. (2005) Martins, F., Schaerer, D., & Hillier, D. J. 2005, A&A, 436, 1049
- Massey (1998) Massey, P. 1998, in Astronomical Society of the Pacific Conference Series, Vol. 142, The Stellar Initial Mass Function (38th Herstmonceux Conference), ed. G. Gilmore & D. Howell, 17
- McCray (1983) McCray, R. 1983, Highlights of Astronomy, 6, 565
- Moriguchi et al. (2001) Moriguchi, Y., Yamaguchi, N., Onishi, T., Mizuno, A., & Fukui, Y. 2001, PASJ, 53, 1025
- Parker et al. (2005) Parker, Q. A., Phillipps, S., Pierce, M. J., et al. 2005, MNRAS, 362, 689
- Penzias & Burrus (1973) Penzias, A. A. & Burrus, C. A. 1973, ARA&A, 11, 51
- Rizzo et al. (2001a) Rizzo, J. R., Martín-Pintado, J., & Henkel, C. 2001a, ApJ, 553, L181
- Rizzo et al. (2001b) Rizzo, J. R., Martín-Pintado, J., & Mangum, J. G. 2001b, A&A, 366, 146
- Rodgers et al. (1960) Rodgers, A. W., Campbell, C. T., & Whiteoak, J. B. 1960, MNRAS, 121, 103
- Smith et al. (2002) Smith, L. J., Norris, R. P. F., & Crowther, P. A. 2002, MNRAS, 337, 1309
- Strong & Mattox (1996) Strong, A. W. & Mattox, J. R. 1996, A&A, 308, L21
- Tenorio Tagle et al. (1979) Tenorio Tagle, G., Yorke, H. W., & Bodenheimer, P. 1979, A&A, 80, 110
- Turner & Forbes (2005) Turner, D. G. & Forbes, D. 2005, PASP, 117, 967
- Ulich & Haas (1976) Ulich, B. L. & Haas, R. W. 1976, ApJS, 30, 247
- van der Hucht (2001) van der Hucht, K. A. 2001, New A Rev., 45, 135
- Vasquez et al. (2005) Vasquez, J., Cappa, C., & McClure-Griffiths, N. M. 2005, MNRAS, 362, 681
- Vasquez et al. (2009) Vasquez, J., Cappa, C. E., & Pineault, S. 2009, MNRAS, 395, 2045
- Walborn (1972) Walborn, N. R. 1972, AJ, 77, 312
- Walborn (1982) Walborn, N. R. 1982, AJ, 87, 1300
- Weaver et al. (1977) Weaver, R., McCray, R., Castor, J., Shapiro, P., & Moore, R. 1977, ApJ, 218, 377
- Yamaguchi et al. (1999) Yamaguchi, N., Mizuno, N., Saito, H., et al. 1999, PASJ, 51, 775