Herschel***Herschel is an ESA space observatory with science instruments provided by European-led Principal Investigator consortia and with important participation from NASA. –ATLAS: towards a sample of strongly-lensed galaxies
Abstract
While the selection of strongly lensed galaxies with m flux density mJy has proven to be rather straightforward (Negrello et al. 2010), for many applications it is important to analyze samples larger than the ones obtained when confining ourselves to such a bright limit. Moreover, only by probing to fainter flux densities is possible to exploit strong lensing to investigate the bulk of the high- star-forming galaxy population. We describe HALOS (the Herschel-ATLAS Lensed Objects Selection), a method for efficiently selecting fainter candidate strongly lensed galaxies, reaching a surface density of –, i.e. a factor of about 4 to 6 higher than that at the 100 mJy flux limit. HALOS will allow the selection of up to candidate strongly lensed galaxies (with amplifications ) over the full H-ATLAS survey area. Applying HALOS to the H-ATLAS Science Demonstration Phase (SDP) field () we find 31 candidate strongly lensed galaxies, whose candidate lenses are identified in the VIKING near-infrared catalog. Using the available information on candidate sources and candidate lenses we tentatively estimate a purity of the sample. As expected, the purity decreases with decreasing flux density of the sources and with increasing angular separation between candidate sources and lenses. The redshift distribution of the candidate lensed sources is close to that reported for most previous surveys for lensed galaxies, while that of candidate lenses extends to substantially higher redshifts than found in the other surveys. The counts of candidate strongly lensed galaxies are also in good agreement with model predictions (Lapi et al. 2011). Even though a key ingredient of the method is the deep near-infrared VIKING photometry, we show that H-ATLAS data alone allow the selection of a similarly deep sample of candidate strongly lensed galaxies with an efficiency close to 50%; a slightly lower surface density () can be reached with a efficiency.
1 Introduction
As stressed by Treu (2010) most of the applications of strong gravitational lensing to address major astrophysical and cosmological issues are currently limited by sample size. Samples of thousands of strongly lensed systems are needed to make substantial progress. This will indeed be a major task for future wide field optical (see, e.g., Oguri & Marshall, 2010) and radio (SKA) surveys (e.g., Koopmans et al., 2004).
However, as predicted by Blain (1996), Perrotta et al. (2002, 2003), Negrello et al. (2007), Paciga et al. (2009), and Lima et al. (2010), among others, and demonstrated by Negrello et al. (2010), millimeter and sub-millimeter surveys are an especially effective route to reach this goal.
This is because the counts of unlensed high- (sub-)mm galaxies (SMGs) drop very rapidly at bright flux densities, mirroring the rapid build-up of proto-spheroidal galaxies (Granato et al., 2004; Lapi et al., 2011). The magnification bias of the counts due to gravitational lensing is then boosted, making the selection of strongly lensed galaxies particularly easy for relatively shallow large area (sub-)mm surveys.
For example, objects above mJy at m were predicted (Negrello et al., 2007) to comprise almost equal numbers of low- () late-type galaxies, with far-IR emission well above the IRAS detection limit and easily identified in the optical, and high- () strongly lensed SMGs, plus a handful of radio sources (mostly blazars), also easily identified in low-frequency radio catalogs. The predicted (and observed) surface density of strongly lensed galaxies (SLGs) with m flux density brighter than mJy is . A similar surface density of candidate SLGs was found by Vieira et al. (2010) at the detection limit of their survey with the South Pole Telescope (SPT) at 1.4 and 2 mm. This means that the SPT, which plans to cover some 2,500, may yield a sample of SLGs.
The Herschel Astrophysical Terahertz Large Area Survey†††http://www.h-atlas.org/ (H-ATLAS; Eales et al., 2010), the largest area survey carried out by the Herschel Space Observatory (Pilbratt et al., 2010), covering with PACS (Poglitsch et al., 2010) and SPIRE (Griffin et al., 2010), will easily provide a sample of about 150–200 SLGs with mJy. Many more such objects may be found at fainter flux densities, but singling them out is more difficult because they are mixed with high- unlensed galaxies.
The selection of fainter SLGs has the important additional bonus that it allows us to pick up galaxies more representative of the bulk of the star-forming galaxy population at 1–3. High- SLGs brighter than 100 mJy at m have apparent far-IR luminosities (Negrello et al., 2010). Correcting for a gravitational amplification by a factor of 10 (typical of these sources, see Harris et al., 2012), their far-IR luminosity corresponds to a star-formation rate . In contrast, data from sensitive near-infrared integral field spectrometers mounted on 8-10m class telescopes (e.g. Förster Schreiber et al., 2009) suggest that the most effective star formers in the Universe have high but far less extreme SFRs (). The power of strong lensing is needed to detect these sources, that are otherwise well below the SPIRE confusion limit; but we need to select SLGs with sub-mm flux densities as faint as possible.
In this paper we discuss a strategy that exploits the multi-wavelength coverage of the H-ATLAS survey areas to improve the selection efficiency of candidate SLGs fainter than mJy. We apply our strategy to objects detected in the H-ATLAS Science Demonstration Phase (SDP) field, that covers an area of centered on J2000) to the same depth as the general H-ATLAS survey. Complete descriptions of the reduction of PACS and SPIRE SDP data are given in Ibar et al. (2010) and Pascale et al. (2011), respectively. Source extraction and flux density estimation are described in Rigby et al. (2011). The detection limits, including confusion noise, are , 37.7, and in the SPIRE bands at 250, 350, and m, respectively; in the PACS bands they are and at 100 and m, respectively (Rigby et al., 2011).
We show that this strategy can allow us to reach candidate SLGs surface densities of –, that would imply a total of up to SLGs in the full H-ATLAS survey. The outline of this paper is as follows. In § 2 we describe the selection of the parent sample, that, in § 3, is exploited to re-assess the bright end of the luminosity function in the same redshift bins as in Lapi et al. (2011). In § 4 we describe our approach to single out candidate SLGs in the parent sample and to estimate the purity of the candidate SLG sample. While our method relies on the deep near-IR photometry provided by the VISTA Kilo-degree INfrared Galaxy survey (VIKING; Sutherland et al., 2011; Fleuren et al., 2011), in § 5 we show how a selection with only a modest efficiency loss can be achieved using H-ATLAS data alone. Our main results are summarized and discussed in § 6.
2 Sample selection
Lapi et al. (2011) have selected a sample of candidate high-redshift () H-ATLAS SDP galaxies starting from a sample of objects obeying the following criteria: i) mJy; ii) no Sloan Digital Sky Survey (SDSS) counterpart with reliability , as determined by Smith et al. (2011a); and iii) detection at m. As pointed out in that paper, this sample is biased against strongly lensed galaxies that may have an apparently reliable SDSS identification (at a very small angular separation), which, however, is the foreground lens. This was a minor problem for the purpose of the Lapi et al. paper, but for the purpose of the present paper these objects need to be recovered. This can be done by checking whether the optical luminosities and colors of the possible identifications are compatible with the Herschel photometric data. The task is eased by the fact that frequently (but not always, as demonstrated by the SWELLS survey, Treu et al., 2011) the lenses are passive elliptical galaxies (Auger et al., 2009; Negrello et al., 2010).
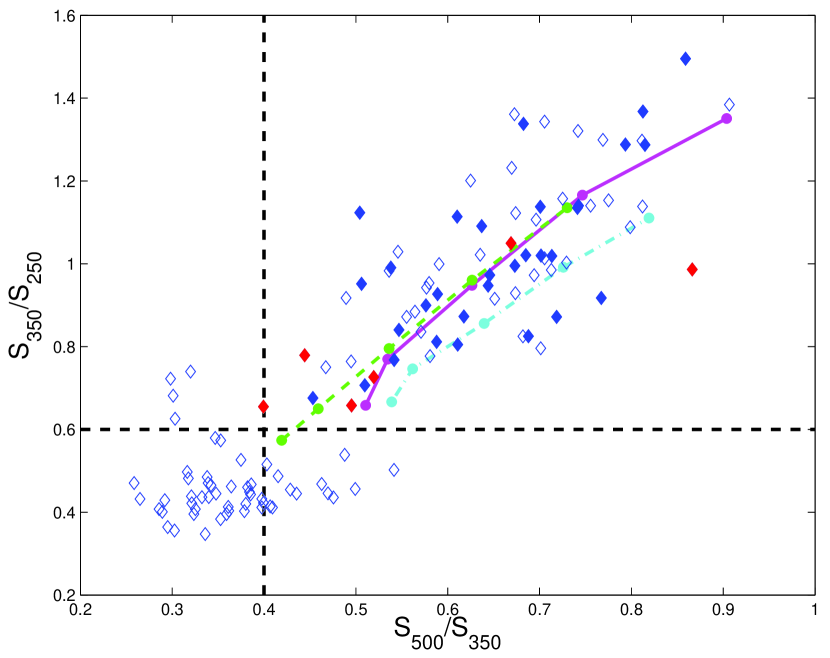
Using the formalism of Perrotta et al. (2002) and the sub-mm luminosity functions of Lapi et al. (2011) we find that a substantial increase in the surface density of strongly lensed sources can be achieved, still ensuring that the ratio of lensed to unlensed high- galaxies is not far below unity, by applying a flux density cutoff of 85 mJy at m. At this limit, the model yields surface densities of , for both lensed and unlensed high- galaxies (while the surface density of galaxies is ). In the SDP field we have 127 objects with mJy and mJy. Their SPIRE colors are plotted in Fig. 1, along with the colors yielded by the Spectral Energy Distributions (SEDs) of three ultraluminous dusty galaxies (Arp 220; SMM J2135-0102, ‘The Cosmic Eyelash’ at , Ivison et al. 2010, Swinbank et al. 2010; H-ATLAS J142413.9+022304 alias G15.141 at , Cox et al. 2011) as a function of redshift. For all the three SEDs, objects with and are at . Nevertheless, as discussed in Lapi et al. (2011), some of them might be low- galaxies with moderate SFRs and cold far-IR SEDs, but in that case they would be expected to have SDSS counterparts.
There are 74 objects, out of the total of 127, that conform to these color criteria. Two of them, however, have anomalous colors and were excluded from the subsequent analysis: HATLAS J090402.9+005436 (SDP.34) is a compact Galactic molecular cloud, also known as the “H-ATLAS Blob” (Thompson et al., 2011); and HATLAS J090025.4-003019 (SDP.218) has , perhaps indicating a substantial boosting of the m flux density due to a background fluctuation. We also excluded HATLAS J090910.1+012135 (SDP.61) because it is a blazar (González-Nuevo et al., 2010, it does not show up in Fig. 1 because its color is out of range). We further exclude HATLAS J090923.9+000210 (SDP.362) because it is a QSO. Three more objects (HATLAS J090359.6-004556 = SDP.70, HATLAS J085828.4+012210 = SDP.85, and HATLAS J091059.1+000303 = SDP.121) were also excluded because they have PACS flux densities that suggest .
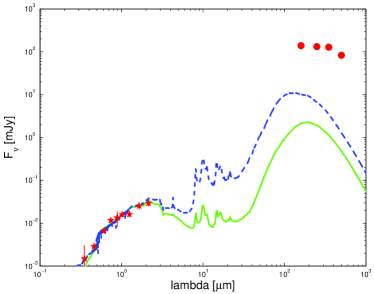
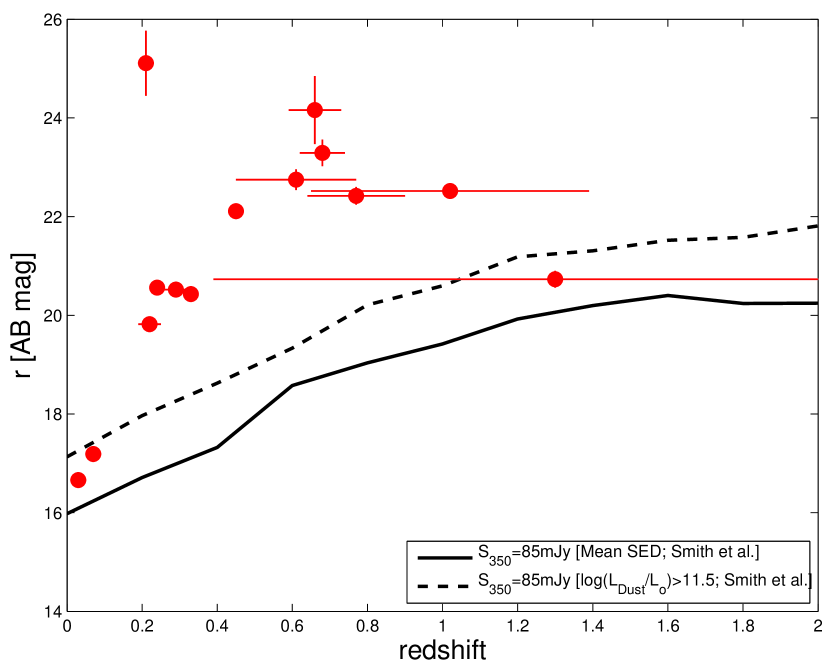
Of the remaining 67 objects, 14 have reliable () SDSS counterparts according to Smith et al. (2011a). Four of these 14 objects are strongly lensed sources of Negrello et al. (2010)‡‡‡The fifth Negrello source does have an SDSS counterpart but its r-band magnitude is above the limit adopted in Smith et al. (2011a) for estimating the reliabilities.. Their counterparts as well as those of another seven of the 14 objects have SDSS magnitudes too faint to account for the optical and the far-IR emissions at the same time if they have the cold far-IR SEDs observed for galaxies with moderate SFRs (Smith et al., 2011b, see the left-hand panel of Fig. 2 and Fig. 3; other examples are in Negrello et al. (2010)). In other words, the H-ATLAS objects must have higher apparent far-IR to optical luminosity ratios than the Smith et al. (2011a) galaxies, akin to those of SMGs, and/or have colder far-IR colors, and this implies that they must be at higher redshifts than those indicated by the optical/near-IR SEDs of their SDSS counterparts. We therefore assume that the SDSS counterparts are not the optical identifications of the far-IR sources and are instead the lenses. The seven objects are HATLAS J091331.3-003642 = SDP.44, HATLAS J090952.9-010811 = SDP.60, HATLAS J090957.6-003619 = SDP.72, HATLAS J091351.7-002340 = SDP.327, HATLAS J090429.6+002935 = SDP.354, HATLAS J090453.2+022018 = SDP.392, and HATLAS J085859.2+002818 = SDP.512.
In general, SDSS counterparts that are not the optical identifications of the far-IR objects can contaminate the Herschel photometry, but only marginally if they have the far-IR SEDs observed for galaxies with moderate SFRs (see, e.g., the left-hand panel of Fig. 2). The possible contamination affects mostly the shortest Herschel wavelengths and may thus make the observed SEDs slightly bluer than those of lensed sources, leading to an underestimate of their photometric redshifts.
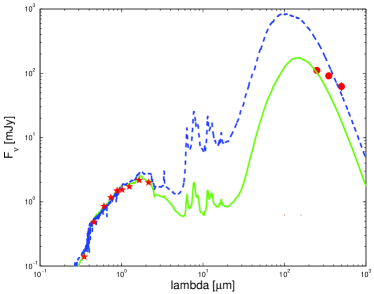
For the remaining three objects out the 14 with SDSS counterparts (HATLAS J090244.7 +013325 = SDP.112, HATLAS J091051.1+020121 = SDP.128, and HATLAS J090050.9+ 010942 = SDP.165) the data may be compatible with the optical counterparts being the genuine identifications and with them being at (one example is shown in the right-hand panel of Fig. 2). These objects have been conservatively removed from the sample, although further investigation may confirm some of them as valid SLG candidates.
The other 64 galaxies with , mJy and mJy are listed in Table 1. They constitute our parent sample of very bright, high redshift galaxies, among which we will search for the candidate SLGs. With this sample we also re-assess the bright end of the high- far-IR luminosity function, as discussed in the next section.
3 The bright tail of the high- far-IR luminosity function
3.1 Far-IR photometric redshifts
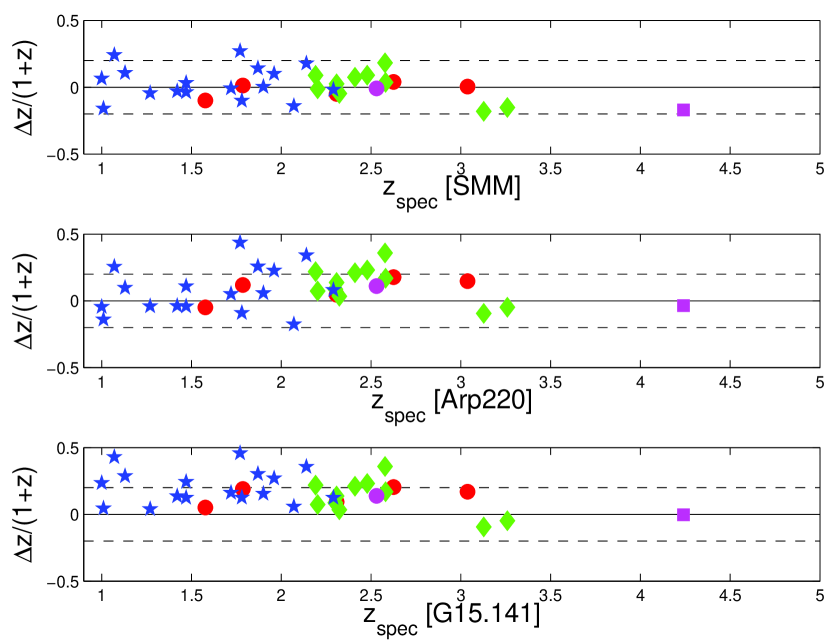
We estimate the redshifts of objects in our parent sample in the same way as Lapi et al. (2011). The redshift estimate is the result of a minimum fit of each of the SED templates (SMM J2135-01012, Arp220, G15.141) to the SPIRE and PACS (which are mostly upper limits) data. Possible effects that could introduce a bias in our photometric redshifts are discussed in Lapi et al. (2011).
In Fig. 4 we compare our photometric redshift estimates with spectroscopic measurements for the 36 H-ATLAS galaxies at for which spectroscopic redshifts are available. There is no indication that photometric redshifts are systematically under- or over-estimated when we use the SED of SMM J2135 as a template. The median value of is with a dispersion of 0.115 and, remarkably, there are no outliers. These values are close to, or slightly better than those found by Lapi et al. (2011) with fewer spectroscopic redshifts (24 rather than 36). The situation is only moderately worse in the case of Arp220: the median value of is 0.093 with a dispersion of 0.150. The median offset between photometric and spectroscopic redshifts increases to 0.158, with a dispersion of 0.124, if we use the cooler SED of G15.141. The three templates gives fits with similar values implying that it is not possible to further improve the photometric redshift precision without additional information.
As in Lapi et al. (2011) we adopted the SED of SMM J2135-0102 as our reference.
3.2 Far-IR luminosity functions
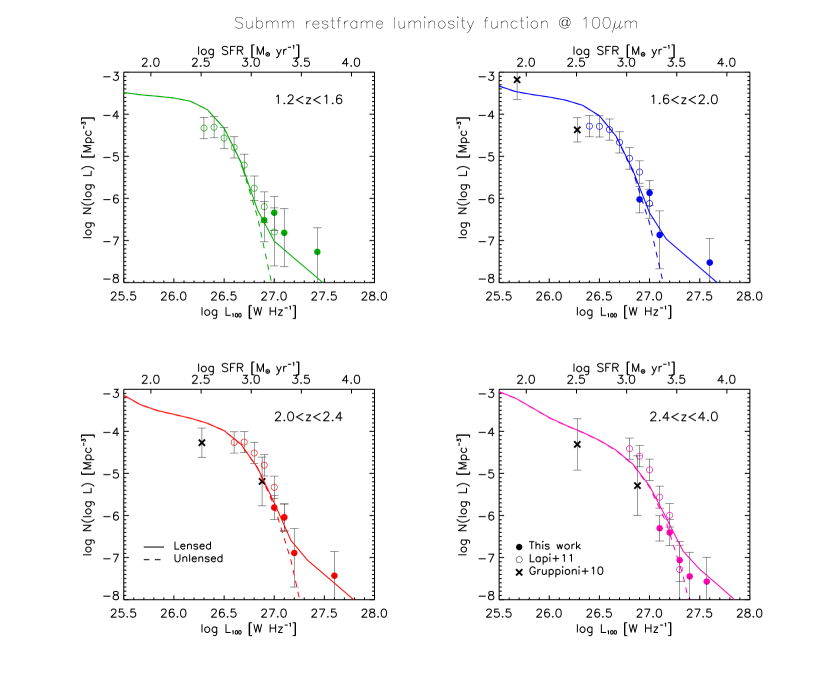
We have computed the contributions of the 64 galaxies of our parent sample to the luminosity functions at the rest-frame wavelength of m in same redshift intervals as in Lapi et al. (2011), namely , , , and . To do so we exploit the classical Schmidt (1968) estimator, together with redshift estimates and -corrections computed with the reference SED (SMM J2135-01012; see Fig. 5). The upper scale in this figure displays the SFR corresponding to the m luminosity for the SMM J2135-0102 calibration giving
| (1) |
(Lapi et al., 2011, assuming a Chabrier (2003) initial mass function). Since for galaxies with intense star formation the rest-frame dust emission peaks in the range m, the m luminosity is good estimator of the SFR.
Our estimates join smoothly with those of Lapi et al. (2011) at the lowest apparent (i.e. uncorrected for the effect of gravitational lensing) luminosities but show an indication of a flattening at the highest apparent luminosities. This flattening is expected as the effect of strong lensing, in analogy to what happens with the source counts. It was not present in Lapi et al. (2011) because all objects with SDSS counterparts were removed from their sample. Strongly lensed galaxies unavoidably dominate the highest apparent luminosity (or flux density) tail of the observed luminosity functions (or number counts), where the space (or surface) density of unlensed galaxies drops very rapidly. The flattening induced by these objects reflects the flatter slope of the sub-L∗ luminosity function (or the flattening of faint counts). The five strongly lensed galaxies identified by Negrello et al. (2010) fall on this part of the luminosity function.
Although there is a clear analogy between the behaviour of the luminosity functions and that of the source counts, the latter are integrated quantities. As a consequence, even in the case of modestly accurate photometric redshifts, the luminosity functions in redshift bins are a much stronger discriminator of strongly lensed galaxies than the number counts in flux density bins. This is the basis of our approach for extending the selection of candidate SLGs to fainter flux densities.
4 Identification of SLG candidates in the SDP area
4.1 Optical/near-IR counterparts
An important ingredient for our selection of candidate SLGs is the close association with a galaxy that may qualify as the lens. As we have seen, only 11 galaxies in our parent sample have such an association in the SDSS. The VIKING survey drastically improves the situation and indeed turns out to be well-suited for our purpose. VIKING is one of the public, large-scale surveys ongoing with VISTA, a 4-m class wide-field ESO telescope situated at the Paranal site in Chile (Emerson & Sutherland, 2010). It aims at covering around 1500 deg2 of the extragalactic sky, including the GAMA 9h, 12h, and 15h fields, plus both H-ATLAS South Galactic Pole (SGP) fields, in 5 broad-band filters, , , , , and . The median image quality is arcsec, and typical magnitude limits are , and in the Vega system.
We matched our objects with the preliminary object catalogues of the VIKING survey in the GAMA 9h field (Fleuren et al., 2011) within a search radius of . We found 106 possible VIKING counterparts to 58 of our 64 objects (). When there is more than one possible counterpart, we selected the one closest to the SPIRE position, that frequently coincides with the highest reliability () counterpart, as determined by Fleuren et al. (2011); of them have . Note that does not mean that the object is not an identification or a lens.
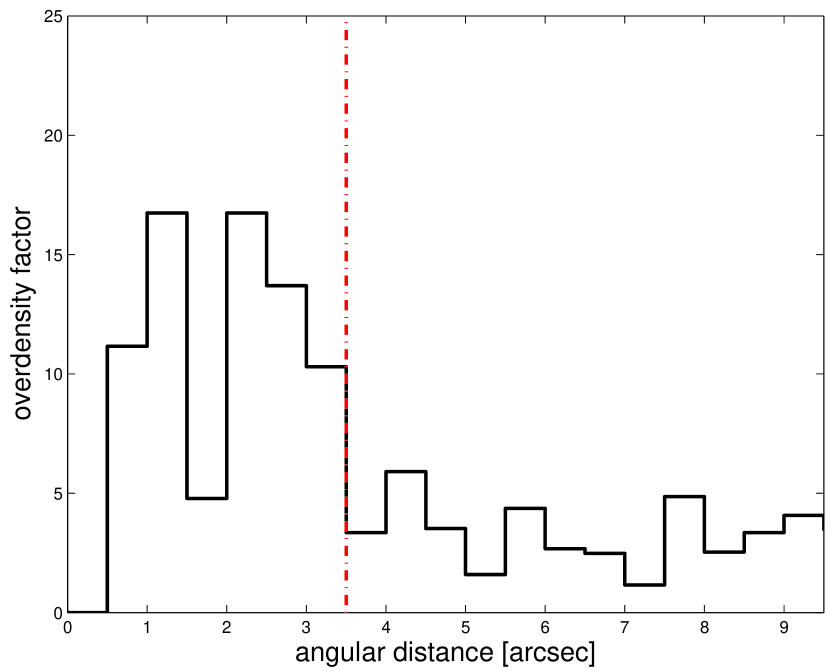
Figure 6 shows how the ratio of the mean surface density of matched VIKING galaxies to their overall mean density varies with the angular distance from objects in our parent sample. There is a clear overdensity for radii smaller than 3.5 arcsec, indicating a high likelihood of some physical relation between the VIKING and the sub-mm object: they may either be the same object or be related by lensing. Since 3.5 arcsec is roughly the angular distance between the lens and the lensed images where the separation distribution drops (Kochanek, 2006) we have selected as our primary candidate SLGs the H-ATLAS objects with a VIKING association within 3.5 arcsec, i.e. 34 objects. The object HATLAS J090739.1-003948 = SDP.639 has two close optical counterparts, one of which has a photometric redshift (), estimated by us, compatible with our photometric redshift of the H-ATLAS source (), and may thus be the identification of the lensed source, while the second has , and may be the lens.
The VIKING survey has provided the colors for 19 candidate lenses in our sample (see Fig. 7). With 5 exceptions (HATLAS J090957.6-003619 = SDP.72, HATLAS J090626.6+022612 = SDP.132, HATLAS J090931.8+000133 = SDP.257, HATLAS J090950.8+000427 = SDP.419, and HATLAS J090739.1-003948 = SDP.639) the colors of candidate lenses are consistent with them being passive early-type galaxies.
The counterpart of the object SDP.180 (HATLAS J090408.6+012610) has photometric data in only two bands ( and ). Since we could not determine whether or not it may be the true identification, we have conservatively dropped it from our sample of candidate lenses. This leaves us with 33 objects that have candidate VIKING lenses.
4.2 Photometric redshifts of candidate VIKING lenses
A substantial fraction of VIKING associations to H-ATLAS objects have either spectroscopic or (in most cases) photometric redshifts (Fleuren et al., 2011). The latter were obtained with the publicly available code ANNz (Collister & Lahav, 2004), combining the VIKING near-infrared photometry with the optical photometry from the SDSS. Above , where the training set for the neural networks used by ANNz is less rich, the code frequently fails to converge to a solution. This happens for a negligible fraction of galaxies in the whole VIKING catalogue but for a large fraction of our 33 objects (see Table 1). For the 23 objects in the parent sample without ANNz redshift and for 3 additional objects for which ANNz formally converges but gives exceedingly large errors (see Table 1) we have made our own photometric redshift estimates. To this end we have used a library of 16 SEDs of early-type galaxies§§§Four out of the 5 galaxies with blue colors have ANNz redshifts. The fifth has colours not far from those of an early-type galaxy, and redder than those of late-type galaxies., computed with GRASIL¶¶¶http://galsynth.oapd.inaf.it (Silva et al., 1998) with updated stellar populations. We ran two chemical models suitable for a typical early type galaxy, i.e. with an efficient star formation rate for the first Gyr, and passively evolving thereafter. The two chemical evolution models have a different metal enrichment history with a SFR-averaged metallicity and , respectively. For each chemical evolution model we have then computed a series of synthetic SEDs at eight selected ages, between 2 Gyr and 9 Gyr.
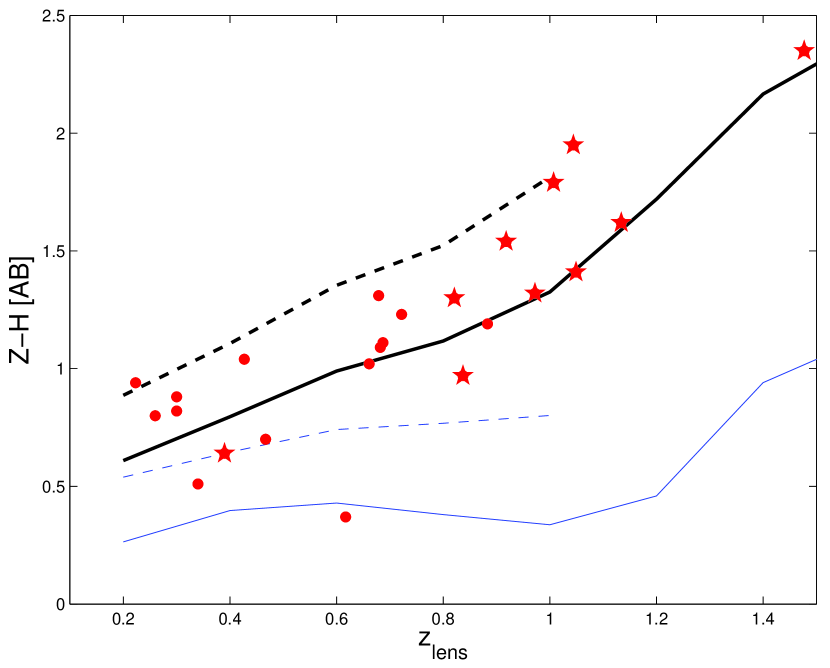
For each SED template the redshift was estimated through a minimum fit of the SDSS (available only for 5 of the 23+3 objects) and VIKING photometric data (including upper limits). The adopted photometric redshift is the median value obtained with the different SEDs and the associated error is the rms difference from the median (typically )∥∥∥For those objects with both ANNz and our () redshift estimates the median value of is with a dispersion of 0.16.. Note that, as illustrated by Fig. 7, the adoption of a late-type SED template would generally have implied much higher photometric redshifts (because a late-type galaxy can become that red only at high ) and, hence, extreme stellar masses.
Both theoretical expectations for objects in the redshift range considered here (see, e.g., Fig. 8) and observational data from surveys with a source redshift distribution similar to ours, namely the Cosmic Lens All-Sky Survey (CLASS, Browne et al., 2003), the SDSS Quasar Lens Search (SQLS, Oguri et al., 2006, 2008), and the COSMOS survey (Faure et al. 2008; Jackson 2008; see Fig. 7 of Treu 2010), indicate a cut-off at in the redshift distribution of lenses. Although the observed cut-off may be, at least partly, due to an observational bias (at low the lens galaxies are brighter and more extended, and may therefore confuse the images) we have conservatively dropped from our sample of strong candidate SLGs the two objects whose candidate deflectors are at (in any case, they are highlighted in Table 1 for follow-up purposes). An estimate of the “lens probability” for these objects is given in § 4.3.
4.3 Sample purity
Although we have been as conservative as possible in the selection of the candidate SLGs, some contamination of the sample is unavoidable. First, given the wide variety of galaxy SEDs, we cannot be absolutely sure that the VIKING counterparts of all our 31 strong candidates are foreground galaxies and not the identifications of sources themselves. However, only in a minority of cases (ID 9, 11, 53, 79, 122, 309) we find that with a fine tuning of parameters controlling the star-formation history and the dust re-emission spectrum we can roughly account for both the optical/near-IR and the Herschel photometric data assuming that they refer to the same source. But two of these galaxies (ID 9 and 11) were already shown by Negrello et al. (2011) to be strongly lensed. In these cases the lens galaxy was clearly identified and was found to have near-IR magnitudes close to those of the source. This suggests that some ambiguous cases can be misinterpreted in either direction: in a few cases VIKING counterparts interpreted as foreground lenses may be the genuine identifications of the sources; in other cases alleged identifications may be foreground lenses. Since also for the other 4 objects the interpretation of all the photometric data as referring to a single source is intricate and the fit is anyway poor, we have decided to keep them in our sample.
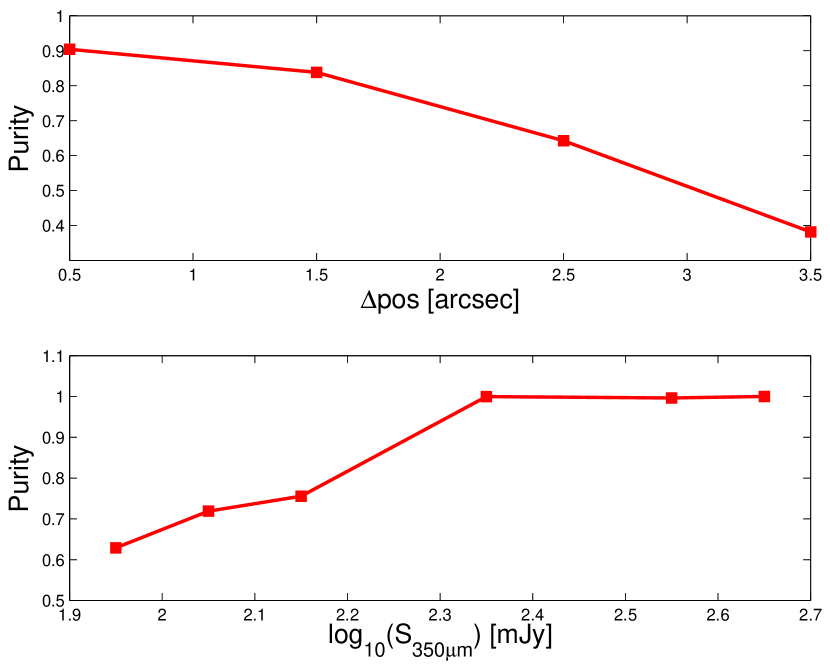
Second, given the uncertainties on the redshifts of candidate sources and lenses, on the mass and density profiles of the candidate lenses and, especially, on source positions, even if the VIKING sources are foreground galaxies they may not yield a strong (i.e. a factor of at least 2) gravitational amplification. The typical positional uncertainty of H-ATLAS sources with detections at m is , and decreases proportionally to (Rigby et al., 2011). With only one exception, all our strong candidates are detected at m with and their positional errors are therefore . For each source we have computed tentative estimates of the “lens probability”, i.e. of the probability of a “strong” gravitational amplification (). To this end we have adopted the photometric or measured redshifts of the candidate source and lens, have estimated the halo mass using (Williams et al., 2009) and from Moster et al. (2010) and Shankar et al. (2006), and have used a Single Isothermal Sphere (SIS) profile for the lens. The distribution of angular separations between the source and the VIKING counterparts was modeled as a Gaussian with mean equal to the nominal separation and dispersion . The lens probability was then obtained as the area of the Gaussian over the range of angular separations yielding . We define the “purity” of the sample, as a function of or of the angular separation, as the ratio between the sum of lens probabilities and the number of lensed candidates within each flux density or angular separation bin. The results are displayed in Fig. 10. As expected the “purity” declines with increasing angular separation and with decreasing flux density. The global “purity” of the sample is .
Although the “lens probabilities” of individual objects are quite uncertain and should therefore be used mainly for statistical purposes, e.g. to estimate the sample purity as made above, our analysis has picked out 4 objects, identified in Table 1, whose lensing probability is particularly low ( and down to ) and therefore are unlikely to be strongly lensed. Two of these objects (SDP.72 and SDP.257) have blue colors, indicative of a late-type galaxy; the other two (SDP.98 and SDP.290) are close to the adopted limit on the angular separation between the candidate source and the candidate lens (angular separation ). For the two objects whose candidate deflectors are at , and were excluded from the sample, the lensing probabilities are 0.4% (SDP.545) and 24% (SDP.354), confirming that they are not good SLG candidates.
4.4 Redshift distributions
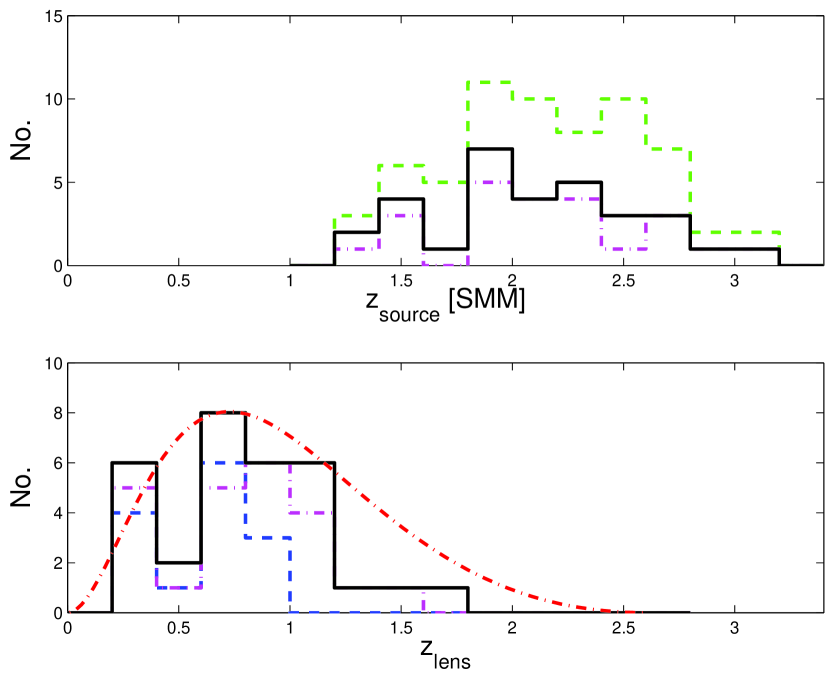
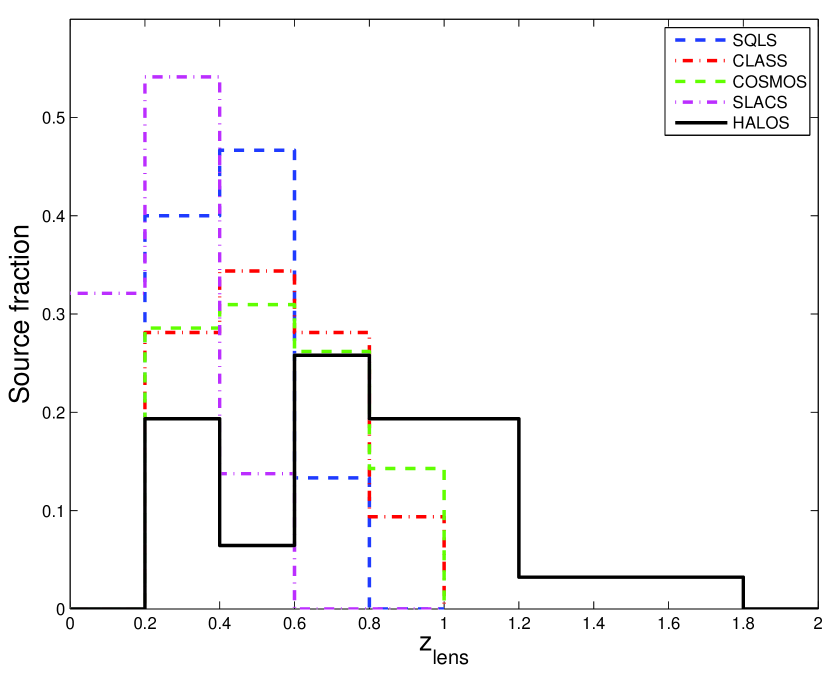
The global redshift distributions of the 31 SLG candidates and of the associated lenses are shown in Fig. 8. In the same figure we also show that dropping the 8 objects with the lowest estimated lens probabilities (probabilities ) does not substantially change the shape of the redshift distributions. Figure 9 compares the redshift distribution of our lens candidates with those of the CLASS, COSMOS, SLACS (Auger et al., 2009), and SQLS surveys, as given in Fig. 7 of Treu (2010). The main difference is that our lens candidates are found out to much higher redshifts than those of the other surveys. If confirmed (and the agreement with theoretical expectations is quite reassuring in this respect), this result implies that our selection allows one to substantially extend the redshift range over which gravitational lensing can be exploited to study the lens galaxy structure and its evolution. We note, in particular, that there is observational evidence of a strong size evolution of massive early type galaxies from (e.g. Trujillo et al. 2011 and references therein). The interpretation of this evolution is still controversial however (e.g., Oser et al. 2011; van Dokkum et al. 2010; Fan et al. 2008, 2010). Different models imply different predictions for the evolution of gravitational potential in the inner parts of the galaxies; gravitational lensing will provide a test for such predictions.
Most of the candidate lenses show an excess, mainly in the band, that can be attributed to the contribution of the background source, as directly seen in the HST images of bright strongly lensed galaxies (Negrello et al., 2012). This effect needs to be taken into account in the photometric redshift estimates of the candidate lenses, e.g. decreasing the weight of the magnitude. Whenever accurate multi-band photometry is available the point was ignored altogether in our photometric redshift estimates.
Our 31 SLG candidates are emphasized in boldface in Table 1, where we have also identified the 4 objects for which we have tentatively estimated a lens probability . The SLG candidates have high apparent luminosity (Fig. 5), high redshift (Fig. 8, top panel), and are associated with foreground galaxies, mostly with near-IR colors of early-type galaxies (Fig. 7), at angular separations arcsec (Fig. 6). The five confirmed SLGs from Negrello et al. (2010) are among our best candidates.
5 Selecting candidate SLGs from SPIRE data alone
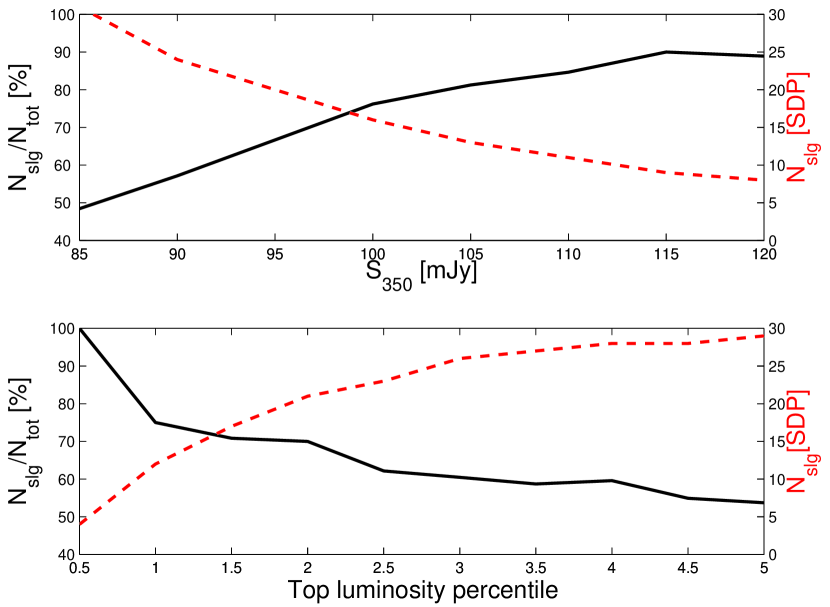
As discussed above, the VIKING data play a key role in the selection of our SLG candidates, since they allow us to identify the associated candidate lenses. Although the VIKING survey plans to cover , it will not cover the H-ATLAS North Galactic Pole field, and near-IR surveys to the same depth of the missing areas are not foreseen. However, a high efficiency selection of candidate strongly lensed sources fainter than mJy is possible using only SPIRE data. This is readily apparent from the previous results: almost 50% of objects selected with the criteria mJy, mJy, , and turn out to be strong candidate SLGs, in close agreement with the predictions of the Lapi et al. (2011) model. This is already an impressively high fraction, especially in consideration of how easily it is achieved. However, the selection efficiency can be further improved by exploiting the fact that SLGs dominate the highest apparent luminosity tail of the high- far-IR/sub-mm luminosity function (Fig. 5).
To investigate the potential of an approach relying only on Herschel/SPIRE photometry, we have computed, using the SED of SMM J2135, the photometric redshifts of SDP objects with mJy and above the limit, a sample almost completely overlapping the one defined by Lapi et al. (2011), except that the SDSS associations are not removed. The redshifts were split in bins of , and within each bin we have selected the objects with mJy, and apparent luminosity above a given percentile. In order to moderate the dependence of the results on a particular SED, we have repeated the procedure using the three SEDs discussed in § 3.1 and consider only the candidates selected by all the SEDs. Finally we require that objects have mJy and , like in § 2. Figure 11 (bottom panel) shows, as a fraction of the top apparent luminosity percentile, the percentage (left-hand scale) and the number (right-hand scale) of strongly lensed candidates, as identified in § 4. For example, about % of objects having apparent m luminosity in the top 2% (21 objects) were previously identified as strong SLG candidates.
6 Summary and conclusions
We have presented a simple method, that will be referred to as the Herschel-ATLAS Lensed Objects Selection (HALOS), that gives the prospect of identifying roughly 1.5–2 strong SLG candidates per square degree from the H-ATLAS survey, i.e. about 1000 over the full survey area. This amounts to a factor –6 increase compared to the surface density of SLGs brighter than mJy, whose selection has proven to be easy. Samples of thousands of strongly lensed systems are needed to make substantial progress on several major astrophysical and cosmological issues, as stressed by Treu (2010). Also, the extension to fainter flux densities is crucial to pick up galaxies representative of the bulk of the star-forming galaxy population at 1–3, that without the upthrust of strong lensing are fainter than the SPIRE confusion limit.
The method appeals to the fact that strongly lensed galaxies inevitably dominate the highest apparent luminosity tail of the high- luminosity function. The first step is therefore to pick up high apparent luminosity and high- galaxies. The primary selection, based on SPIRE photometry (mJy, mJy, , and ), has yielded a sample of 74 objects in the H-ATLAS SDP field of . After having rejected intruders of various types (see § 2) we are left with a sample of 64 objects, with estimated redshifts . This sample has allowed us to re-assess the brightest portion of the apparent m luminosity function in the same 4 redshift bins (, , , ) of Lapi et al. (2011), whose sample was biased against SLGs because of the rejection of all objects with SDSS counterparts, some of which may be the foreground lenses. The new estimate of the luminosity function shows indications of a flattening at the highest apparent luminosities as expected, on the basis of the Lapi et al. (2011) model coupled with the formalism by Perrotta et al. (2002), as the effect of the contribution of SLGs. This flattening reflects the flatter slope of the sub-L∗ luminosity function, and confirms that our approach has the potential of allowing us to investigate more typical high- star-forming galaxies.
To identify the candidate SLGs we have looked for close associations (within 3.5 arcsec) with VIKING galaxies that may qualify as being the lenses. We found 34 such associations. The optical/near-IR data for 32 of these objects were found to be incompatible (or, in 4 cases, hardly compatible) with them being the identifications of the H-ATLAS objects. Another object has two close VIKING counterparts, one of which may be the identification and the other may be the lens. We kept this object as a candidate SLG. The VIKING data on the counterpart of the last of the 34 objects are insufficient to decide whether it is a likely lens, and we conservatively dropped it.
Again to be conservative we have further restricted the sample of candidate SLGs to objects whose VIKING counterparts have redshifts since this seems to be a lower limit to lens redshifts found in previous surveys, although there is nothing, in principle, that prevents a object at from being a lens. Thus, the 2 objects with VIKING counterparts at should also be taken into account for follow-up observations. In this way, we end up with at least 31 high apparent luminosity and high- SDP objects, corresponding to a surface density of , that appear to be physically associated with foreground galaxies that are most likely the lenses.
Using the available data we have carried out, for each object, a tentative estimate of the probability that it is strongly lensed, i.e. has a gravitational amplification , and of the purity of the sample as a function of the angular separation between the candidate source and the candidate lens and of the source flux density. The global purity of the sample is estimated to be 72%. Although, given the many uncertainties, not much weight should be attached to the lens probabilities of individual objects, we have picked out 4 cases with particularly low lens probabilities ().
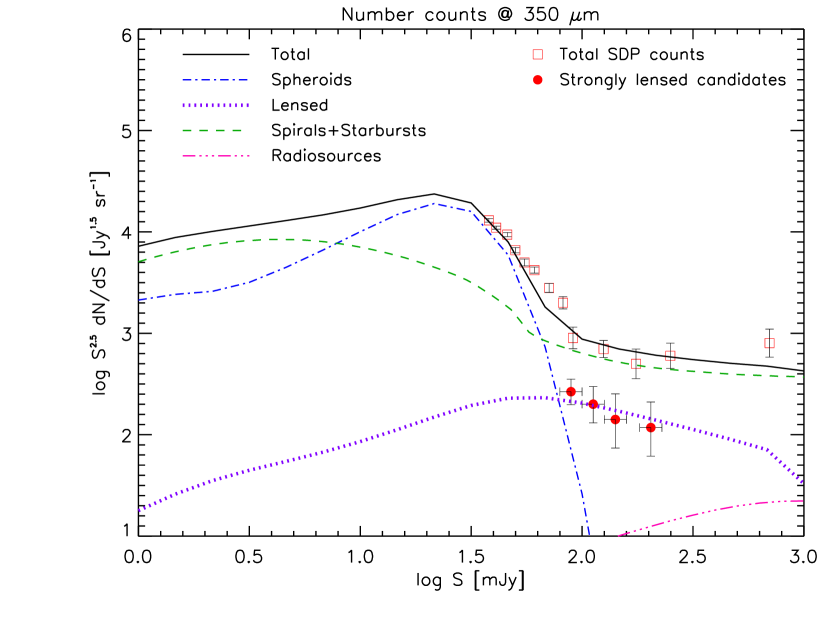
The number counts of candidate SLGs, corrected for the flux-density dependent purity, are shown in Fig. 12, where model predictions are also plotted for comparison; the agreement is good. The model indicates that the counts of candidate SLGs with mJy are mostly contributed by amplifications .
As pointed out by Treu et al. (2011) % of the lenses discovered by SLACS are massive early-type galaxies (Auger et al., 2009): only 10 of the 85 SLACS lenses have visible spiral morphology. While our approach with HALOS is completely different from the one used in SLACS and SWELLS, it is interesting that we obtain a similar ratio between blue (likely late-type) and red (likely early-type) lens galaxies.
Excluding the candidate SLGs from the initial sample, we can constrain the bright end of the luminosity function of unlensed galaxies, which turns out to be extremely steep, as expected if these galaxies are indeed proto-spheroidal galaxies in the process of forming most of their stars in a single gigantic starburst (Granato et al., 2004; Lapi et al., 2011).
The estimated redshift distribution of our candidate lensed galaxies extends up to and is similar to those of other searches for strongly lensed sources, like CLASS (Browne et al., 2003), SQLS (Oguri et al., 2006, 2008), and COSMOS (Faure et al., 2008; Jackson, 2008). On the other hand, our lenses are found up to –1.8 (with a peak at ), while in the case of the other surveys they are confined to . We caution however that the redshift estimates are photometric, and need to be confirmed by spectroscopic measurements. If this lens redshift distribution will be validated, our selection will allow us to substantially extend the redshift range over which gravitational lensing can be exploited to study the lens galaxy mass and structure, and their evolution. In this respect, it is reassuring that the observed redshift distribution appears consistent with expectations from the model (see Fig. 8).
The five brightest sources among the 31 best SLG candidates were already shown to be strongly lensed galaxies through an intense multi-instrument observational campaign (Negrello et al., 2010). As for the fainter ones, we envisage a follow-up strategy comprising several steps. First we need a spectroscopic confirmation that they are at the high redshifts indicated by our photometric estimates. Millimeter-wave spectroscopy of CO transitions proved to be very effective not only for redshift measurements but also for providing dynamical information and gas masses (e.g. Harris et al., 2012, and references therein). A comparison with expectations from the empirical relationship between CO luminosity and line-width for unlensed galaxies (Bothwell et al., 2012; Harris et al., 2012) provides a first indication for or against the presence of gravitational amplification and, in the positive case, an estimate of its amplitude. Deep high resolution imaging is obviously necessary to establish the lensing nature of the sources by revealing and mapping the lensed images (arcs). This has been done, although for brighter sources, in the optical/near-IR (Fu et al., 2012; Negrello et al., 2012) and at (sub)-millimeter wavelengths (Riechers et al., 2011; Bussmann et al., 2012). The latter have the great advantage that the images are little affected by, or totally immune to the effect of the lensing galaxies (which, as mentioned above, are mostly passive, early type galaxies). ALMA overcomes the problem of the limiting sensitivity of earlier (sub)-mm instruments allowing one to make very deep, high resolution images, thus making possible a detailed study of the internal structure and dynamics of the lensed galaxies.
A preliminary estimate of the “purity” of the sample, using the available information on candidate sources and on candidate lenses, yield a global purity of 72%. The estimated “purity” is found to decrease with increasing angular separation between the candidate source and the candidate lens and with decreasing flux density of candidate sources. The objects that will eventually turn out not to be SLGs would be in any case interesting targets for follow-up: Fig. 5 shows that all our SLG candidates have apparent star-formation rates of thousands , i.e. apparent far-IR luminosities of a few to several times . Therefore if their emission is not amplified by a factor , they would be among the brightest ultra-luminous infrared galaxies.
References
- Auger et al. (2009) Auger, M. W., Treu, T., Bolton, A. S., Gavazzi, R., Koopmans, L. V. E., Marshall, P. J., Bundy, K., & Moustakas, L. A. 2009, ApJ, 705, 1099
- Blain (1996) Blain, A. W. 1996, MNRAS, 283, 1340
- Bonfield et al. (2011) Bonfield, D. G., et al. 2011, MNRAS, 416, 13
- Bothwell et al. (2012) Bothwell, M., et al. 2012, in preparation
- Browne et al. (2003) Browne, I. W. A., et al. 2003, MNRAS, 341, 13
- Bussmann et al. (2012) Bussmann, R., et al. 2012, in preparation
- Chabrier (2003) Chabrier, G. 2003, PASP, 115, 763
- Clements et al. (2010) Clements, D. L., et al. 2010, A&A, 518, L8
- Collister & Lahav (2004) Collister, A. A., & Lahav, O. 2004, PASP, 116, 345
- Cox et al. (2011) Cox, P., et al. 2011, ArXiv e-prints
- de Zotti et al. (2005) de Zotti, G., Ricci, R., Mesa, D., Silva, L., Mazzotta, P., Toffolatti, L., & González-Nuevo, J. 2005, A&A, 431, 893
- Eales et al. (2010) Eales, S., et al. 2010, PASP, 122, 499
- Emerson & Sutherland (2010) Emerson, J. P., & Sutherland, W. J. 2010, in Society of Photo-Optical Instrumentation Engineers (SPIE) Conference Series, Vol. 7733, Society of Photo-Optical Instrumentation Engineers (SPIE) Conference Series
- Fan et al. (2010) Fan, L., Lapi, A., Bressan, A., Bernardi, M., De Zotti, G., & Danese, L. 2010, ApJ, 718, 1460
- Fan et al. (2008) Fan, L., Lapi, A., De Zotti, G., & Danese, L. 2008, ApJ, 689, L101
- Faure et al. (2008) Faure, C., et al. 2008, ApJS, 176, 19
- Fleuren et al. (2011) Fleuren, S., et al. 2011, in preparation
- Förster Schreiber et al. (2009) Förster Schreiber, N. M., et al. 2009, ApJ, 706, 1364
- Fu et al. (2012) Fu, M., et al. 2012, in preparation
- González-Nuevo et al. (2010) González-Nuevo, J., et al. 2010, A&A, 518, L38
- Granato et al. (2004) Granato, G. L., De Zotti, G., Silva, L., Bressan, A., & Danese, L. 2004, ApJ, 600, 580
- Griffin et al. (2010) Griffin, M. J., et al. 2010, A&A, 518, L3
- Gruppioni et al. (2010) Gruppioni, C., et al. 2010, A&A, 518, L27
- Harris et al. (2012) Harris, A., et al. 2012, ApJ, submitted
- Ibar et al. (2010) Ibar, E., et al. 2010, MNRAS, 409, 38
- Ivison et al. (2010) Ivison, R. J., et al. 2010, A&A, 518, L35
- Jackson (2008) Jackson, N. 2008, MNRAS, 389, 1311
- Kochanek (2006) Kochanek, C. S. 2006, Strong Gravitational Lensing, ed. Schneider, P., Kochanek, C. S., & Wambsganss, J., 91
- Koopmans et al. (2004) Koopmans, L. V. E., Browne, I. W. A., & Jackson, N. J. 2004, New A Rev., 48, 1085
- Lapi et al. (2011) Lapi, A., et al. 2011, ApJ, 742, 24
- Lima et al. (2010) Lima, M., Jain, B., & Devlin, M. 2010, MNRAS, 406, 2352
- Massardi et al. (2011) Massardi, M., et al. 2011, in preparation
- Moster et al. (2010) Moster, B. P., Somerville, R. S., Maulbetsch, C., van den Bosch, F. C., Macciò, A. V., Naab, T., & Oser, L. 2010, ApJ, 710, 903
- Negrello et al. (2007) Negrello, M., Perrotta, F., González-Nuevo, J., Silva, L., de Zotti, G., Granato, G. L., Baccigalupi, C., & Danese, L. 2007, MNRAS, 377, 1557
- Negrello et al. (2010) Negrello, M., et al. 2010, Science, 330, 800
- Negrello et al. (2012) —. 2012, in preparation
- Oguri & Marshall (2010) Oguri, M., & Marshall, P. J. 2010, MNRAS, 405, 2579
- Oguri et al. (2006) Oguri, M., et al. 2006, AJ, 132, 999
- Oguri et al. (2008) —. 2008, AJ, 135, 512
- Oser et al. (2011) Oser, L., Naab, T., Ostriker, J. P., & Johansson, P. H. 2011, ArXiv e-prints
- Paciga et al. (2009) Paciga, G., Scott, D., & Chapin, E. L. 2009, MNRAS, 395, 1153
- Pascale et al. (2011) Pascale, E., et al. 2011, MNRAS, 415, 911
- Perrotta et al. (2002) Perrotta, F., Baccigalupi, C., Bartelmann, M., De Zotti, G., & Granato, G. L. 2002, MNRAS, 329, 445
- Perrotta et al. (2003) Perrotta, F., Magliocchetti, M., Baccigalupi, C., Bartelmann, M., De Zotti, G., Granato, G. L., Silva, L., & Danese, L. 2003, MNRAS, 338, 623
- Pilbratt et al. (2010) Pilbratt, G. L., et al. 2010, A&A, 518, L1
- Poglitsch et al. (2010) Poglitsch, A., et al. 2010, A&A, 518, L2
- Riechers et al. (2011) Riechers, D. A., et al. 2011, ApJ, 733, L12
- Rigby et al. (2011) Rigby, E. E., et al. 2011, MNRAS, 415, 2336
- Schmidt (1968) Schmidt, M. 1968, ApJ, 151, 393
- Shankar et al. (2006) Shankar, F., Lapi, A., Salucci, P., De Zotti, G., & Danese, L. 2006, ApJ, 643, 14
- Silva et al. (1998) Silva, L., Granato, G. L., Bressan, A., & Danese, L. 1998, ApJ, 509, 103
- Smith et al. (2011a) Smith, D. J. B., et al. 2011a, MNRAS, 1229
- Smith et al. (2011b) —. 2011b, in preparation
- Sutherland et al. (2011) Sutherland, W., et al. 2011, in preparation
- Swinbank et al. (2010) Swinbank, A. M., et al. 2010, Nature, 464, 733
- Thompson et al. (2011) Thompson, M., et al. 2011, in preparation
- Treu (2010) Treu, T. 2010, ARA&A, 48, 87
- Treu et al. (2011) Treu, T., Dutton, A. A., Auger, M. W., Marshall, P. J., Bolton, A. S., Brewer, B. J., Koo, D., & Koopmans, L. V. E. 2011, ArXiv e-prints
- Trujillo et al. (2011) Trujillo, I., Ferreras, I., & de La Rosa, I. G. 2011, MNRAS, 415, 3903
- van Dokkum et al. (2010) van Dokkum, P. G., et al. 2010, ApJ, 709, 1018
- Vieira et al. (2010) Vieira, J. D., et al. 2010, ApJ, 719, 763
- Williams et al. (2009) Williams, M. J., Bureau, M., & Cappellari, M. 2009, MNRAS, 400, 1665
| H-ATLAS | SDP | S[mJy] | ) | () | () | pos | ||||
|---|---|---|---|---|---|---|---|---|---|---|
| ID | 500m | 350m | 250m | [SMM] | [SMM] | [SDSS] | [VIKING] | [arcsec] | ||
| J090740.0-004200 | 9NNConfirmed strongly lensed galaxy (Negrello et al., 2010). | 183 ( 9) | 358 ( 8) | 507 ( 7) | 1.58 (0.01) | 27.38 (0.30) | 0.69 (0.13)V | 1.33 | 1.11 | 0.34 |
| J091043.0-000321 | 11NNConfirmed strongly lensed galaxy (Negrello et al., 2010). | 249 (10) | 403 ( 8) | 462 ( 7) | 1.79 (0.01) | 27.59 (0.31) | 0.72 (0.37)V | 1.93 | 1.23 | 0.98 |
| J090302.9-014127 | 17NNConfirmed strongly lensed galaxy (Negrello et al., 2010). | 230 ( 9) | 342 ( 8) | 343 ( 7) | 3.04 (0.01) | 27.60 (0.28) | 0.68 (0.40)V | 0.72 | 1.31 | 1.77 |
| J091331.3-003642 | 44 | 89 (10) | 151 ( 8) | 187 ( 7) | 1.50 (0.30) | 27.03 (0.30) | 0.30 (0.01)S | 1.45 | 0.88 | 1.79 |
| J090051.0+015049 | 53 | 54 (10) | 120 ( 8) | 177 ( 7) | 1.32 (0.28) | 26.92 (0.32) | 1.01 (0.09)H | – | 1.79 | 1.40 |
| J090952.9-010811 | 60 | 90 ( 9) | 131 ( 8) | 159 ( 7) | 1.54 (0.40) | 26.99 (0.38) | 0.22 (0.02)V | 1.09 | 0.94 | 3.03 |
| J091341.4-004342 | 62 | 72 ( 9) | 124 ( 8) | 159 ( 7) | 1.53 (0.30) | 26.98 (0.28) | 1.07 (0.09)H | – | 1.53 | 3.85 |
| J090957.6-003619 | 72a,ba,bfootnotemark: | 83 ( 9) | 129 ( 8) | 132 ( 7) | 1.91 (0.46) | 27.09 (0.39) | 0.47 (0.18)V | 0.91 | 0.70 | 1.91 |
| J090749.7-003807 | 79 | 69 ( 9) | 113 ( 8) | 140 ( 7) | 1.48 (0.34) | 26.90 (0.34) | 1.05 (0.08)H | – | 1.41 | 2.50 |
| J090311.6+003906 | 81NNConfirmed strongly lensed galaxy (Negrello et al., 2010). | 173 (10) | 202 ( 8) | 135 ( 7) | 2.63 (0.01) | 27.60 (0.31) | 0.30 (0.01)S | 1.67 | 0.82 | 0.73 |
| J090356.8+002310 | 87 | 64 ( 9) | 115 ( 8) | 131 ( 7) | 1.42 (0.36) | 26.84 (0.37) | 0.42 (0.05)V | 2.22 | 1.71 | 4.21 |
| J090448.8+021646 | 98bbTentative lens probability . | 52 ( 9) | 97 ( 8) | 126 ( 7) | 1.47 (0.29) | 26.85 (0.29) | 0.63 (0.07)H | – | – | 3.10 |
| J090033.8+001957 | 103 | 44 ( 9) | 94 ( 8) | 125 ( 7) | 1.33 (0.28) | 26.77 (0.31) | 0.55 (0.16)V | 1.58 | 1.37 | 5.97 |
| J090459.3+020837 | 104 | 66 ( 9) | 102 ( 8) | 111 ( 7) | 1.79 (0.41) | 26.96 (0.39) | 0.34 (0.06)V | 0.53 | 0.04 | 9.43 |
| J091056.5-002919 | 122 | 54 ( 9) | 98 ( 8) | 116 ( 7) | 1.68 (0.31) | 26.93 (0.29) | 1.04 (0.14)H | – | 1.95 | 2.35 |
| J091521.5-002443 | 126 | 82 ( 9) | 106 ( 8) | 116 ( 7) | 2.19 (0.42) | 27.15 (0.31) | 1.01 (0.36)H | – | – | 0.98 |
| J090542.0+020733 | 127 | 58 (10) | 100 ( 8) | 112 ( 7) | 1.82 (0.33) | 26.98 (0.31) | 0.87 (0.32)V | 0.39 | – | 1.02 |
| J091304.9-005343 | 130NNConfirmed strongly lensed galaxy (Negrello et al., 2010). | 112 ( 9) | 141 ( 8) | 110 ( 7) | 2.30 (0.01) | 27.39 (0.29) | 0.26 (0.01)S | 1.28 | 0.80 | 2.35 |
| J090626.6+022612 | 132 | 71 ( 9) | 99 ( 8) | 113 ( 7) | 2.01 (0.42) | 27.06 (0.34) | 0.84 (0.14)H | 0.36 | 0.97 | 1.11 |
| J090459.9+015043 | 153 | 62 ( 9) | 88 ( 8) | 110 ( 7) | 1.74 (0.42) | 26.93 (0.40) | 0.36 (0.03)V | 1.27 | 1.05 | 6.57 |
| J090408.6+012610 | 180 | 46 (10) | 95 ( 8) | 103 ( 7) | 1.79 (0.36) | 26.93 (0.34) | 1.29 (0.20)H | – | – | 2.51 |
| J090403.9+005619 | 183 | 50 ( 9) | 87 ( 8) | 104 ( 7) | 1.69 (0.31) | 26.88 (0.30) | 0.31 (0.02)V | 1.04 | 0.88 | 4.08 |
| J090653.3+023207 | 189 | 64 ( 9) | 95 ( 8) | 102 ( 7) | 2.08 (0.37) | 27.05 (0.29) | 1.02 (0.10)H | 1.25 | 1.88 | 5.16 |
| J090707.9-003134 | 191 | 56 (10) | 95 ( 8) | 102 ( 7) | 1.94 (0.34) | 26.99 (0.30) | 1.11 (0.06)H | – | – | 2.01 |
| J091305.1-001409 | 194 | 62 ( 9) | 97 ( 8) | 95 ( 7) | 2.18 (0.37) | 27.06 (0.27) | 0.47 (0.04)V | 2.50 | 1.06 | 7.31 |
| J090732.3-005207 | 217 | 52 ( 9) | 103 ( 8) | 91 ( 7) | 2.13 (0.47) | 27.02 (0.35) | 1.13 (0.16)H | – | 1.62 | 2.78 |
| J091354.6-004539 | 219 | 50 ( 9) | 87 ( 8) | 92 ( 7) | 1.95 (0.34) | 26.95 (0.30) | 0.42 (0.10)V | 1.50 | 0.72 | 5.67 |
| J090504.8+000800 | 225 | 71 ( 9) | 97 ( 8) | 97 ( 7) | 2.18 (0.46) | 27.07 (0.33) | – | – | – | – |
| J090308.3-000420 | 227 | 55 (10) | 95 ( 8) | 99 ( 7) | 1.98 (0.35) | 26.99 (0.29) | 0.88 (0.07)H | – | 1.44 | 7.47 |
| J090705.7+002128 | 237 | 64 (10) | 92 ( 8) | 90 ( 7) | 2.28 (0.38) | 27.08 (0.27) | 1.37 (0.23)H | – | – | 2.56 |
| J090433.4-010740 | 238 | 70 ( 9) | 104 ( 8) | 84 ( 7) | 2.52 (0.44) | 27.17 (0.33) | 0.15 (0.12)VH | 0.61 | 0.19 | 7.58 |
| J090239.0+002819 | 249 | 48 ( 9) | 85 ( 8) | 97 ( 7) | 1.81 (0.32) | 26.91 (0.31) | 0.43 (0.16)H | – | 1.04 | 8.03 |
| J090931.8+000133 | 257a,ba,bfootnotemark: | 56 (10) | 88 ( 8) | 92 ( 7) | 1.91 (0.54) | 26.93 (0.45) | 0.34 (0.21)V | 0.46 | 0.51 | 2.37 |
| J090459.0-012911 | 265 | 44 ( 9) | 88 ( 8) | 92 ( 7) | 1.87 (0.37) | 26.91 (0.34) | 0.97 (0.07)H | – | 1.32 | 2.30 |
| J091148.2+003355 | 290bbTentative lens probability . | 72 ( 9) | 102 ( 8) | 90 ( 7) | 2.45 (0.40) | 27.16 (0.29) | 0.74 (0.20)V | 1.41 | – | 3.05 |
| J090319.6+015635 | 301 | 61 ( 9) | 89 ( 8) | 87 ( 7) | 2.26 (0.38) | 27.06 (0.27) | 0.82 (0.07)H | – | 1.30 | 2.20 |
| J090405.3-003331 | 302 | 76 (10) | 98 ( 8) | 85 ( 7) | 2.57 (0.41) | 27.19 (0.31) | 0.66 (0.08)VH | 0.67 | 1.04 | 4.42 |
| J085751.3+013334 | 309 | 64 (10) | 90 ( 8) | 88 ( 7) | 2.29 (0.38) | 27.08 (0.28) | 1.78 (0.10)H | – | – | 2.11 |
| J085900.3+001405 | 312 | 50 (10) | 92 ( 8) | 89 ( 7) | 2.06 (0.39) | 26.98 (0.31) | – | – | – | – |
| J091351.7-002340 | 327 | 48 (10) | 89 ( 8) | 90 ( 7) | 1.99 (0.37) | 26.95 (0.31) | 0.88 (0.42)V | 0.47 | 1.19 | 1.89 |
| J090446.4+022218 | 329 | 61 ( 9) | 86 ( 8) | 87 ( 7) | 2.24 (0.38) | 27.05 (0.28) | 0.26 (0.05)V | 0.67 | 0.67 | 9.09 |
| J091003.5+021028 | 340 | 46 ( 9) | 86 ( 8) | 87 ( 7) | 1.97 (0.37) | 26.93 (0.31) | – | – | – | – |
| J090429.6+002935 | 354ccThe optical counterpart is local, . | 60 (10) | 86 ( 8) | 85 ( 7) | 2.18 (0.60) | 27.01 (0.44) | 0.18 (0.01)V | 3.32 | 0.62 | 3.16 |
| J090032.7+004316 | 383 | 50 (10) | 85 ( 8) | 85 ( 7) | 2.08 (0.36) | 26.97 (0.28) | 0.52 (0.14)V | 0.98 | 1.24 | 3.85 |
| J090613.7-010044 | 390 | 69 ( 9) | 86 ( 8) | 79 ( 7) | 2.52 (0.41) | 27.14 (0.31) | – | – | – | – |
| J090453.2+022018 | 392 | 88 ( 9) | 107 ( 8) | 83 ( 7) | 2.80 (0.44) | 27.28 (0.29) | 0.66 (0.11)V | 2.01 | 1.02 | 1.97 |
| J085855.3+013728 | 393 | 68 ( 9) | 92 ( 8) | 80 ( 7) | 2.51 (0.40) | 27.14 (0.30) | 1.48 (0.17)H | – | 2.35 | 1.43 |
| J090346.1+013428 | 396 | 68 ( 9) | 91 ( 8) | 79 ( 7) | 2.53 (0.41) | 27.15 (0.30) | – | – | – | – |
| J090954.6+001754 | 407 | 76 (10) | 111 ( 8) | 83 ( 7) | 2.67 (0.48) | 27.23 (0.33) | 0.68 (0.25)V | – | 1.09 | 2.11 |
| J090440.0-013439 | 414 | 76 ( 9) | 98 ( 8) | 76 ( 7) | 2.75 (0.44) | 27.22 (0.30) | – | – | – | – |
| J090950.8+000427 | 419aaThe optical counterpart has colors compatible with those of a late-type galaxy. | 68 ( 9) | 92 ( 8) | 81 ( 7) | 2.50 (0.40) | 27.14 (0.30) | 0.62 (0.31)V | 0.69 | 0.37 | 2.46 |
| J090204.1-003829 | 436 | 61 ( 9) | 87 ( 8) | 79 ( 7) | 2.40 (0.39) | 27.08 (0.29) | – | – | – | – |
| J090930.4+002224 | 462 | 57 ( 9) | 85 ( 8) | 76 ( 7) | 2.39 (0.40) | 27.06 (0.29) | 1.00 (0.10)H | – | 1.71 | 4.89 |
| J090409.4+010734 | 476 | 55 (10) | 86 ( 8) | 79 ( 7) | 2.29 (0.39) | 27.03 (0.28) | 0.92 (0.09)VH | 0.22 | 1.54 | 2.76 |
| J090310.6+015149 | 503 | 71 ( 9) | 105 ( 8) | 77 ( 7) | 2.69 (0.49) | 27.20 (0.34) | 1.00 (0.07)H | – | 1.66 | 4.26 |
| J085859.2+002818 | 512 | 52 ( 9) | 85 ( 8) | 77 ( 7) | 2.28 (0.41) | 27.01 (0.29) | 0.43 (0.03)V | 1.56 | 1.04 | 2.96 |
| J090530.4+012800 | 514 | 65 ( 9) | 90 ( 8) | 78 ( 7) | 2.51 (0.41) | 27.13 (0.30) | 0.49 (0.07)V | 2.84 | 1.01 | 5.38 |
| J090818.9+023330 | 515 | 57 (10) | 92 ( 8) | 77 ( 7) | 2.42 (0.44) | 27.08 (0.32) | – | – | – | – |
| J090441.5+015154 | 545ccThe optical counterpart is local, . | 70 (10) | 87 ( 8) | 76 ( 7) | 2.60 (0.42) | 27.16 (0.31) | -0.02 (0.02)H | – | 0.29 | 3.21 |
| J090739.1-003948 | 639aaThe optical counterpart has colors compatible with those of a late-type galaxy. | 81 ( 9) | 99 ( 8) | 73 ( 7) | 2.89 (0.45) | 27.25 (0.28) | 0.39 (0.15)H | – | 0.64 | 0.82 |
| J091257.2+000300 | 700 | 87 (10) | 96 ( 8) | 69 ( 7) | 3.03 (0.46) | 27.29 (0.27) | – | – | – | – |
| J090819.1-002026 | 751 | 66 (10) | 93 ( 8) | 69 ( 7) | 2.71 (0.47) | 27.16 (0.32) | – | – | – | – |
| J090813.0-003657 | 775 | 65 (10) | 88 ( 8) | 66 ( 7) | 2.74 (0.45) | 27.16 (0.31) | – | – | – | – |
| J085908.5+011320 | 910 | 70 (10) | 87 ( 8) | 67 ( 7) | 2.81 (0.44) | 27.19 (0.29) | 0.94 (0.08)H | – | 1.50 | 5.47 |
Note. — The subscript next to the lens redshift indicates its origin: ‘V’ for VIKING, ‘H’ for H-ATLAS (this work), ‘VH’ for galaxies whose redshifts were re-estimated by us because the VIKING estimate has exceedingly large errors (, , for SDP.238, SDP.302, and SDP.476, respectively), and ‘S’ for spectroscopic measurements.