1–12
High-energy emission from galaxies:
the star-formation/gamma-ray connection
Abstract
The impact of non-thermal processes on the spectral energy distributions of galaxies can be dramatic, but such processes are often neglected in considerations of their structure and evolution. Particle acceleration associated with high mass star formation and AGN activity not only leads to very broad band (radio--ray) emission, but may also produce very significant feedback effects on galaxies and their environment. The recent detections of starburst galaxies at GeV and TeV energies suggest that -ray instruments have now reached the critical level of sensitivity to probe the connection between particle acceleration and star-formation in galaxies. In this paper we will try to summarise this recent progress, put it into a multi-wavelength context and also discuss the prospects for more precise and sensitive -ray measurements with the upcoming CTA observatory.
keywords:
acceleration of particles, radiation mechanisms: non-thermal, (stars:) supernovae: general, (ISM:) cosmic rays, Galaxy: center, galaxies: starburst, gamma rays: observations, gamma rays: theory1 Introduction
The most dramatic examples of high-energy emission from galaxies are found in Active Galactic Nuclei (AGN), where particle acceleration occurs in jets powered by supermassive black holes. In such systems non-thermal emission is often seen across the whole electromagnetic spectrum (in systems where the jets are aligned with the line-of-sight to the observer – commonly known as blazars). In the more common case that jets are not aligned to the observer, non-thermal dominance occurs only in the radio, X-ray and -ray domains. The high-energy emission of these objects has been discussed by many authors (see e.g. [Wagner (2008)] for a compilation of VHE -ray blazars), here we focus on the less dramatic, but potentially very importent non-thermal emission of “inactive” galaxies, where the spectral energy distribution (SED) is dominated by stellar processes.
In the Milky Way (MW), we know that the population of ultra-relativistic particles, known as cosmic rays (CRs), plays an important dynamical role; being close to pressure equilibrium with thermal gas and magnetic fields in the Interstellar Medium (ISM). Our knowledge of this population has in the past come largely from direct (local) measurements and from radio-synchrotron emission from the energetically less important relativistic electrons, rather than the nuclei that make up 99% of the CRs.
The process of star formation (SF), particularly of massive stars, is now known to lead to astrophysical particle acceleration, and hence -ray emission, via a number of different objects and phenomena. The well-established accelerators are associated with the end-products of the massive-stellar lifecycle: supernova remnants (SNR) and pulsars and their associated pulsar wind nebulae (PWNe). Over the last two decades, measurements in the X-ray and -ray domains have shown that SNRs are efficient particle accelerators (see e.g. [Vink (2011)]), with increasing evidence for the acceleration of nuclei as well as electrons (e.g. [Aharonian et al. (2008), Abdo et al. (2010b)]). Less secure are the apparent association of -ray emission with colliding stellar winds in binary systems ([Farnier et al. (2011)]) and the collective effect of winds in clusters (see e.g. [Abramowski et al. (2012)]).
Independent of the dominant contributor to the CR population, the expectation from our own Galaxy is that all massive star-forming regions should be associated with particle acceleration and hence -ray emission, at some level. Indeed, recent progress in the field of high-energy (HE) and very-high-energy (VHE) -ray astronomy, driven by the satellite-borne instrument Fermi-LAT and ground-based VHE telescopes such as H.E.S.S. and VERITAS, has led to the identification of a growing population of high-energy-emitting star-forming galaxies (including the nearby starburst galaxies M 82 and NGC 253). We focus on these new developments below, discussing in particular the case of starburst galaxies, and finally discuss the prospects for the next-generation -ray mission CTA.
2 Particle energy losses and -ray production
Ultra-relativistic electrons and nuclei suffer energy losses by a number of different mechanisms, which lead to the production of photons from the radio to VHE -ray regime. Here we consider the primary energy-loss mechanisms in turn, giving example loss-timescales appropriate for the environment in starburst regions. CR nuclei predominantly lose energy in strong nuclear interactions with ambient matter, producing -decay -ray emission primarily above a few hundred MeV. For a typical starburst region the (fairly energy-independent) interaction timescale is years, where is the average ambient density in hydrogen atoms per cm3, with an average energy loss of 50% per collision. For electrons a number of different energy-loss mechanisms play a significant role. For the highest energy electrons synchrotron and inverse Compton (IC) emission dominate with energy loss timescales () of years and years, for a starburst-like environment with an average magnetic field strength of G, and a radiation field energy density of eV cm-3. At electron energies below a few GeV Bremsstrahlung and (at the lowest energies) Coulomb losses become increasingly important, impacting on the shape of the equilibrium (i.e. cooled) electron spectrum and hence the spectrum of the non-thermal emission (see Figure 1 and Section 4 for more details). In such an environment a 1 TeV electron will produce IC and synchrotron photons with typical energies of GeV (for black-body target photons with K) and keV, respectively.
These timescales are so short that it is often very difficult for high energy electrons to escape from star-forming regions. Nuclei, in contrast may be removed by diffusion or bulk motion before significant energy losses occur. Starburst galaxies often drive winds which carry away particles from the nuclear region into the inter-galactic medium. This advection of particles is determined by the wind speed and its scale height, and can be characterised by an average residence time of the particles in the nucleus – which is around years for the km s-1 starburst wind of NGC 253. More details on energy loss and -ray production mechanisms in general can be found in [Aharonian (2004), Longair (2011), Hinton & Hofmann (2009)]. For more details on the environment and high-energy emission of starbursts see for example [Paglione et al. (1996), Lacki et al. (2011)] and references therein.
3 Non-thermal emission from Starburst galaxies
The presence of high-energy electrons in the archetypal starburst galaxies NGC 253 and M 82 was identified through low-frequency radio-synchrotron emission measurements in the late 1970’s (e.g. [Shimmins & Wall (1973)] and early 1980’s (e.g. [Laing & Peacock (1980)]), respectively. VHE -ray emission from these two objects has only recently been reported by [Acero et al. (2009)] and [Acciari et al. (2009)], respectively. Both galaxies have also been detected in the HE domain using data obtained in observations with the LAT instrument onboard the Fermi satellite ([Abdo et al. (2010a)]). Both starbursts are right at the sensitivity limit of Fermi-LAT and ground-based VHE -ray instruments – their detection required very long exposure times and they comprise the weakest -ray source class detected so far. Within large errors, the HE and VHE -ray spectrum of M 82 can be described by a single power-law in energy with photon index . Similarly, the extrapolated HE -ray spectrum of NGC 253 () is consistent with the integrated VHE -ray flux reported by H.E.S.S. In the following, we will outline the importance of different energy-loss processes of nuclei and electrons in a typical starburst environment as discussed in Section 2 and illustrate the effect on the SED of changing key parameters of the system with a very simple model.
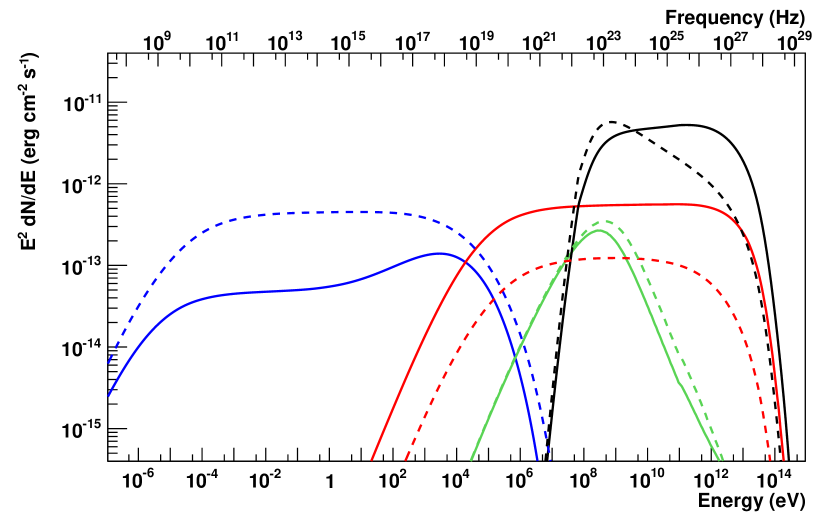
Fig. 1 shows a illustrative model SED for the particle injection and cooling in an environment similar to that found in the starburst nuclei of NGC 253 and M 82. Electrons and protons are injected over the assumed particle residence time of years. As this timescale is longer than the cooling timescales for electrons in the system, this SED is representative of the system at equilibrium (i.e. the present day SED – given the typical starburst lifetime of years), provided that the escape probability is energy-independent. The IC, synchrotron and bremsstrahlung emission for electrons is shown for “typical” and “extreme” values of the radiation field energy density and magnetic field strength. For model 1 a comparatively low -field strength of 100 G and rather high radiation field density of 2500 eV cm-3 are assumed. In this model a high-energy upturn in the synchrotron spectrum can be seen – a consequence of IC-dominated cooling in the Klein-Nishina regime. In model 2 the magnetic field strength is assumed to be G and eV cm-3, and synchrotron losses always dominate over IC. The energy input of erg s-1 for protons (electrons) represents an electron-to-proton ratio of 1/10 and has been derived assuming one supernova explosion every decade and a particle acceleration efficiency of 10%. As the electron-to-proton ratio at injection in our own galaxy is likely 1/100, this SED illustrates that -decay -rays are very likely to dominate the SED at GeV energies. For electrons with energies much smaller than GeV, Coulomb cooling starts to become significant and results in a hardening of the radio spectrum in the 100 MHz to 1 GHz frequency range.
These qualitative results should be compared to the more sophisticated modelling of non-thermal emission of starbursts in (for example) [Paglione et al. (1996), Domingo-Santamaría & Torres (2005), Persic et al. (2008)] or [Lacki et al. (2011)].
4 A comparison of NGC 253 and the Milky Way
Now that -ray emission from external star-forming galaxies has been established, we have the opportunity for the first time to compare the high-energy emission of the MW to other systems and test our ideas on relativistic particle production and transport. As a very nearby starburst with well-established radio, GeV and TeV emission, NGC 253 is well suited to such a comparison.
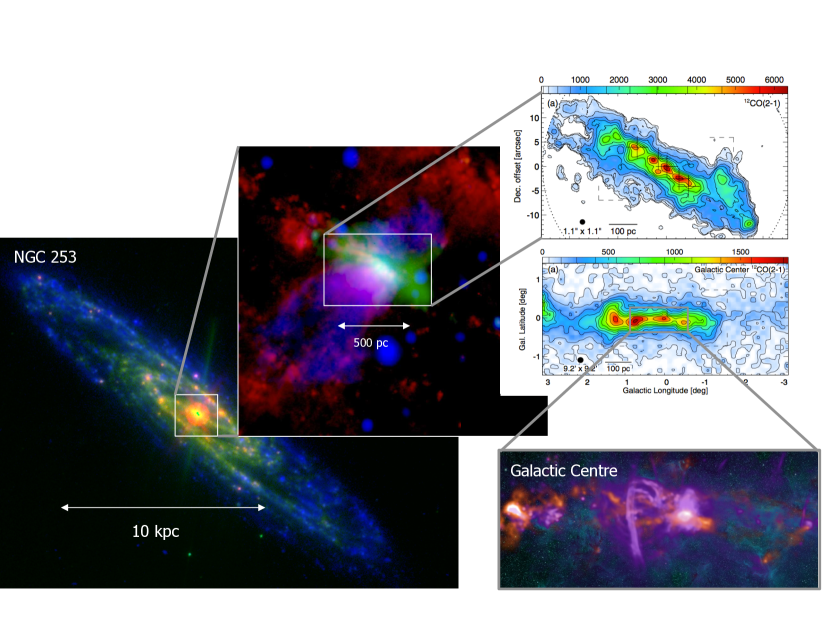
The synchrotron emission from starburst galaxies is in general correlated to their far-infrared (FIR) luminosity and hence star-formation rate ([van Buren & Greenhouse (1994)]). The radio emission of NGC 253 is coincident with the 0.5 kpc central molecular zone (CMZ), which has a star-formation rate exceeding that of the entire MW. Fig. 2 provides a multi-frequency view of NGC 253 on the scale of the galaxy as a whole and close to the nucleus. The nucleus exhibits bright infra-red and radio emission, and an outflow is apparent in thermal X-rays. In a recent CO study [Sakamoto et al. (2011)] found striking morphological similarities between the CMZ of NGC 253 and that of the MW (see Fig. 2). The physical size of the CMZ as a whole, and that of the prominent CO peaks ( pc), are remarkably similar in the two systems. Although the molecular mass estimate is afflicted by a considerable error in the CO-to-H2 conversion ratio, the Giant Molecular Cloud (GMC) complexes in NGC 253 have significantly higher CO intensities, suggesting order of magnitude higher densities in NGC 253 and a factor 10 higher total mass.
| CMZ NGC 253 | CMZ Milky Way | Milky Way | References | |
| size (FWHM, kpc2) | (1,2) | |||
| (1,3,4) | ||||
| (1,5) | ||||
| SFR ( yr-1) | 3.5∗ | 0.08 | (6,7,8) | |
| (yr-1) | 0.03-0.08 | (9,10,11,12) | ||
| (13,14) | ||||
| (14,15) | ||||
| ( Myr) | 40-100 | 0.5-10 | 6-20 | |
| ( Myr) | 5-15 | 0.1-1 | 0.3-0.8 |
References:
(1) [Sakamoto et al. (2011)], (2) [Combes (1991)], (3) [Sodroski et al. (1995)],
(4) [Paladini et al. (2007)], (5) [Pierce-Price et al. (2000)], (6) [Melo et al. (2002)],
(7) [Immer et al. (2011)], (8) [Robitaille & Whitney (2010)], (9) [van Buren & Greenhouse (1994)],
(10) [Engelbracht et al. (1998)], (11) [Crocker et al. (2011)], (12) [Diehl et al. (2006)],
(13) [Abdo et al. (2010a)], (14) [Strong et al. (2010)] (15) [Aharonian et al. (2006)]
Notes:
∗ The star-formation rate has been inferred from the
correlation with the luminosity.
† GeV luminosity of the CMZ as predicted by the Fermi-LAT
galactic diffuse model (gal_2yearp7v6_v0.fits from http://fermi.gsfc.nasa.gov/ssc/data/access/lat/BackgroundModels.html).
Numbers in brackets include point-like sources from the Fermi 2-year catalogue ([Abdo et al. (2011)])
in the region-of-interest. These numbers represent upper limits since they include
contributions of diffuse emission and unrelated point-like sources along the
line-of-sight.
‡ TeV luminosity of the CMZ as measured by H.E.S.S. ([Aharonian et al. (2006)]).
Numbers in brackets include the H.E.S.S. GC point-like source HESSJ1745–290
([Aharonian et al. (2009)]) and G 0.9+0.1 ([Aharonian et al. (2005)]).
Table 1 summarises SF and -ray emission related quantities for the NGC 253 starburst nucleus, for the MW CMZ and for the MW as a whole. The SF rate of the MW and the CMZ are inferred from number counts of young stellar objects and the application of a stellar evolution model. The supernova rate of the CMZ has been estimated by a number of different methods including the FIR-supernova rate relation, stellar composition models, and pulsar population studies (see [Crocker et al. (2011)] for a detailed discussion). Since the distance to NGC 253 is much larger than to the centre of our Galaxy, young stellar objects are too faint to be detected by current instruments, hence the SFR has to be inferred by indirect approaches such as the scaling relation between SFR and IR flux ([Kennicutt (1998)]). The supernova rate also has to be indirectly inferred, from e.g. iron-line measurements. The inferred SFR and supernova rate in the starburst nucleus of NGC 253 are orders of magnitude larger than in the CMZ.
Under the assumption that particle acceleration predominantly occurs in SNR shells, or is simply driven by massive star formation, and the particle acceleration efficiency () is fixed, the CR injection power should correlate with the supernova rate. For a fixed efficiency of -ray production () from accelerated particles, the -ray flux should therefore be proportional to the supernova rate. Table 1 gives the ratio of the -ray luminosity in the GeV and TeV bands to the supernova rate in the three systems considered. Comparing the entire Milky Way with the NGC 253 starburst, a factor of a few difference apparently exists in the product . A much more dramatic difference exists between the apparently much more similar regions of the NGC 253 starburst and the CMZ, with smaller by 1-2 orders of magnitude with respect to NGC 253. This observation however, can be understood in the following picture: The convective escape time, i.e. the residence time of particles in both systems, is comparable if the CMZ in the MW drives a nuclear wind, similar in terms of wind speed and size, to the one observed in NGC 253 (see e.g. [Crocker et al. (2011)]). The order of magnitude higher density in the NGC 253 starburst region on the other hand, results in an order of magnitude higher fraction of energy lost by an average proton in p-p interactions. Hence, the efficiency of converting CR energy into rays () is expected to be an order of magnitude increased relative to the CMZ in the MW.
5 Prospects for CTA
The upcoming Cherenkov Telescope Array project ([Actis et al. (2011)]) represents a major step forward in both the sensitivity and precision of -ray astronomy. Compared to current instruments it will provide a broader energy coverage and overlap in energy with the Fermi satellite, a much better angular resolution, and a factor of 10 better sensitivity. This will allow us to measure the spectra of M 82 and NGC 253 in great detail and to search for spectral features such as the emergence and subsequent disappearance of an IC component. If the -ray emission from the known starbursts originates from the GMC complex seen e.g. in CO, it might be possible to detect a significant extension in the -ray emission, given the arc-minute-scale angular resolution of CTA. Finally, the greatly improved sensitivity might allow us to detect other nearby galaxies such as Andromeda (M 31) and/or to establish new source classes such as ultra-luminous infrared galaxies, helping us to gain a deeper insight into the relationship between star formation and particle acceleration.
References
- [Abdo et al. (2010a)] Abdo, A. A., et al. (Fermi-LAT Collaboration), 2010, ApJL, 709, L152-L157
- [Abdo et al. (2010b)] Abdo, A. A., et al. (Fermi-LAT Collaboration), 2010, ApJ, 718, 348-356
- [Abdo et al. (2011)] Abdo, A. A., et al. (Fermi-LAT Collaboration), 2011, arXiv, 1108.1435
- [Abramowski et al. (2012)] Abramowski, A., et al. (H.E.S.S. Collaboration), 2012, A&A, 537, A114
- [Acciari et al. (2009)] Acciari, V. A., et al. (VERITAS Collaboration), 2009, Nature, 462, 770
- [Acero et al. (2009)] Acero, F., et al. (H.E.S.S. Collaboration), 2009, Science, 326, 1080
- [Actis et al. (2011)] Actis, M., et al., 2011, Experimental Astronomy, 32, 193-316
- [Aharonian (2004)] Aharonian, F. A., Very high energy cosmic gamma radiation: a crucial window on the extreme Universe, 2004, World Scientific Publishing Company; 1st edition
- [Aharonian et al. (2005)] Aharonian, F., et al. (H.E.S.S. Collaboration), 2005, A&A Letters, 432, L25-L29
- [Aharonian et al. (2006)] Aharonian, F., et al. (H.E.S.S. Collaboration), 2006, Nature, 439, 695-698
- [Aharonian et al. (2008)] Aharonian, F., et al. (H.E.S.S. Collaboration), 2008, A&A, 481, 401
- [Aharonian et al. (2009)] Aharonian, F., et al. (H.E.S.S. Collaboration), 2009, A&A, 503, 817-825
- [Combes (1991)] Combes, F., 1991, ARA&A, 29, 195-237
- [Crocker et al. (2011)] Crocker, R. M., et al., 2010, MNRAS, 413, 763-788
- [Diehl et al. (2006)] Diehl, R., et al., 2006, Nature, 439, 45-47
- [Domingo-Santamaría & Torres (2005)] Domingo-Santamaría, E. & Torres, D. F., 2005, A&A, 444, 403-415
- [Engelbracht et al. (1998)] Engelbracht, C. W., et al., 1998, ApJ, 505, 639-658
- [Farnier et al. (2011)] Farnier, C., Walter, R., & Leyder, J. C., 2011, A&A, 526A, 57F
- [Heesen et al. (2011)] Heesen, V., Beck, R., Krause, M., & Dettmar, R. J., 2011, A&A, 535, A79
- [Hinton & Hofmann (2009)] Hinton, J. A. & Hofmann, W., 2009, ARA&A, 47, 523-565
- [Immer et al. (2011)] Immer, K., Schuller, F., Omont, A., & Menten K. M., 2011, A&A, in press
- [Kennicutt (1998)] Kennicutt, R. C., Jr. 1998, ARA&A, 36, 189
- [Melo et al. (2002)] Melo, V. P., et al., 2002, ApJ, 574, 709-718
- [Lacki et al. (2011)] Lacki, B. C., et al., 2011, ApJ, 734, 107+-
- [Laing & Peacock (1980)] Laing, R. A. and Peacock, J. A., 1980, MNRAS, 190, 903
- [Longair (2011)] Longair, M. S., 2011, High Energy Astrophysics Cambridge University Press; 3rd edition
- [Paladini et al. (2007)] Paladini, R., et al., 2007, A&A, 465, 839-845
- [Paglione et al. (1996)] Paglione, T. A. D., Marscher, A. P., Jackson, J. M. & Bertsch, D. L.,1996, ApJ, 460, 295+-
- [Persic et al. (2008)] Persic, M., Rephaeli, Y., Arieli, Y.,2008, A&A, 486, 143P
- [Pierce-Price et al. (2000)] Pierce-Price, D., et al., 2000, ApJ, 545, L121-L125
- [Robitaille & Whitney (2010)] Robitaille, T. P. & Whitney, B. A., 2010, ApJ, 710, L11-L15
- [Sakamoto et al. (2011)] Sakamoto, K., et al., 2011, ApJ, 735, 19
- [Shimmins & Wall (1973)] Shimmins, A. and Wall, J., 1973, Australian J. Phys., 26, 93
- [Sodroski et al. (1995)] Sodroski, T. J., et al., 1995, ApJ, 452, 262
- [Strong et al. (2010)] Strong A. W., et al., 2010, ApJL, 722, L58-L63
- [van Buren & Greenhouse (1994)] Van Buren, D., & Greenhouse, M. A., 1994, ApJ, 431, 640-644
- [Vink (2011)] Vink, J., 2011, arXiv, 1112.0576
- [Wagner (2008)] Wagner, R. M., 2008, MNRAS, 385, 119–35