Code-division multiplexing for x-ray microcalorimeters
Abstract
We demonstrate the code-division multiplexed (CDM) readout of eight transition-edge sensor microcalorimeters. The energy resolution is 3.0 eV (full width at half-maximum) or better at 5.9 keV, with a best resolution of 2.3 eV and a mean of 2.6 eV over the seven modulated detectors. The flux-summing CDM system is described and compared with similar time-division multiplexed (TDM) readout. We show that the multiplexing disadvantage associated with TDM is not present in CDM. This demonstration establishes CDM as both a simple route to higher performance in existing TDM microcalorimetric experiments and a long-term approach to reaching higher multiplexing factors.
The transition-edge sensorIrwin and Hilton (2005) (TES) is an established calorimetric detector whose applications include x-ray astronomy,Kilbourne et al. (2008) gamma-ray spectroscopy for analysis of nuclear materials,Doriese et al. (2007) and probing molecular dynamics through x-ray absorption spectroscopy.Bressler and Chergui (2004); Uhlig (2011) These applications demand ever-larger arrays of detectors to increase photon throughput. Because TES microcalorimeters are operated at sub-Kelvin temperatures, the reduction of power dissipation and wire count through multiplexing is crucial. Ammeters made from superconducting quantum interference devices (SQUIDs) are widely used to read out TESs due to their low noise, low impedance, low power dissipation, and high bandwidth.
A typical multiplexed array consists of multiple independent amplifier channels each reading out detectors. The two most mature multiplexing techniques now in use for TESs are time-division multiplexing (TDM)Kilbourne et al. (2008) and MHz-band frequency-division multiplexing (FDM).Yoon et al. (2001) Neither is ideal for microcalorimetry. In an -row TDM multiplexer, the SQUID noise aliased into the signal band grows as , a consequence of inefficient use of the readout bandwidth.Doriese et al. (2006) This noise limits multiplexers for high-resolution x-ray or gamma-ray microcalorimeters to tens of detectors per amplifier channel. FDM avoids the noise penalty but has its own limitations when operated in the MHz range, including physically large filter components,Yoon et al. (2001) and the degradation of sensor resolution by ac biasing.Gottardi et al. (2011)
A third multiplexing technique, code-division multiplexing (CDM),Irwin et al. (2010) is being developed at NIST in two distinct configurations: CDM through current summationNiemack et al. (2010) (-CDM), and CDM through flux summationFowler et al. (2012) (-CDM). In this letter, we report on an eight-element array of TES microcalorimeters read out through -CDM. The energy resolution at 5.9 keV averaged 2.6 eV full-width at half-maximum (FWHM) in the seven modulated detectors. We summarize the -CDM design and compare its noise with that of a similar TDM system.
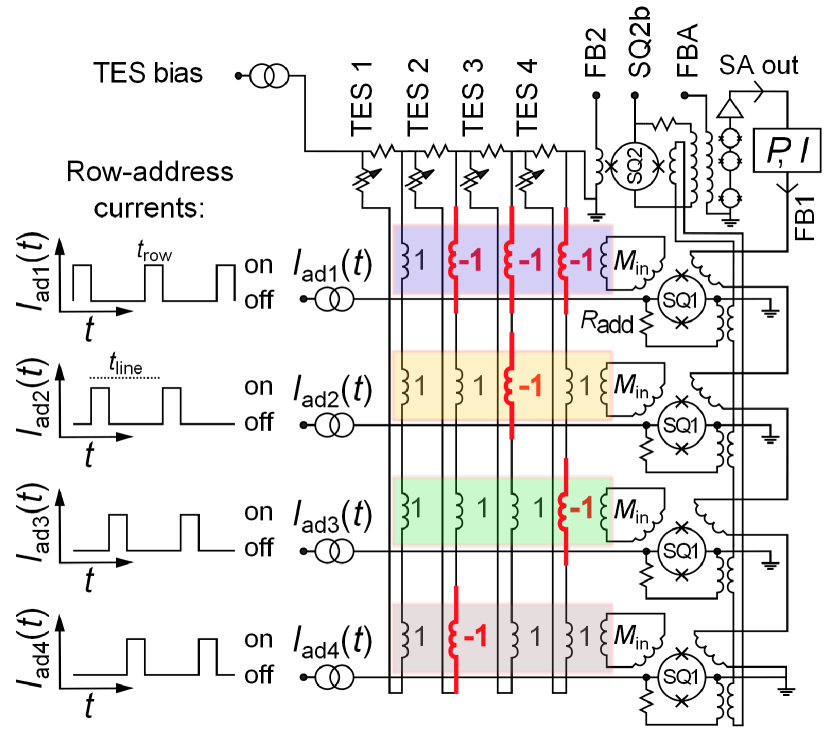
We have fabricated -CDM multiplexers to read out arrays of 4, 8 and 16 detectors. Figure 1 depicts a four-detector array and explains its operation. The TES signals are encoded through a Walsh basis setWalsh (1923) defined by the polarity of lithographically patterned inductive traces. The four orthogonal combinations of the signals are read out in sequence. The encoding matrices used in the 4- and 8-detector designs are
| (1) |
| (2) |
where matrix columns represent TES detectors, and the rows represent readout rows. The encoding matrix or gives the coupling polarity between the signal from each detector and each readout row. (Viewed in this way, a TDM system uses the identity matrix for encoding: .) The Walsh code switches the polarity of each TES but the first, eliminating sensitivity in demodulated data to any amplifier drift or pickup occurring after the modulation (e.g., the 60 Hz power-line harmonics visible in Figure 3b but absent from 3c). In the most demanding applications, the single unswitched input could be used without a TES as a “dark SQUID” noise monitor. Other than the multiplexer chips, all the hardware required by -CDM (SQUID series arrays, wire-bonded cryogenic circuit boards, and room temperature electronicsReintsema et al. (2003)) is directly interchangeable with TDM. Existing TDM systems thus need no modifications to their firmware or to the data acquisition software to be “drop-in compatible” with -CDM. The analysis software must be enhanced, however, to demodulate the channels of raw data into the detector timestreams.
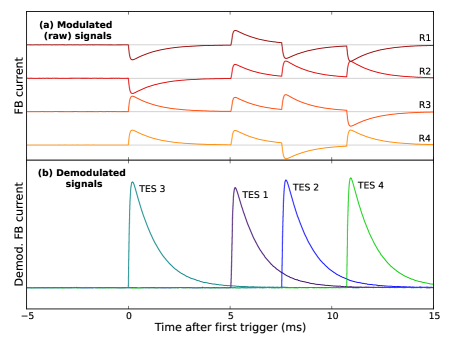
An example of Walsh-encoded and -decoded data is shown in Figure 2. Four photons arrive during a 20 ms window on a four-detector -CDM array. The top panel shows the encoded signal recorded by each first-stage SQUID as the four detectors each absorb x-rays. The photons strike TES 3, 1, 2, then 4; the encoded pulse polarities therefore reflect columns of Equation 1 in the same order. The bottom panel shows the reconstructed signal currents in the individual TESs over the same 20 ms.
Because the encoding matrices are defined by lithography on the multiplexer chip, details of the inductor layout and other on-chip sources of cross-talk produce unequal couplings between the detectors and SQUIDs. The encoding matrices given in Equations 1 and 2 are therefore only idealizations; we have measured the true encodings to depart from the ideal at the 1 % to 2 % level in 4, 8, and 16-detector CDM multiplexers. Measurements on a partial 32-detector multiplexer suggest its non-uniformity will be at the same level. A correction computed in offline analysisFowler et al. (2012) can reduce this imbalance to levels below 0.1 %. Corrected decoding matrices are used for all -CDM data in this letter. We find this correction to be stable over at least several weeks, allowing it to be measured once and then applied in real-time data analysis. The demodulation requires computation scaling as per data sample for multiplexed detectors. Our experience shows that the computational burden will not prevent scaling the technique up to at least .
A further linear arrival-time correction is applied,Fowler et al. (2012) though it makes no significant difference in the present observations. At higher , where the time between successive samples grows longer, the correction would help by reducing the dependence of demodulated pulse shapes on the arrival time. The correction will also be important to reduce cross-talk effects in future data sets with larger and with higher photon rates.
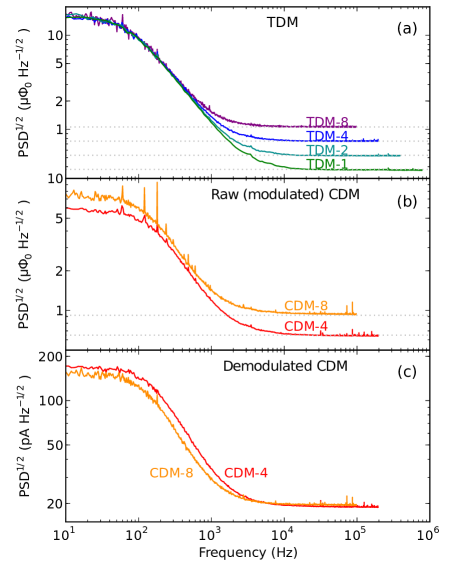
In a TDM channel of detectors, the wide-band SQUID amplifier noise level (at fixed sampling rate) scales as due to aliasing (Figure 3a). The relation between the detector current noise and SQUID flux noise in TDM isDoriese et al. (2006)
| (3) |
For large , the coupling mutual inductance of the TES signal to the SQ1 amplifier must be increased to compensate for the higher amplifier noise. is limited on the high end by the dynamic range of the SQ1 when tracking the steep leading edge of photon pulses.
CDM has the advantage of sampling all detectors at all times, while TDM samples each only of the time. This means that amplifier bandwidth is used much more efficiently in CDM. In practice, this works as follows. The encoded SQ1 signals (Figure 3b) suffer the same multiplex disadvantage as in TDM. In decoding, however, TES signals average coherently, while the samples of amplifier noise average incoherently. The demodulated TES signal and amplifier noise are therefore independent of multiplexing factor (Figure 3c). -CDM thus allows to remain low at large without increasing the amplifier noise as referred to TES current. Low mutual inductance, in turn, increases the effective dynamic range of the SQUID amplifiers and makes the system more robust with fast TESs and in the face of high pulse rates.
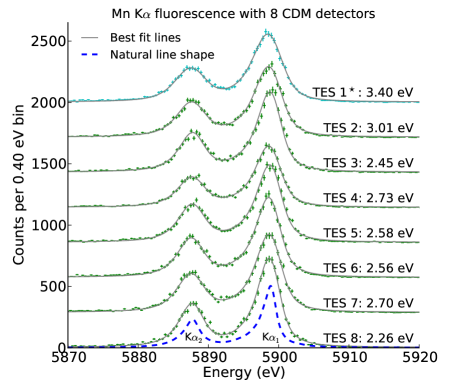
Figure 4 shows Mn K fluorescence spectra measured by eight TES x-ray detectors read out with -CDM. All detectors (besides the unswitched TES 1) achieved 3.0 eV FWHM energy resolution or better at 5.9 keV. The mean resolution of 2.6 eV is better than the best previous multiplexed TES measurement at this energy.Kilbourne et al. (2008) Count rates in these data are low (approximately 5 Hz per detector), but we anticipate operating with much higher rates in the near future.
We view the demonstration of -CDM presented here as important for two reasons. First, -CDM chips are drop-in compatible with existing 32-row TDM systems but have higher performance. They offer an immediate path to the kilopixel-scale arrays of high-resolution TES microcalorimeters desirable in applications like synchrotron science and the proposed Athena satellite. Second, the -CDM system provides a bridge to the eventual development of -CDM, in which the rapid alternation of SQUID switches replaces transformer windings as the mechanism for encoding TES signals. An -CDM multiplexer could scale to hundreds of detectors per amplifier channel,Irwin et al. (2010) eventually enabling even megapixel-scale arrays.
NASA grant NNG09WF27I and an American Recovery and Reinvestment Act Fellowship to JF supported this work. Contribution of NIST, not subject to copyright.
References
- Irwin and Hilton (2005) K. D. Irwin and G. C. Hilton, “Cryogenic particle detection,” (Springer-Verlag, Berlin, 2005) Chap. Transition-Edge Sensors.
- Kilbourne et al. (2008) C. A. Kilbourne, W. B. Doriese, S. R. Bandler, R. P. Brekosky, A.-D. Brown, J. A. Chervenak, M. E. Eckart, F. M. Finkbeiner, G. C. Hilton, K. D. Irwin, N. Iyomoto, R. L. Kelley, F. S. Porter, C. D. Reintsema, S. J. Smith, and J. N. Ullom, in SPIE Conf. Series, Vol. 7011 (2008).
- Doriese et al. (2007) W. B. Doriese, J. N. Ullom, J. A. Beall, W. D. Duncan, L. Ferreira, G. C. Hilton, R. D. Horansky, K. D. Irwin, J. A. B. Mates, C. D. Reintsema, L. R. Vale, Y. Xu, B. L. Zink, M. W. Rabin, A. S. Hoover, C. R. Rudy, and D. T. Vo, Appl. Phys. Lett. 90, 193508 (2007).
- Bressler and Chergui (2004) C. Bressler and M. Chergui, Chemical Reviews 104, 1781 (2004).
- Uhlig (2011) J. Uhlig, Life of a photon in X-ray spectroscopy, Ph.D. Thesis, Lund University (2011).
- Yoon et al. (2001) J. Yoon, J. Clarke, J. M. Gildemeister, A. T. Lee, M. J. Myers, P. L. Richards, and J. T. Skidmore, Appl. Phys. Lett. 78, 371 (2001).
- Doriese et al. (2006) W. B. Doriese, J. A. Beall, J. Beyer, S. Deiker, L. Ferreira, G. C. Hilton, K. D. Irwin, J. M. Martinis, S. W. Nam, C. D. Reintsema, J. N. Ullom, L. R. Vale, and Y. Xu, Nucl. Instr. Meth. Phys. A 559, 808 (2006).
- Gottardi et al. (2011) L. Gottardi, J. van de Kuur, S. Bandler, M. Bruijn, P. de Korte, J. R. Gao, R. den Hartog, R. Hijmering, H. Hoevers, P. Koshropanah, C. Kilbourne, M. A. Lindemann, M. Parra Borderias, and M. Ridder, IEEE Appl. Superconductivity 21, 272 (2011).
- Irwin et al. (2010) K. D. Irwin, M. D. Niemack, J. Beyer, H. M. Cho, W. B. Doriese, G. C. Hilton, C. D. Reintsema, D. R. Schmidt, J. N. Ullom, and L. R. Vale, Supercond. Sci. and Technol. 23, 034004 (2010).
- Niemack et al. (2010) M. D. Niemack, J. Beyer, H. M. Cho, W. B. Doriese, G. C. Hilton, K. D. Irwin, C. D. Reintsema, D. R. Schmidt, J. N. Ullom, and L. R. Vale, Appl. Phys. Lett. 96, 163509 (2010).
- Fowler et al. (2012) J. W. Fowler, W. B. Doriese, G. Hilton, K. Irwin, D. Schmidt, G. Stiehl, D. Swetz, J. N. Ullom, and L. Vale, accepted by J. Low Temp. Phys. (2012).
- Walsh (1923) J. L. Walsh, Am. J. Math. 45, 5 (1923).
- Reintsema et al. (2003) C. D. Reintsema, J. Beyer, S. W. Nam, S. Deiker, G. C. Hilton, K. D. Irwin, J. Martinis, J. Ullom, and L. R. Vale, Review of Scientific Instruments 74, 4500 (2003).