Field-induced criticality in a gapped quantum magnet with bond disorder.
Abstract
Neutron diffraction and calorimetric measurements are used to study the field-induced quantum phase transition in piperazinium-Cu2(Cl1-xBrx)6 (, % and %), a prototypical quantum antiferromagnet with random bonds. The critical indexes and are determined. The findings contradict some original predictions for Bose Glass based on the assumption , but are consistent with recent theoretical results implying . Inelastic neutron experiments reveal that disorder has a profound effect on the lowest-energy magnetic gap excitation in the system.
pacs:
75.10.Jm, 64.70.Tg, 75.40.Cx, 72.15.RnThe persistent interest in quantum magnets is driven by their use as prototypes for the study of quantum critical phenomena. In this context, much attention has been given to field-induced phase transitions in gapped spin systems with a singlet ground state, the so-called quantum spin liquids. Such transitions are described in terms of a Bose Einstein condensation (BEC) of magnons.Giamarchi et al. (2008) The specific advantage of magnetic realizations of BEC lies in the relatively easy experimental access to- and control of- the key relevant quantities, notably the effective chemical potential, boson density and BEC order parameter. In magnetic BEC, the latter correspond to magnetic field, magnetization and antiferromagnetic order, respectively.
A particular area of recent interest is BEC in the presence of a spatially random potential. Such disorder leads to a localization of bosons and the appearance of a novel quantum phase, the so-called Bose Glass.Giamarchi and Schulz (1987); Fischer et al. (1989); Nohadini et al. (2005) Most importantly, it changes the universality class of the quantum critical point. While in the disorder-free case it is Mean Field (MF) like with dynamical critical exponent ,Giamarchi et al. (2008) very unusual scaling with equal to dimensionality () was predicted for disordered systems.Fischer et al. (1989) This premise was recently challenged,Weichman and Mukhopadhyay (2007, 2008) suggesting that in fact .Priyadarshee et al. (2006); Mei Quantum magnetic materials offer a unique opportunity of addressing this important matter of debate experimentally. A random potential for magnons can be created by randomizing the strength of magnetic interactions. This is achieved through a spatially random chemical modification. Indications of the magnetic Bose GlassManaka et al. (2008, 2009); Hong et al. (2010) and a modification of the field-induced ordering transitionYamada et al. (2011); Yu (2); Wulf et al. (2011) have been reported. However, experiments only added to the confusion regarding critical indexes and scaling. Recent studies of Tl0.64K0.36CuCl3 seemed to validate the hypothesis.Yamada et al. (2011) Other experiments, on the organic compound DTN,Yu (2) yielded quite different critical exponents, and were supported by Density Matrix Renormalization Group (DMRG) calculations. In the present work we seek to resolve the issue through neutron and calorimetric studies of the chemically disordered quantum magnets piperazinium-Cu2(Cl1-xBrx)6 (PHCX). We determine the critical exponents and , the latter previously unmeasured for this type of transition. We find experimental values that are clearly inconsistent with predictions based on .
One rationale for selecting PHCX as a test material is that the disorder-free Cl-rich () compound, (PHCC) is an exceptionally well-characterized Heisenberg quantum magnet.Stone et al. (2001, 2006a, 2007, 2006b) It features a complex quasi two-dimensional spin network of Cu2+ ions bridged by Cu-Cl-Cl-Cu superexchange pathways, see Fig.1 in Ref.Stone et al., 2001. The exact Hamiltonian for this system remains unknown with 6 to 8 possible superexchange pathways within the Cu2Cl6 layers. However, for the physics discussed here relevant ramification is the spin liquid ground state and the gapped ( meV) magnon spectrum with bandwidth of about 1.7 meV. In magnetic fields exceeding T, PHCC undergoes a quantum phase transition to a state with spontaneous antiferromagnetic (AF) order perpendicular to the direction of applied field. The critical properties of this transition have been investigated using a variety of techniques.Stone et al. (2007) The two critical exponents studied in this work are the order parameter exponent and the so-called crossover exponent . The former defines the field dependence of the AF ordered moment at : , where . The crossover index defines the phase boundary of the ordered state on the phase diagram: or .
Br substitution in PHCX is expected to locally affect the bond angles in the halogen-mediated superexchange routes, and thereby to realize the random bond model. This mechanism was previously exploited in the study of random-bond systems IPA-CuCl3,Manaka et al. (2008); Hong et al. (2010) Sul-Cu2Cl4 (Ref. Wulf et al., 2011) and DTN.Yu (2) High quality PHCX single crystals were grown from solution as described in Ref. Yan, . Single crystal X-ray diffraction confirmed that for Br content up to at least 10%, the crystal symmetry remains intact, space group (). The lattice parameters are Å,Å,Å, for the pure material with ,Marcotrigiano et al. (1976) and the cell dimensions increase linearly with . Here stands for nominal Br concentration in the starting solution. Studies on similar compounds have shown a very good correspondence between nominal and final dopant concentrations.Wulf et al. (2011); Yan Most of the work reported here was done on perfectly faceted single crystals with % and %, where Å,Å, Åand Å, Å, Å, respectively, with the triclinic angles indistinguishable from the pure compound’s.
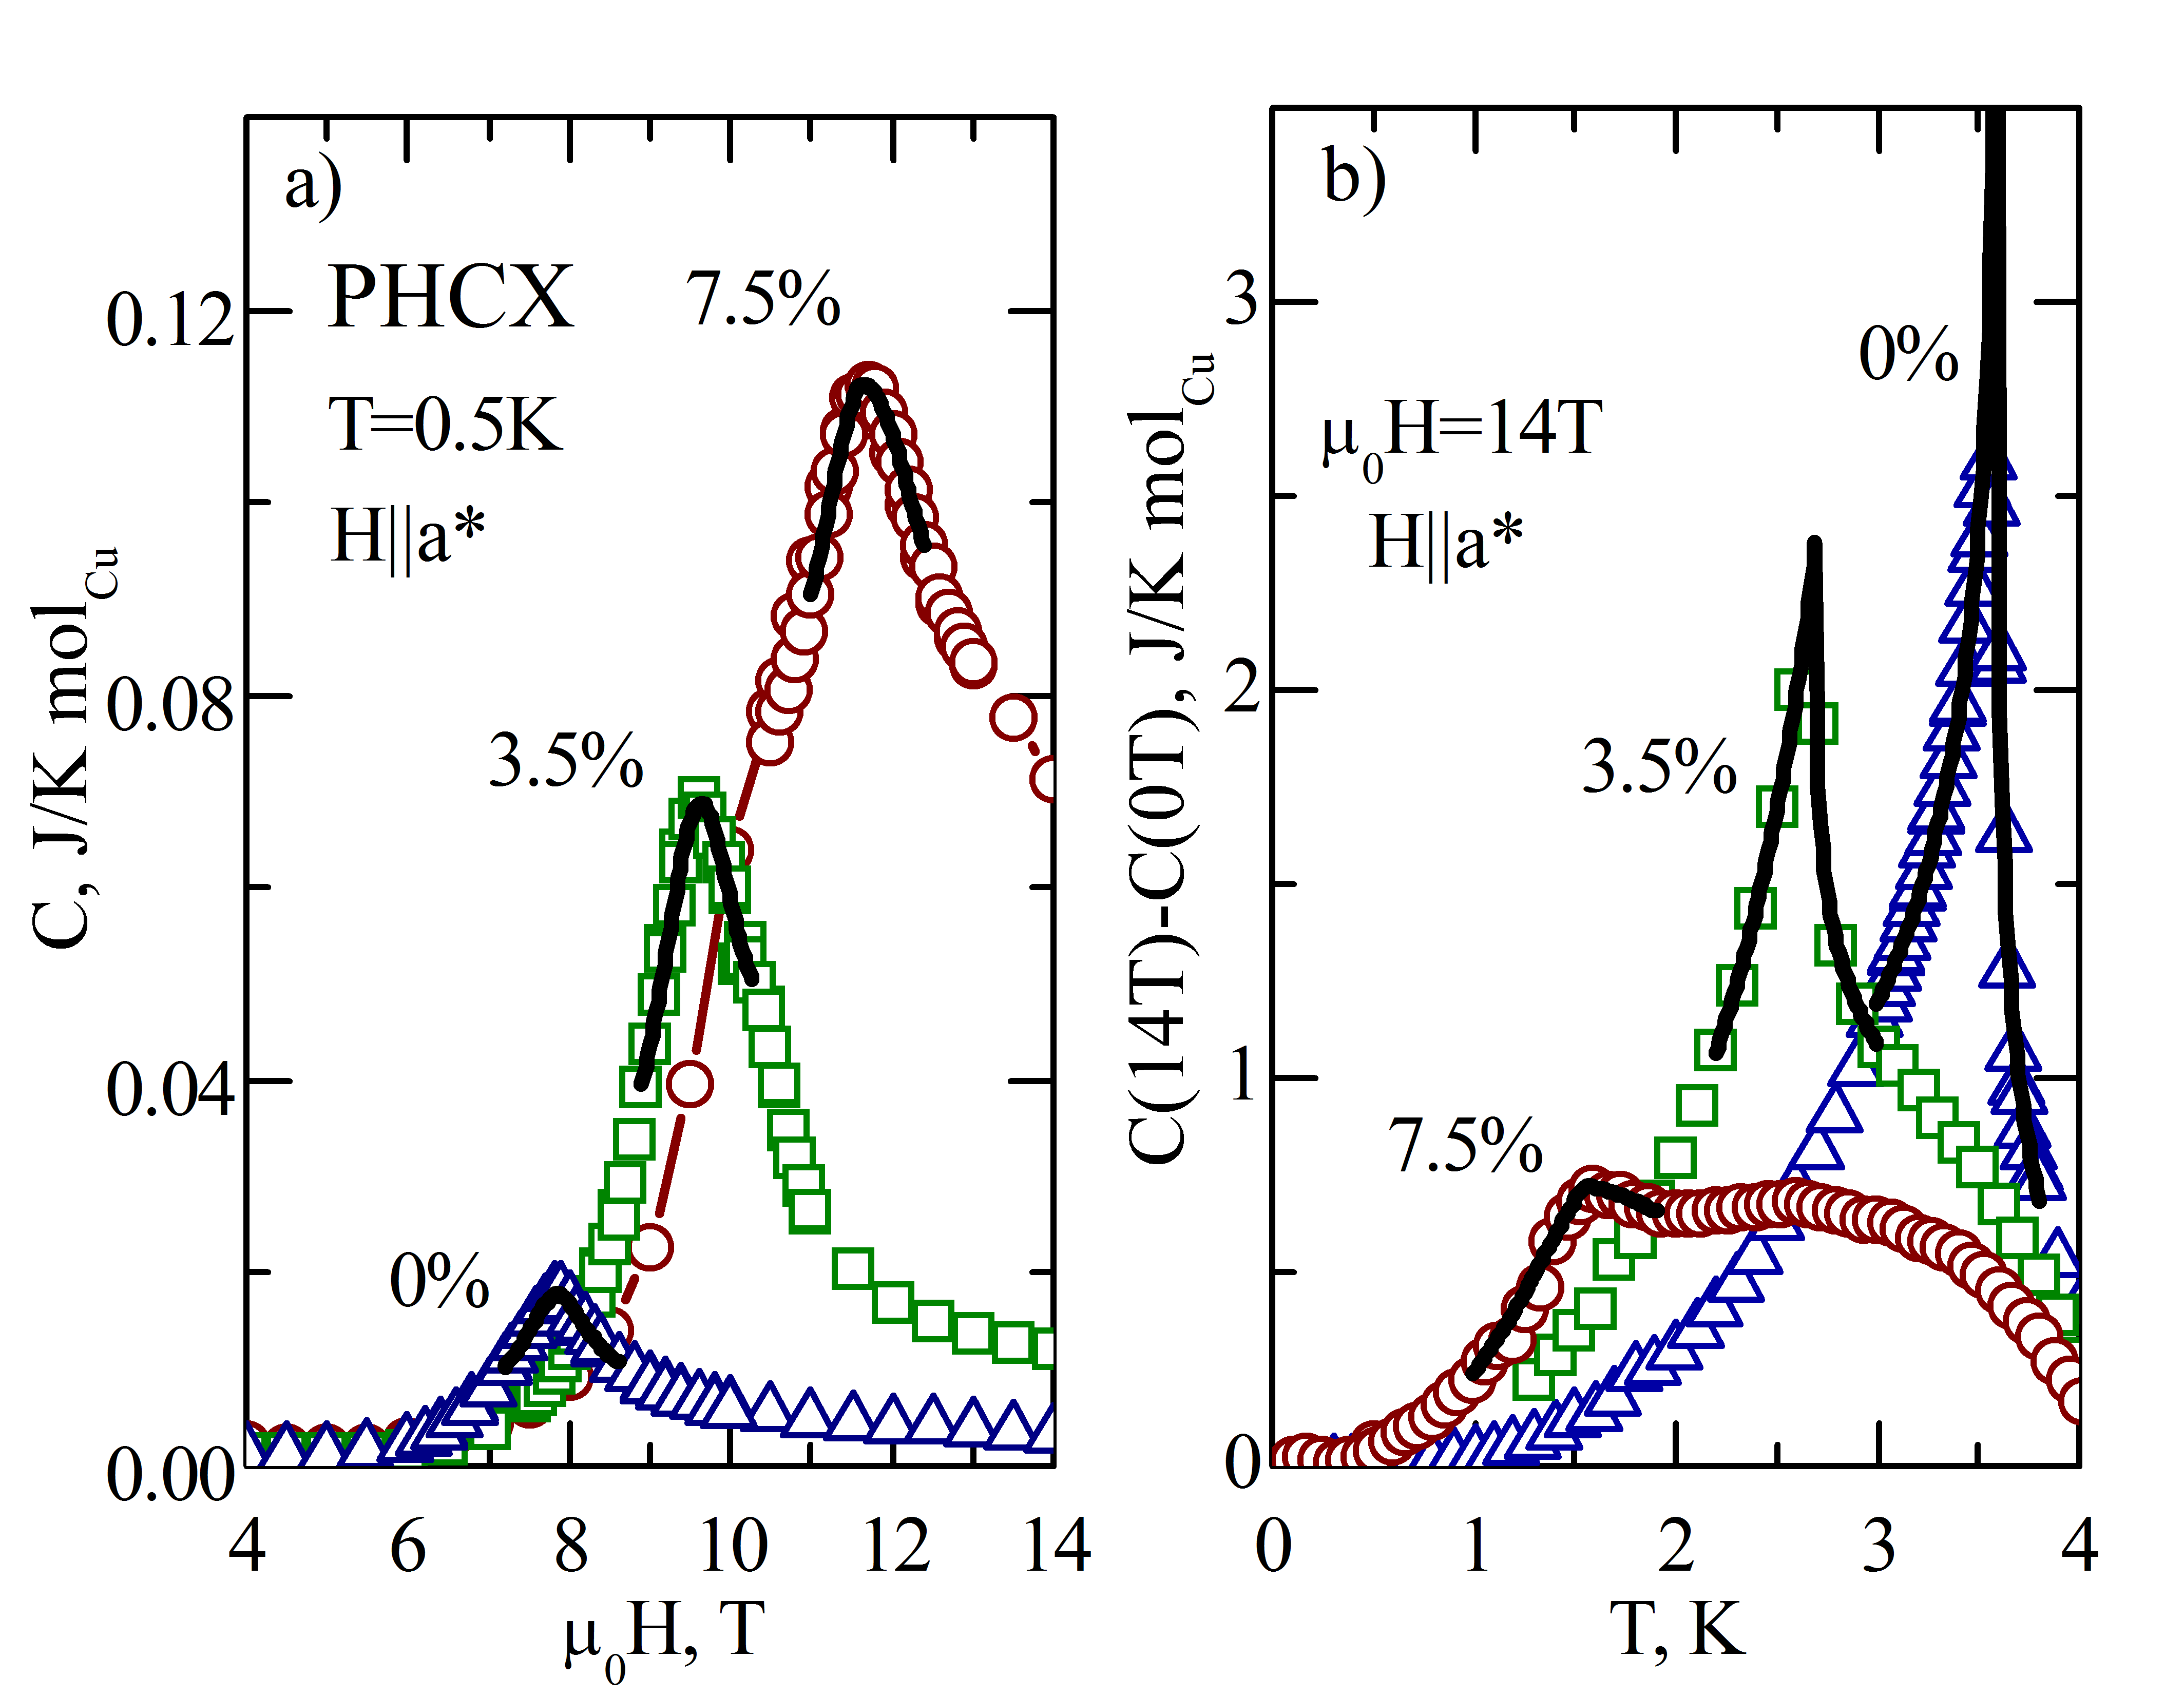
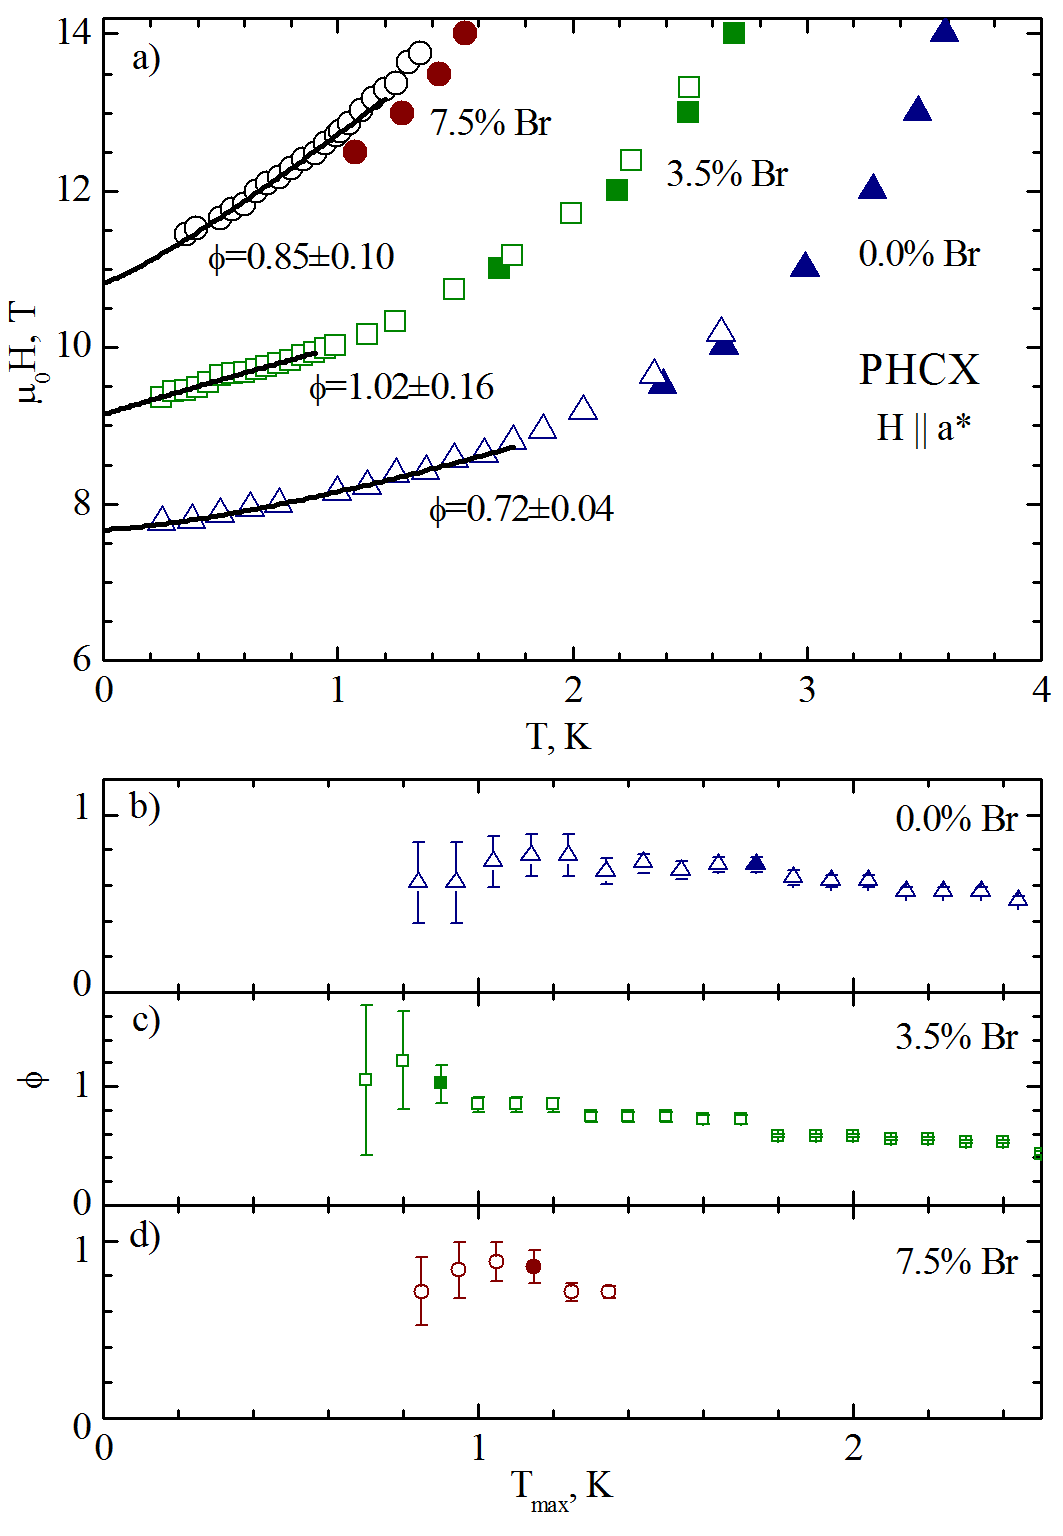
The crossover exponent was derived from calorimetric measurements. For , % and %, the data were collected using a 14 T Quantum Design PPMS with a 3He-4He dilution insert, both as a function of temperature and magnetic field applied along the axis. Typical scans are shown in Fig.1a,b (symbols). Sharp lambda-anomalies are apparent in all cases and mark the ordering transition. The apparent broadening at low for % sample is of instrumental origin. It is caused by differences in the slope of the phase boundary in conjunction with finite temperature resolution. In the constant-field scans, the actual transition temperatures were determined by fitting the data at each field, in the vicinity of the peaks, to an empirical form of power law with broadening.hcf A similar approach was used to obtain the temperature dependence of the critical field from constant-temperature scans. In this case the fit function was a composite of two half-Lorentzians of non-equal widths and common maxima. The resulting phase boundaries are plotted in Fig. 2 (symbols). Clearly, the introduction of disorder shifts the transition to higher fields and lower temperatures.
Any more quantitative analysis has to take into account the experimental errors. For consistency, we only used the more comprehensive data set obtained in constant temperature scans (empty symbols in Fig. 2). The error bar on was estimated as the standard deviation of this parameter in the least squares fits described above and is significantly smaller than the symbol size in the plot. The dominant error on is of instrumental origin, and due to the use of the temperature relaxation measurement method. It is defined by the magnitude of applied heat pulse (3% of the starting temperature in our case).
The exponent is obtained by weighted least squares fit of the power law function to the experimental field-dependence of accounting for experimental errors on both. This deceptively simple procedure is actually quite delicate. The fit is performed in a progressively shrinking data range . In Figs. 2b-2d, we show the fitted values of for the three materials plotted against . The range used for the final fits is to be selected based on two conflicting requirements. It has to be as narrow as possible, in order to access the true critical region. This desire is counteracted by the divergence of confidence intervals at . As a rule of thumb, one can choose the largest that gives a value of within the confidence intervals obtained using any narrower ranges. Further reducing the fitting range does not produce a statistically significant change in the result.
Returning to our case of PHCC, based on the plots in Fig. 2 and the above-mentioned rule of thumb, for the , % and % materials we have selected fitting ranges K, 0.9 K and 1.15 K, respectively. The resulting values of and are summarized in Table 1. Power laws derived from these parameter values are shown as solid lines up to in Fig. 2.
| T | |||
| PHCX 0.0% Br | [Stone et al., 2007] | ||
| PHCX 3.5% Br | |||
| PHCX 7.5% Br | |||
| DTN 0.8% Br [Yu, 2] | |||
| Tl0.64K0.36CuCl3 [Yamada et al., 2011] | |||
| scaling [Fischer et al., 1989] | |||
| QMC [Priyadarshee et al., 2006] | |||
| QMC [Yu, 2] | |||
| BEC (MF) | 0.667 | 0.5 |
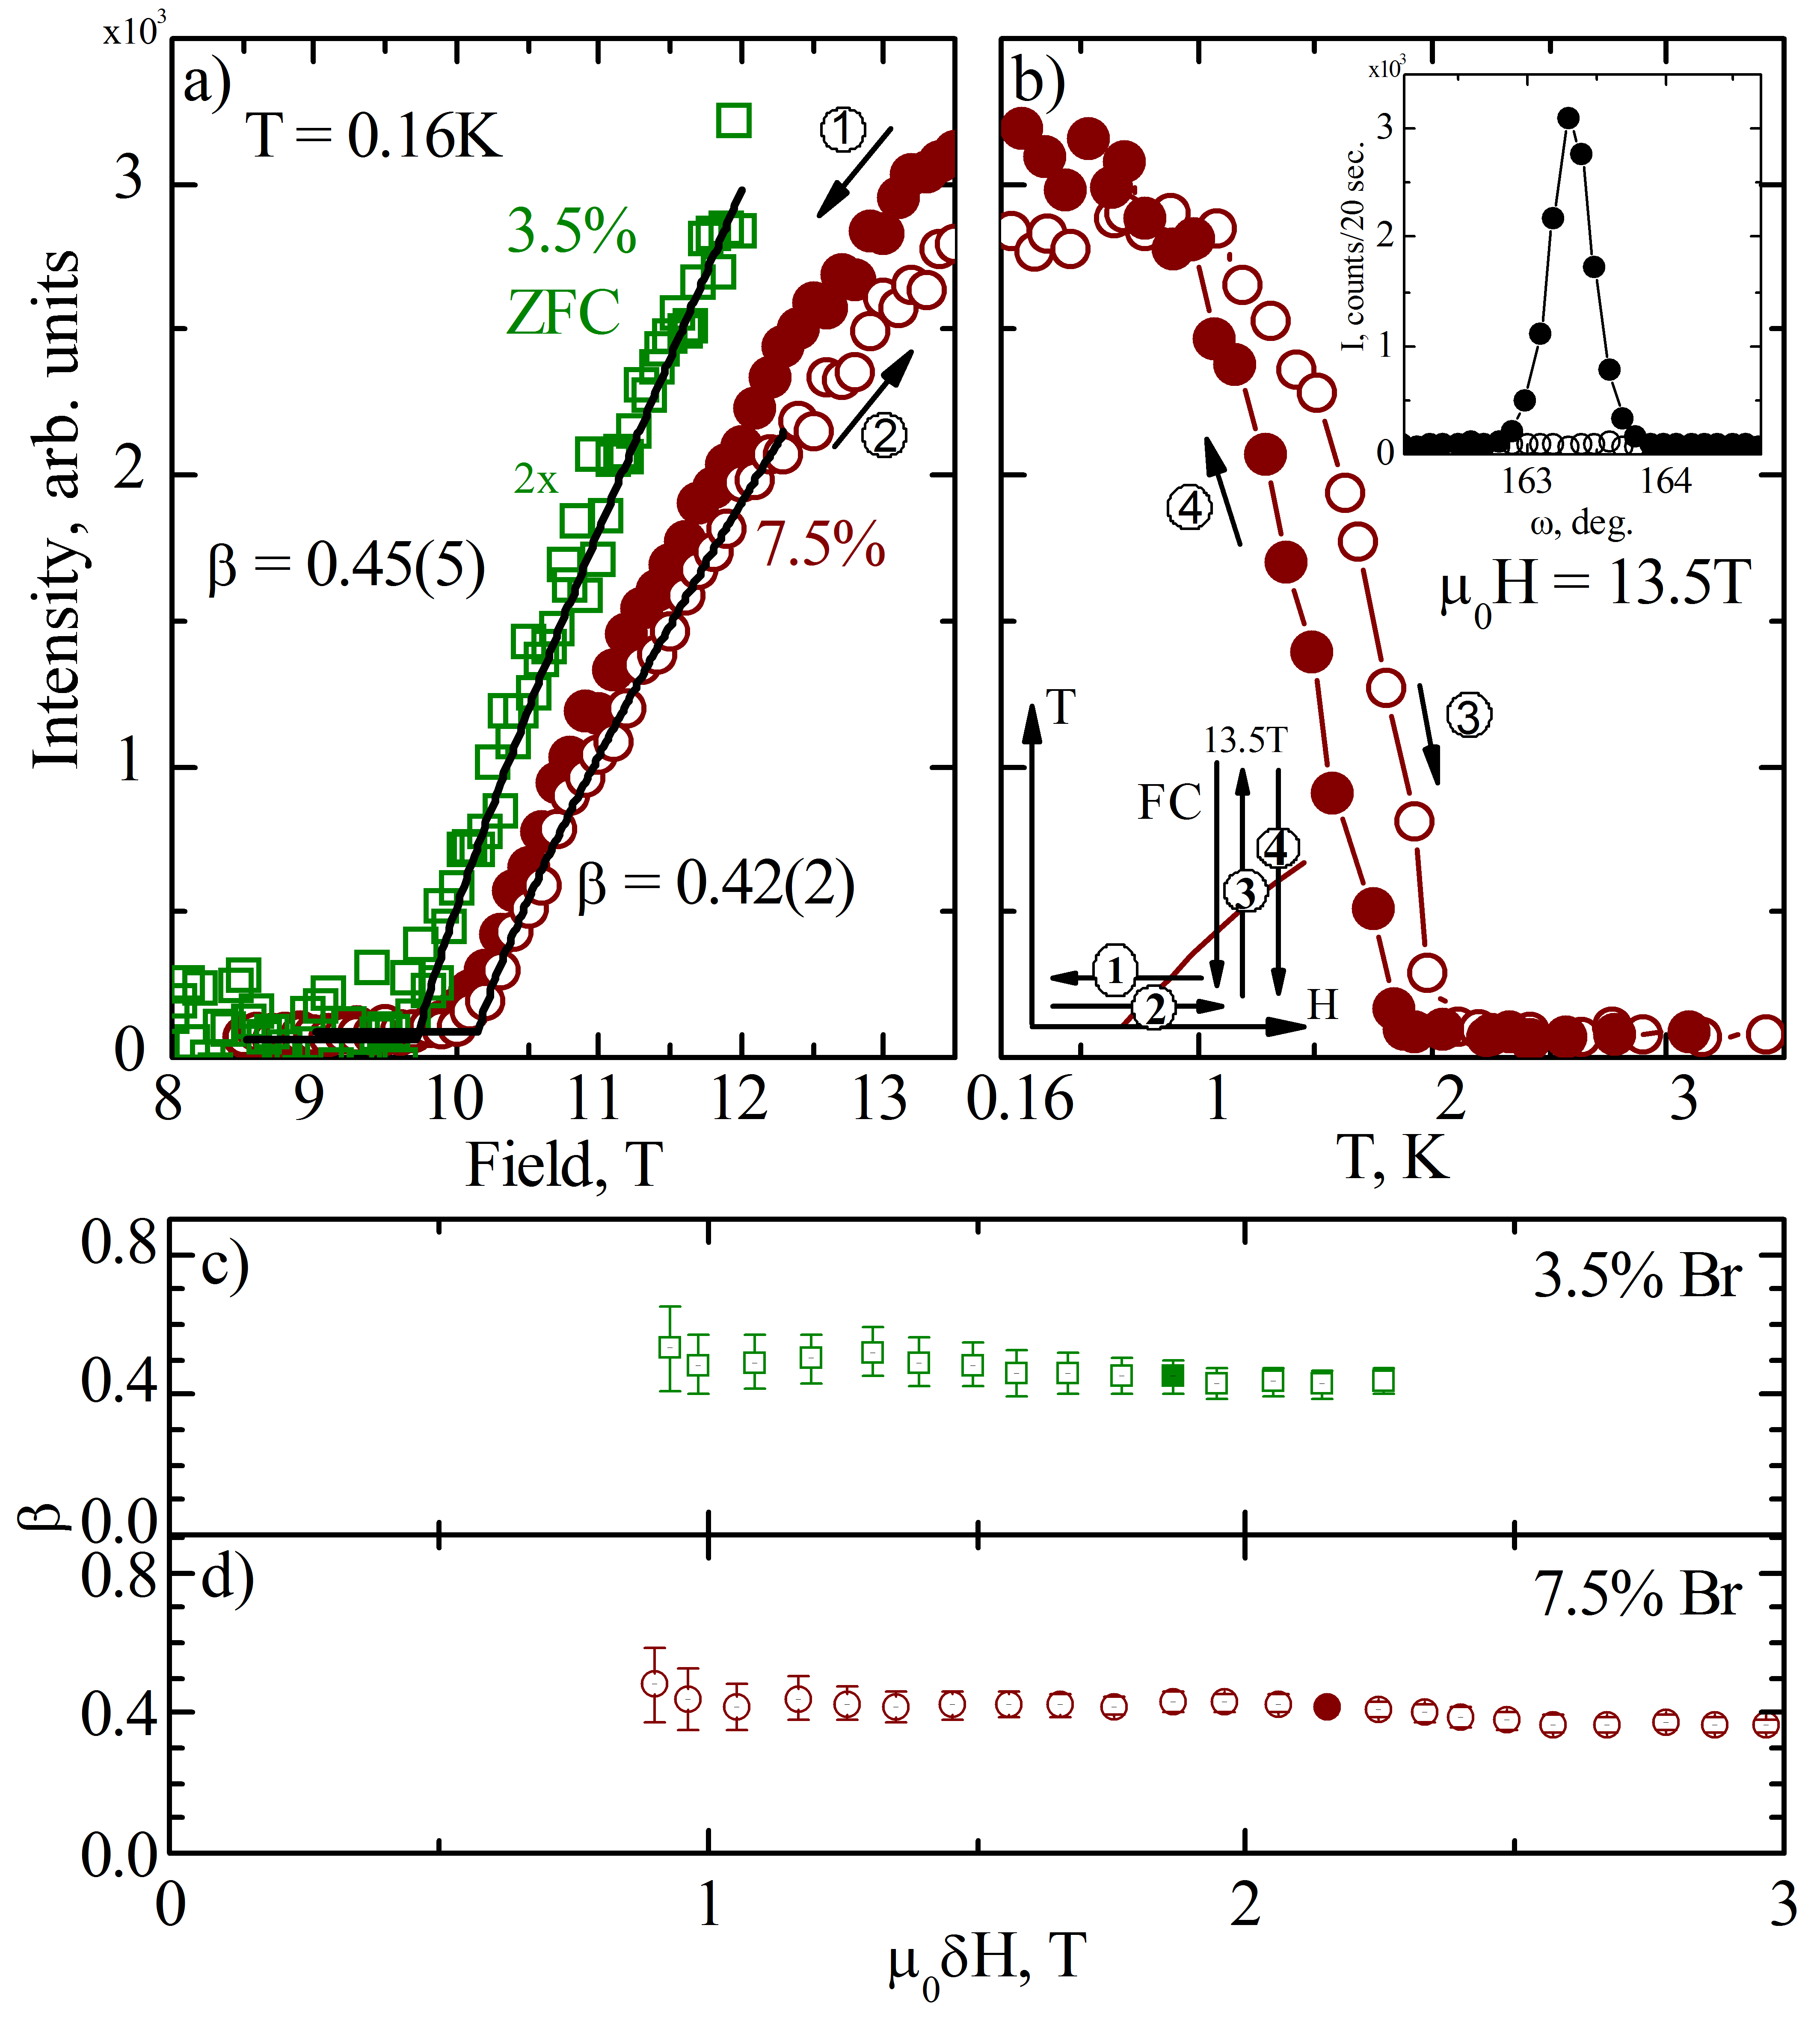
The behavior of the magnetic BEC order parameter was studied in neutron diffraction experiments. For the % and % samples these were carried out at the CRG-CEA D23 diffractometer at ILL and the RITA-II 3-axis spectrometer at PSI, respectively. In the two experiments, we used Cu monochromator to produce neutrons of incident energies 50 meV at ILL and pyrolitic graphite for 4.6 meV neutrons with Be filter in front of the analyzer at PSI. Sample environment was in all cases a split coil cryomagnet with a 3He-4He dilution cryostat. The magnetic field was applied along in the first and along the crystallographic axis in the second experiment. As previously reported for PHCC,Stone et al. (2007) long range order in the BEC phase is marked by the appearance of new magnetic Bragg reflections half-integer reciprocal-lattice points . The inset in Fig.3b shows typical scans across the position measured in the % sample at K in the BEC phase, and the background collected at K in the paramagnetic state. To within experimental error, all magnetic reflections are resolution-limited.
The critical index was determined from measurements of the Bragg peak intensity in zero field cooled (ZFC) samples. These data were taken upon increasing the applied field at mK and are plotted in Fig.3a. was then determined in power law fits, assuming that peak intensity scales as as the square of the order parameter. As for , the fits for were performed for a series of shrinking fitting intervals, of magnetic field in this case. The fit results and standard deviation confidence intervals are plotted against in Figs. 3c,d. Following the reasoning described earlier, in our final analysis we have selected T and 2.15 T, for % and %, respectively. The resulting exponents are summarized in Table 1. In order to properly characterize the quantum critical point, one has to know in the limit . Previous studies of PHCC suggest that remains practically constant for K.Stone et al. (2007) We have additionally verified this behavior for our 3.5% PHCX sample. Thus, the 160 mK measurements are good estimates of the zero-temperature values. Comparing our results with those reported in Ref. Stone et al., 2007, we conclude that disorder does not significantly change the criticality of the order parameter.
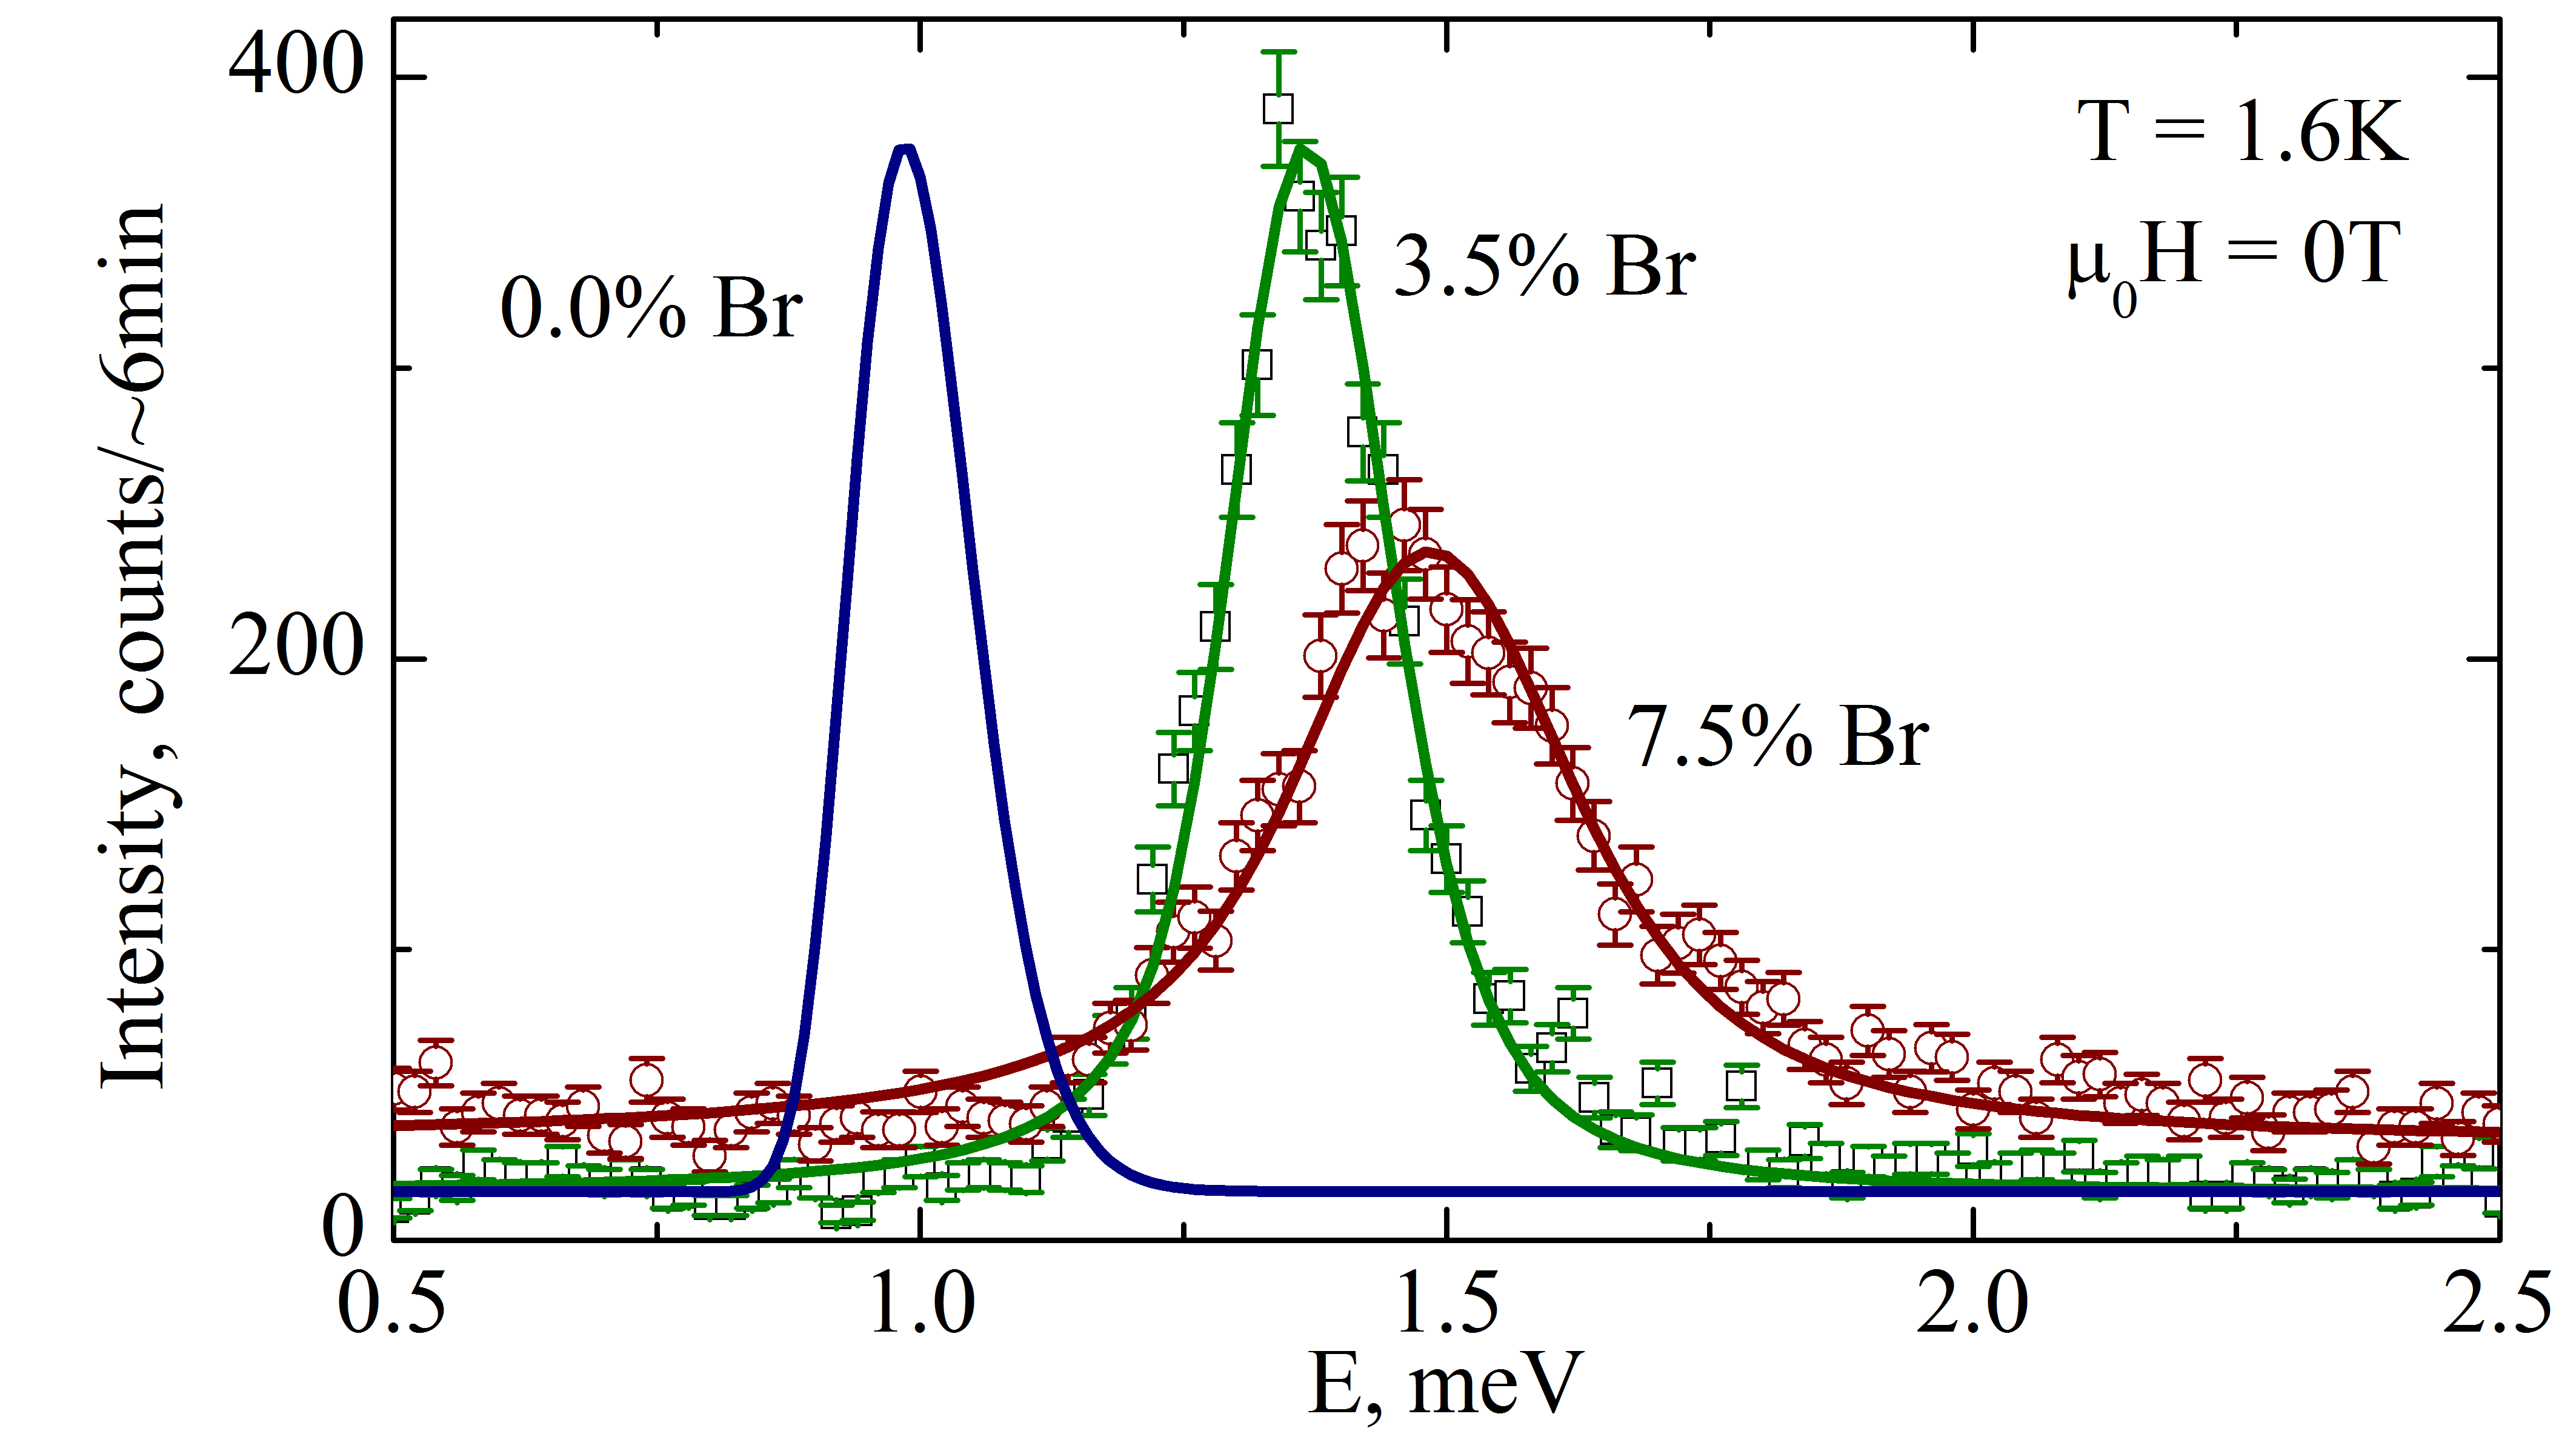
This is not to say that the effect of disorder is negligible. Inelastic neutron scattering experiments performed at zero field on the TASP 3-axis spectrometerSemadeni et al. (2001) at PSI using 3.5meV incident-energy neutrons and Be filter reveal that while the magnons are sharp in PHCC,Stone et al. (2007) they acquire a considerable intrinsic width in disordered samples. Typical constant-q scans at the AF zone-center (0.5,0.5,-0.5) in the x=3.5% and x=7.5% samples are shown in Fig. 4 by the open symbols. The solid lines are fits of Lorentzian energy profiles convoluted with the 4-dimensional instrumental resolution function Popovici (1975). For x=0% the line is a simulation assuming that peak shape is determined solely by resolution. The observed increase of gap energy with Br substitution is fully consistent with the observed increase of critical field and may be attributed to a change in the disorder-averaged exchange constants. However, the large intrinsic energy width meV and 0.25 meV for x=3.5% and x=7.5% samples, respectively, is entirely a disorder-induced effect dan .
Our present diffraction experiments show that disorder also affects the behavior of the order parameter deep within the high-field phase. In the 7.5% material the intensity of the magnetic reflection exhibits a history dependence. This is illustrated in Fig. 3a,b. Here we show data collected along a trajectory illustrated in the inset. No such behavior was reported for the disorder-free material, but a similar, and much stronger history effect was previously studied in a related system IPA-(Cu1-xBrx)Cl3.Hong et al. (2010) Related phase transition scenario that could lead to hysteretic behavior was discussed in Ref. Yu et al., 2010.
Theoretical and numerical predictions for the two measured critical exponents are shown in Table 1 for a direct comparison with our experiments. In the absence of disorder, one expects MF valuesStone et al. (2007) and , in reasonable agreement with the data for PHCC. Assuming the disordered case gives much larger value for the crossover exponent .dan This prediction is clearly inconsistent with our experiments. More recent numerical workPriyadarshee et al. (2006); Yu (2); Mei suggested smaller values of the exponent. Those from Refs. Priyadarshee et al., 2006; Mei, are less relevant to 3-dimensional ordering in PHCX, as they are obtained for a 2-dimensional model. On the other hand, the QMC calculations of Ref. Yu, 2 should be directly comparable to our data. The corresponding estimates of are in a rather good agreement with our experiments, as well as with those on the Br-substituted DTN compound.Yu (2) A relevant theoretical study of is presently lacking. The claimed observationYamada et al. (2011) of values consistent with can be due to overinterpretation of limited dataset. Evidence is mounting for the breakdown of the hypothesis in the Bose Glass to BEC quantum phase transition.
This work is partially supported by the Swiss National Fund under project 2-77060-11 and through Project 6 of MANEP. ML acknowledges support from DanScat. We thank Dr. V. Glazkov for his involvement in the early stages of this project.
References
- Giamarchi et al. (2008) T. Giamarchi, C. Ruegg, and O. Tchernyshev, Nature Physics 4, 198 (2008).
- Giamarchi and Schulz (1987) T. Giamarchi and H. J. Schulz, Europhys. Lett. 3, 1287 (1987).
- Fischer et al. (1989) M. P. A. Fisher, P. B. Weichman, G. Grinstein, and D. S. Fisher, Phys. Rev. B 40, 546 (1989).
- Nohadini et al. (2005) O. Nohadani, S. Wessel, and S. Haas, Phys. Rev. Lett. 95, 227201 (2005).
- Weichman and Mukhopadhyay (2007) P. B. Weichman and R. Mukhopadhyay, Physical Review Letters 98, 245701 (2007).
- Weichman and Mukhopadhyay (2008) P. B. Weichman and R. Mukhopadhyay, Physical Review B 77, 214516 (2008).
- Priyadarshee et al. (2006) A. Priyadarshee, S. Chandrasekharan, J.-W. Lee, and H. U. Baranger, Physical Review Letters 97, 115703 (2006).
- (8) H. Meier and M. Wallin, arXiv:1109.3022v2.
- Manaka et al. (2008) H. Manaka, A. V. Kolomiets, and T. Goto, Phys. Rev. Lett. 101, 077204 (2008).
- Manaka et al. (2009) H. Manaka, H. A. Katori, O. V. Kolomiets, and T. Goto, Phys. Rev. B 79, 092401 (2009).
- Hong et al. (2010) T. Hong, A. Zheludev, H. Manaka, and L.-P. Regnault, Phys. Rev. B 81, 060410 (2010).
- Yamada et al. (2011) F. Yamada, H. Tanaka, T. Ono, and H. Nojiri, Phys. Rev. B 83, 020409 (2011).
- Yu (2) R. Yu, L. Yin, N. S. Sullivan, J. S. Xia, C. Huan, A. Paduan-Filho, N. F. Oliveira Jr., S. Haas, A. Steppke, C. F. Miclea, F. Weickert, R. Movshovich, E.-D. Mun, V. S. Zapf and T. Roscilde, arXiv:1109.4403v2.
- Wulf et al. (2011) E. Wulf, S. Mühlbauer, T. Yankova, and A. Zheludev, Phys. Rev. B 84, 174414 (2011).
- Stone et al. (2001) M. B. Stone, I. Zaliznyak, D. H. Reich, and C. Broholm, Phys. Rev. B 64, 144405 (2001).
- Stone et al. (2006a) M. B. Stone, C. Broholm, D. H. Reich, O. Tchernyshyov, P. Vorderwisch, and N. Harrison, Phys. Rev. Lett. 96, 257203 (2006a).
- Stone et al. (2007) M. B. Stone, C. Broholm, D. H. Reich, P. Schiffer, O. Tchernyshyov, P. Vorderwisch, and N. Harrison, New Journal of Physics 9, 31 (2007).
- Stone et al. (2006b) M. B. Stone, I. A. Zaliznyak, T. Hong, C. L. Broholm, and D. H. Reich, Nature 440, 187 (2006b).
- (19) T. Yankova, D. Hüvonen, S. Muehlbauer, D. Schmidiger, E. Wulf, S. Zhao, A. Zheludev, T. Hong, V. O. Garlea, R. Custelcean, G. Ehlers, arXiv:1110.6375v1.
- Marcotrigiano et al. (1976) G. Marcotrigiano, L. Menabue, and G. C. Pellacani, Inorganic Chemistry 15, 2333 (1976).
- (21) where is a broadening parameter, is background, and are scaling constants and scaling exponents on the left and right side of respectively.
- Semadeni et al. (2001) F. Semadeni, B. Roessli, and P. Boni, Physica B 297, 152 (2001).
- Popovici (1975) M. Popovici, Acta Cryst. A31, 507 (1975).
- (24) A full account of the inelastic neutron scattering experiments are beyond the scope of the present paper that is focused on the field-induced transitions. It will be made elsewhere.
- (25) Lower limit on follows from Eqs. 5.8 and 5.10 in Ref. 3 as follows and with and . Since magnetization and boson density are proportianal one obtains . Since [Eq. 3.24 in Ref. 3] for all dimensions in the presence of disorder and we obtain dimension invariant .
- Yu et al. (2010) R. Yu, S. Haas, and T. Roscilde, Europhys. Lett. 89, 10009 (2010).