GX 3+1: the stability of spectral index as a function of mass accretion rate
Abstract
We present an analysis of the spectral and timing properties observed in X-rays from neutron star binary GX 3+1 (4U 1744-26) during long-term transitions between the faint and bright phases superimposed on short-term transitions between lower banana (LB) and upper banana (UB) branches in terms of its color-color diagram. We analyze all observations of this source obtained with the Rossi X-ray Timing Explorer and BeppoSAX satellites. We find that the X-ray broad-band energy spectra during these spectral transitions can be adequately reproduced by a composition of a low-temperature blackbody component, a Comptonized component (COMPTB) and Gaussian component. We argue that the electron temperature of the Compton cloud monotonically increases from 2.3 keV to 4.5 keV, when GX 3+1 makes a transition from UB to LB. We also detect an evolution of noise components (a very low frequency noise and a high frequency noise) during these LB – UB transitions. Using a disk seed photon normalization of COMPTB, which is proportional to the mass accretion rate, we find that the photon power-law index is almost constant () when mass accretion rate changes by factor 4. In addition, we find that the emergent spectrum is dominated by the strong Comptonized component. We interpret this quasi-stability of the index and a particular form of the spectrum in the framework of a model in which the energy release in the transition layer located between the accretion disk and neutron star surface dominates that in the disk. Moreover, this index stability effect now established for GX 3+1 was previously found in the source 4U 1728-34 and suggested for a number of other low mass X-ray neutron star binaries (see Farinelli & Titarchuk). This intrinsic behavior of neutron stars, in particular for sources, is fundamentally different from that seen in black hole binary sources where the index monotonically increases during spectral transition from the low state to the high state and then finally saturates at high values of mass accretion rate.
1 Introduction
Low mass X-ray binaries (LMXB) hosting a neutron star (NS) show a variety of spectral states and transitions between them. In this regard, the so-called atoll sources [see e.g. Hasinger & van der Klis (1989), van der Klis (2005)] are particularly interesting because they demonstrate a wide range of luminosities [the most of them show from 0.01 to 0.5 of the Eddington limit ]. It is worth noting that the name of atoll sources is associated with the shape traced in the color-color diagram (CD). This shape can be divided into two main regions, corresponding to two X-ray states of the source: the harder one is related to the island (IS) state and the softer one is related to the banana (B) state.
These spectra of NS sources can be described by blackbody (BB) components, with color temperatures keV and keV that are presumably related to the accretion disk and NS surface respectively. In addition, there is a thermal Comptonization component with electron temperature keV that is probably related to the transition layer (TL) located between the disk and NS [see Paizis et al. (2006); Farinelli & Titarchuk (2011); Seifina & Titarchuk (2011), hereafter FT11 and ST11 respectively]. An analysis of X-ray power spectra of atoll sources indicates to a tight relation between timing properties and the position on the CD, suggesting that the source timing and spectral properties are well determined by basic parameter such as mass accretion rate [see, e.g., Di Salvo et al. (2001)].
GX 3+1 is one of the brightest atoll sources associated with a bulge component of our Galaxy. GX 3+1 along with GX 9+9, GX 9+1 and GX 13+1 form the subclass of persistently bright atoll sources, which are always in the banana state [see Hasinger & van der Klis (1989)]. In particular, two-branch structures have been observed in the CD and hardness-intensity diagram (HID) of GX 3+1 [Stella et al. (1985); Lewin et al. (1987); Schultz et al. (1989); Homan et al. (1998); Muno et al. (1994); Schnerr et al. (2003)]. Specifically, their tracks in the X-ray CD are long, diagonal and slightly curved, while their fast timing properties are dominated only by a relatively weak (1 – 4% rms) power-law shaped noise component. These aforementioned atoll sources are intermediate in terms of luminosity that changes in the range 0.1-0.5 of [see Christian & Swank, (2006) and Ford & van der Klis (2000)].
In contrast to other atoll sources and Z sources, these bright atoll sources have so far not shown kHz QPOs [see Wijnands et al., (1998); Strohmayer (1998); Homan et al. (1998); Oosterbroek et al. (2001); Schnerr et al. (2003)], which can be attributed to the fact that these objects do not reach the left lower banana (LLB), where other atoll sources exhibit kHz QPOs [van der Klis (2000)]. For example, the weaker atoll sources, such as e.g. 4U 1608-52, 4U 0614+09 or 4U 1728-34, show kHz QPOs in LLB.
X-ray data of GX 3+1 (4U 1744-26) obtained in broad energy ranges using SAX (0.1 – 200 keV) and RXTE (3 – 200 keV) offer a unique possibility to further investigate, in detail, the evolution of X-ray spectral properties during transition events. This bright atoll source shows long-term transitions from the fainter phase to its brighter phase in X-rays and vice versa when the corresponding luminosity changes, at least, by a factor of 4, while on time scales of hours GX 3+1 demonstrates low flux variabilities as transitions between LB and UB states. Naturally one can pose a fair question: what is the physical mechanism responsible for the source emission during these luminosity changes and particularly how the spectral index changes during these transitions?
GX 3+1 was discovered during an -rocket flight on June 16, 1964 (Bowyer et al., 1965). Subsequently, this source was observed many times during various observational campaigns. Detailed long-term monitoring observations of GX 3+1 was performed by All Sky Monitor on [see Asai et al. (1993)]; EXOSAT [see Schultz et al. (1989)]; RXTE [see Bradt et al. (1993); Kuulkers & van der Klis (2000)], Wide Field Camera (WFC) of SAX [see den Hartog et al. (2003)] and also by INTEGRAL [see Paizis et al. (2006)]. In particular, den Hartog et al. (2003) found three types of variability: - variation (of order of seconds), variability on a daily (hourly) time scale and sinusoidal-like variation on a time scale of years. However, it is surprising that the hardness ratio, which can be a measure of the spectral shape, stays almost constant during these observations.
Although an optical counterpart has not yet been identified [e.g. Naylor et al., (1991)] GX 3+1 is presumably a low mass X-ray binary in which a neutron star is accompanied by a low-mass star of spectral type A or a later. During an active stage the companion overflows its Roche lobe and transfers matter onto the NS via an accretion disk. This process is possibly accompanied by nuclear burning of helium or hydrogen layer of NS surface as a result of the matter accumulation on the NS surface (Hanson & van Horn, 1975). Unstable fusion occurs leading to thermonuclear flashes which can be observable in the form of X-ray bursts, so-called type-I X-ray bursts (Woosley & Taam, 1976). GX 3+1 does exhibit fast variability in the form of type-I X-ray bursts, which were extensively studied by a number of X-ray missions (Asai et al., 1993), [Pavlinsky et al. (1994), Molkov et al., (1999)] and by RXTE [Kuulkers & van der Klis (2000) and Kuulkers (2002)] and by INTEGRAL (Chenevez et al., 2006).
A unique super-burst with a decay time of 1.6 hours was detected with the All Sky Monitor (ASM) on RXTE (Kuulkers, 2002). One of the shortest bursts ever seen exhibits a quick (i.e., less than 2 seconds) radius expansion phase, indicating that the burst luminosity was at the Eddington luminosity, causing the NS atmosphere to expand due to radiation pressure. This implies a distance to the source is about 4.5 kpc, assuming that the NS atmosphere is hydrogen-rich [see more details in Kuulkers & van der Klis (2000)].
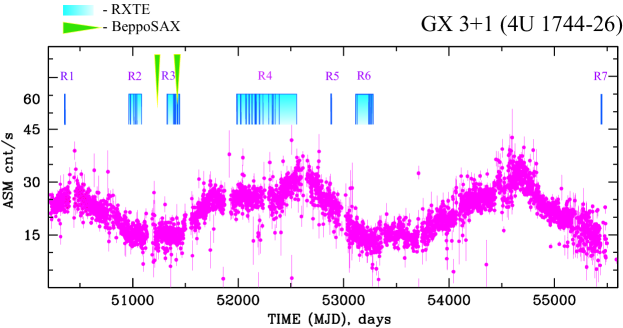
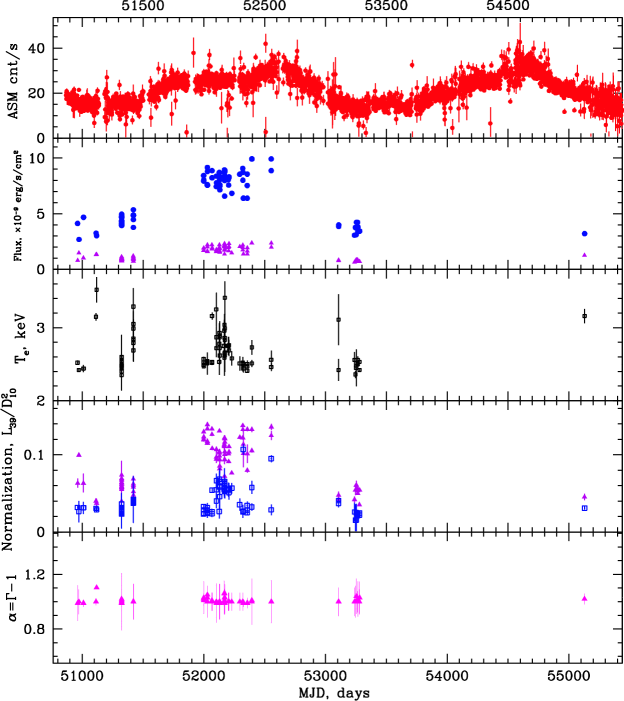
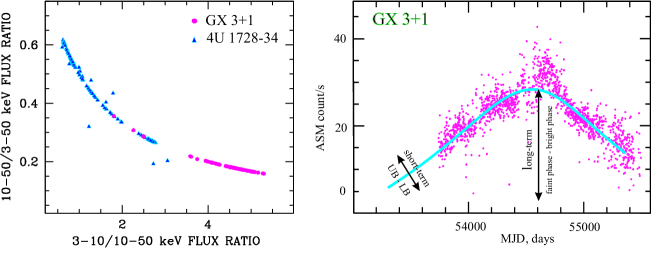
In this Paper we concentrate our efforts on the spectral and timing properties of GX 3+1 related to changes in mass accretion rate, which are seen as the and variabilities. Previously, an analysis of the burst properties of GX 3+1 as a function of mass accretion rate on the time scales larger than one minute were presented by Asai et al. (1993) and den Hartog et al. (2003). In particular, the variability has been revealed during transitions from the faint phase to the bright phase of luminosity and are generally caused by significant increase of mass accretion rate. The variability is presumably related to moderate local variability of mass accretion rate and revealed as local transitions between lower banana and upper banana states. The variability has been investigated with the RXTE/ASM light curve, Wide Field Camera (WFC) of SAX (den Hartog et al., 2003) and the all sky monitor on (Asai et al., 1993) and these observations indicate that the flux oscillates semi-sinusoidally with a period of 6 – 7 years (see Fig. 1).
Moreover, the measurements with its Large Area Detector (Asai et al., 1993) show a constant 1 – 20 keV spectral shape over the fainter phases and also during brighter phases on luminosity suggest a constancy of the spectral index. This stability of the X-ray spectral shape over the bright and faint phases was also been confirmed by the WFC BeppoSAX measurements in the 2 – 28 keV band which showed minimal spectral changes (den Hartog et al., 2003).
The stability of the index was noted previously by FT11, for a number of NS LMXB at different luminosities. They collected X-ray spectra obtained by BeppoSAX and demonstrated the relative stability of spectral index approximately of 1 () for quite a few NS sources X 1658-298, GX 354-0, GS 1826-238, 1E 1724-3045, Cyg X-1, Sco X-1, GX 17+2 and GX 349+2 at different spectral states. Recently ST11 presented results of analysis of X-ray spectra for atoll source 4U 1728-34, detected with BeppoSAX and RTXE at different luminosities and values of the best-fit electron temperatures. These results indicate that the value of the index varies slightly about a value of 1, (or the photon index varies around 2) independently of the electron temperature of the Compton cloud and luminosity. This unique stability of the photon index may be an intrinsic property of NS at least for the atoll sources. It is probably determined by common physical conditions for this class of sources. FT11 & ST11 interpreted this quasi-stability of the index in the framework of a model in which the spectrum is dominated by a strong thermal Comptonized component formed in the transition layer (TL) located between the accretion disk and neutron star surface. Indeed, the index quasi-stability takes place when the energy release in the TL is much higher than the photon energy flux coming from the accretion disk and illuminating the TL.
The evolution of spectral parameters of compact objects in X-ray binaries is of great interest for understanding their nature. It is well known that many black hole (BH) candidate binaries exhibit correlations between mass accretion rate and photon power-law index [see Shaposhnikov & Titarchuk (2009) and Titarchuk & Seifina (2009), hereafter ST09 and TS09, respectively]. In the soft states of BHs these index- correlations almost in any case show a saturation of at high values of the . This saturation effect can be considered as a black hole signature or equivalently as a signature of a converging flow into BH (ST09 and TS09).
In this Paper we present the analysis of the BeppoSAX available observations and RXTE/PCA observations during 1996 – 2010 years for GX 3+1. In §2 we present the list of observations used in our data analysis while in §3 we provide the details of X-ray spectral analysis. We analyze an evolution of X-ray spectral and timing properties during the state transition in §4. We make our conclusions in §5.
2 Data Selection
Broad band energy spectra of the source were obtained combining data from three BeppoSAX Narrow Field Instruments (NFIs): the Low Energy Concentrator Spectrometer (LECS) for 0.3 – 4 keV (Parmar et al., 1997), the Medium Energy Concentrator Spectrometer (MECS) for 1.8 – 10 keV (Boella et al., 1997) and the Phoswich Detection System (PhDS) for 15 – 60 keV (Frontera et al., 1997). The SAXDAS data analysis package is used for processing data. For each of the instruments we performed the spectral analysis in the energy range for which response matrix is well determined. The LECS data have been re-normalized based on MECS. Relative normalization of the NFIs were treated as free parameters in model fitting, except for the MECS normalization that was fixed at a value of 1. We then checked this fitting procedure if these normalizations were in a standard range for each instruments111http://heasarc.nasa.gov/docs/sax/abc/saxabc/saxabc.html. In addition, spectra are rebinned accordingly to energy resolution of the instruments in order to obtain significant data points. We rebinned the LECS spectra with a binning factor which is not constant over energy (Sect.3.1.6 of Cookbook for the BeppoSAX NFI spectral analysis) using template files in GRPPHA of XSPEC 222http://heasarc.gsfc.nasa.gov/FTP/sax/cal/responses/grouping. Also we rebinned the PhDS spectra with a linear binning factor of 2, grouping two bins together (resulting bin width is 1 keV). Systematic error of 1% have been applied to these analyzed spectra. In Table 1 we listed the BeppoSAX observations used in our analysis.
We have analyzed the available data obtained with RXTE (Bradt et al., 1993) which have been found in the time period from October 1996 to September 2010 [see also a review by Galloway et al. (2008)]. In our investigation we selected 101 observations made at different count rates (luminosity states) with a good coverage of rise-decay transition tracks. We have made an analysis of RXTE observations of GX 3+1 during fourteen years for 7 intervals indicated by blue rectangles in Figure 1 ().
RXTE/PCA spectra have been extracted and analyzed, wherein PCA Standard 2 mode data, collected in the 3 – 50 keV energy range, using the most recent release of PCA response calibration (ftool pcarmf v11.1). The relevant deadtime corrections to energy spectra have been applied. We used the data which are available through the GSFC public archive (http://heasarc.gsfc.nasa.gov). In Table 2 we presented the groups of RXTE observations which cover the source evolution from faint to bright (phase) events. Note that available RXTE data contains one “ phase” set () and six “ phase” set ( – , – ). The PCA energy spectra were modeled using XSPEC astrophysical fitting software. Systematic error of 0.5% have been applied to the analyzed spectra.
We have also used public GX 3+1 data from the All-Sky Monitor (ASM) on-board RXTE, which show long-term quasi-periodic variability of the mean soft flux during six years cycle (Fig. 1). We use definitions of the and on luminosity phases to relate these phases to the source luminosity and we demonstrate that during the bright/faint phase transition of GX 3+1 COMPTB normalization changes from 0.04 to 0.14 where is the soft photon luminosity in units of erg/s and in units of 10 kpc is distance to the source.
3 Spectral Analysis
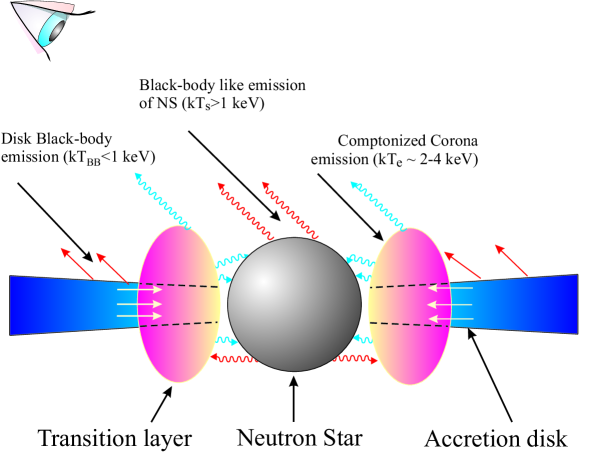
In our spectral data analysis we use a model which consists a sum of a Comptonization component () [COMPTB is an XSPEC contributed model333http://heasarc.gsfc.nasa.gov/docs/software/lheasoft/xanadu/xspec/models/comptb.html, see Farinelli et al. (2008), hereafter F08], soft blackbody component of temperature and Gaussian line component. The spectral component has the following parameters: temperature of the seed photons , energy index of the Comptonization spectrum (), electron temperature , illumination (Comptonization) fraction of the Compton cloud by the soft (NS) photons, , and the normalization of the seed (NS) photon spectrum .
We include a simple Gaussian component in the model, which parameters are a centroid line energy , the width of the line and the normalization to fit the data in the 6 – 8 keV energy range. We also use the interstellar absorption with a column density . It should be noted that we fixed certain parameters of the component: (low energy index of the seed photon spectrum) and because we neglect an efficiency of the bulk inflow effect vs the thermal Comptonization for NS GX 3+1. We apply a value of hydrogen column cm-2, which was found by Oosterbroek et al. (2001).
Initially, we have tried a model consisting of an absorbed thermal component () and a thermal Comptonization component () but this model gave a poor description of data. Significant positive residuals around 6.5 keV suggest the presence of fluorescent iron emission line. The addition of line component at 6.4 keV considerably improves fit quality and provides a statistically acceptable .
At the first time the fluorescent iron emission line in GX 3+1 was detected by Oosterbroek et al. (2001) using SAX on 1999 August, 30 (id=20835001). Oosterbroek et al. (2001) successfully described this emission feature with the line model and they used a model consisting of thermal component (dominating energy release around 1 keV) and a thermal Comptonization tail to describe the 0.1 – 50 keV continuum. However, they needed to add a 2% systematical uncertainty to LECS and MECS data to obtain acceptable . We investigate a possibility to further improve a quality of the fit.
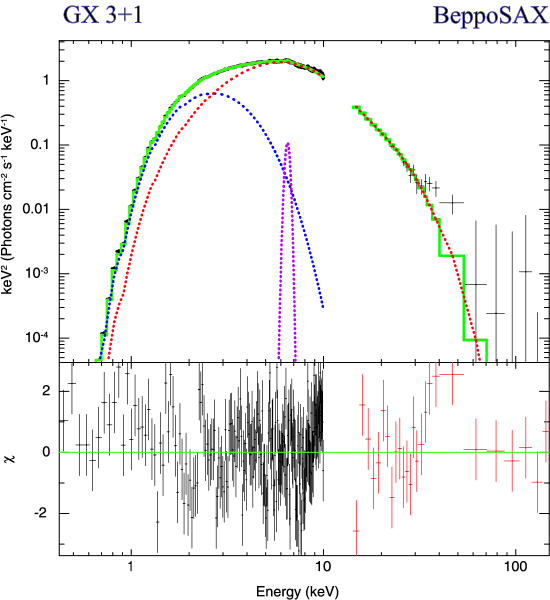
In Figure 2 we illustrate our spectral model as a basic model for fitting the BeppoSAX and RXTE spectral data for GX 3+1. We assume that accretion onto a neutron star takes place when the material passing through the two main regions: a geometrically thin accretion disk [the standard Shakura-Sunyaev disk, see Shakura & Sunyaev (1973)] and the transition layer (TL), where NS and disk soft photons are upscattered off hot electrons. In other words, in our picture, the emergent thermal Comptonization spectrum is formed in the TL, where thermal disk seed photons and soft photons from the neutron star are upscattered off the relatively hot plasma (electrons). Some fraction of these seed soft photons can be also seen directly. Red and blue photon trajectories shown in Fig. 2 correspond to soft (seed) and hard (up-scattered) photons respectively.
We show examples of X-ray spectra in Figs. 3 – 4 for SAX and RXTE data respectively. Spectral analysis of BeppoSAX and RXTE observations indicates that X-ray spectra of GX 3+1 can be described by a model with a Comptonization component represented by the model. Moreover, for broad-band BeppoSAX observations this spectral model component is modified by photoelectric absorption at low energies.
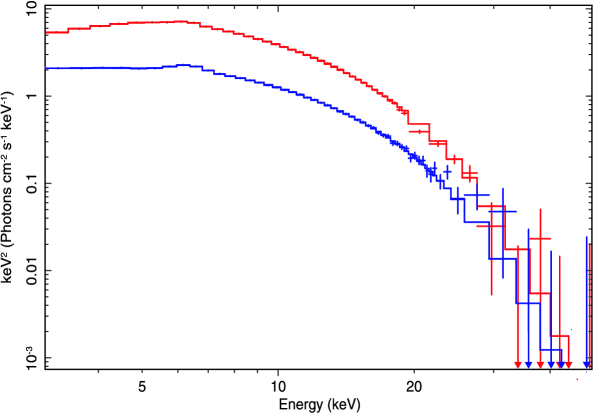
On the of Figure 3 we demonstrate the best-fit BeppoSAX spectrum of GX 3+1 in units of () [where is energy flux in erg, per keV and per second] using our model for BeppoSAX observation (id=20603001) carried out on 28 February – 1 March 1999. The data are presented by crosses and the best-fit spectral model wabs*(blackbody + COMPTB + Gaussian) by green line. The model components are shown by blue, red and crimson lines for blackbdody, COMPTB and Gaussian components respectively. On the we show vs photon energy in keV. The best-fit model parameters are =1.990.07, =3.680.05 keV and =7.40.1 keV (reduced =1.08 for 457 d.o.f) (see more details in Table 3). In particular, we find that an addition of the soft thermal component with temperature 0.50.7 keV to the model significantly improves the fit quality of the BeppoSAX spectra. For the BeppoSAX data (see Tables 1, 3) we find that the spectral index is of 1.030.04 (or the corresponding photon index is 2.030.04).
Unfortunately RXTE detectors do not provide well calibrated spectra below 3 keV while the broad energy band of BeppoSAX telescopes allows us to determine the parameters of blackbody components at low energies. Thus, in order to fit the RXTE data we have to fix the temperature of blackbody component at a value of 0.6 keV obtained as an upper limit in our analyze of the BeppoSAX data. The best-fit spectral parameters using RXTE observations are presented in Table 4. In particular, we find that electron temperature of the component varies from 2.3 to 4.5 keV, while the photon index is almost constant () for all observations. It is worth noting that the width of component does not vary significantly and it is in the range of 0.5 – 0.8 keV.
Color temperature of component changes from 1.2 keV to 1.7 keV, which is consistent with that using the BeppoSAX data set of our analysis (see Table 3) and previous studies by Oosterbroek et al. (2001), den Hartog et al. (2003) and Chenevez et al. (2006). We should also emphasize that the temperature of the seed photons of the component usually increases up to 1.7 keV in the fainter phases and generally decreases to 1.2 keV in the phases.
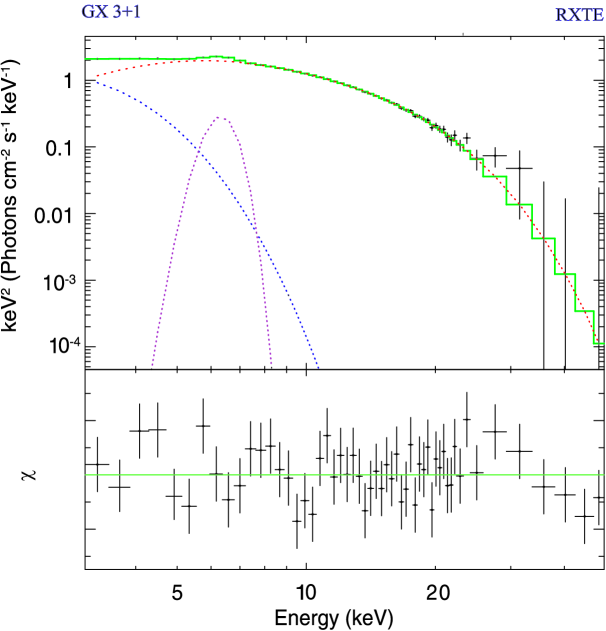
In Figure 4 we show an example of the best-fit RXTE spectrum of GX 3+1 for the fainter luminosity phases and the residuals (bottom panel) with for the 94307-05-01-000 observation. Blue, red and purple lines stand for , and components, respectively.
In Figure 5 we also show examples of typical photon spectra spectral diagrams of GX 3+1 during the phase (94307-05-01-00, ) and the phases (60022-01-13-01, ) detected with RXTE on MJD 55440.62 and 52544.48 respectively. The adopted spectral model shows a very good fidelity throughout all data sets used in our analysis. Namely, a value of reduced , where is a number of degree of freedom, is less or about 1.0 for most observations. For a small fraction (less than 2%) of spectra with high counting statistics reaches 1.5. However, it never exceeds our rejection limit of 1.7. Note that the energy range for the cases, in which we obtain the poor fit statistic (two among 101 spectra with =1.7 for 67 dof), are related to the iron line region. It is possible that the shape of iron line is more complex than a simple Gaussian (i.e. a blend of different energies, presence of the edge, or broadening by Comptonization). The fits tend to favor a broad line (see Table 4), which might be caused by Comptonization. However, this possible complexity is not well constrained by our data.
It is worth noting that we find some differences between our values of the best-fit model parameters and those in the literature. In particular, the photon index , estimated by Oosterbroek et al. (2001) for observation id=20835001, is 1.600.25. This discrepancy in index values can be a result of using slightly different spectral models by us and Oosterbroek et al. (2001).
Thus using the broad band BeppoSAX observations we can accurately determine all of the parameters of our spectral model while using the extensive observations of GX 3+1 by RXTE we are able to investigate the overall pattern of the source behavior during the spectral transitions in the 3 – 50 keV energy range.
4 Overall pattern of X-ray properties
4.1 Evolution of X-ray spectral properties during transitions
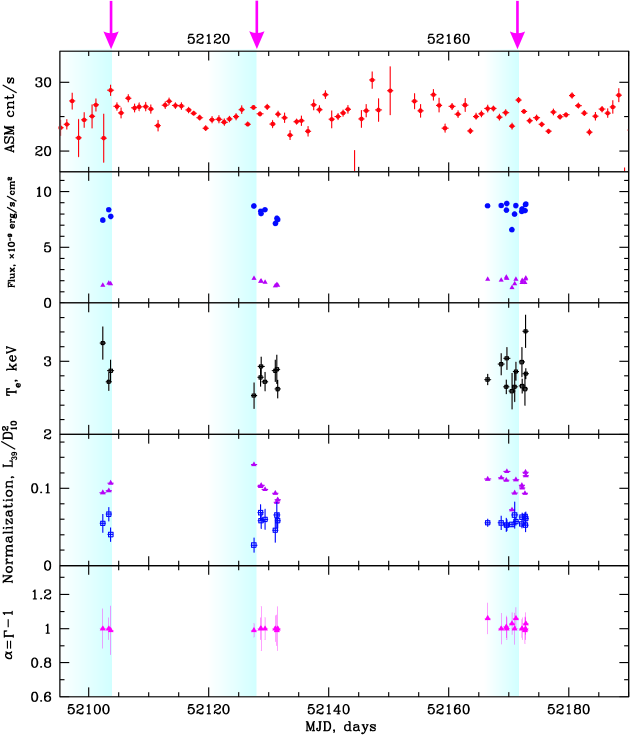
As was mentioned above, at time scales larger that one minute, GX 3+1 exhibits two kinds of variability, and . The former one () has a time scale of order years. This variability are seen in the phases and bright phases which are related to low and high luminosities, respectively. On the other hand the variability has a time scale of order of days and modulation depth in the 3 – 10 keV band is typically 20%. The ASM (2 – 12 keV) mean flux correlates with COMPTB normalization () and tends to anticorrelate with the electron plasma temperature of Compton cloud (CC) (see Fig. 6). Such variability is detected for both the and phases for GX 3+1. It should be noted that the COMPTB normalization changes are larger in the bright phase than that during the faint phase, while the electron temperature variations are almost the same for both phases.
One can relate and variabilities of GX 3+1 to slow and mild changes of mass accretion rate, respectively. The variability by factor 4 has been seen in the 1996 – 2010 observations by ASM/RXTE. The same kind of changes of the flux was also observed in the earlier observations by Makishima et al. (1983). In turn, in the next section it will be shown that the variability can be related to transitions between the brighter and fainter phases along with small variations of the electron temperature .
We found that the X-ray spectra of GX 3+1 over the and phases are quite stable. Moreover, we detected a constant 3 – 50 keV spectral shape over the and variability stages. The best-fit parameters are listed in Table 4. The faint/bright phase transitions are characterized by the spectra with an almost constant spectral index of 1, or photon index of 2 (see Fig. 7). We have also established common characteristics of the rise-decay spectral transition of GX 3+1 based on their spectral parameter evolution of X-ray emission in the energy range from 3 to 50 keV using PCA/RXTE data. In Figures 45 we present typical examples of the RXTE bright and faint phase spectra for GX 3+1. In fact, one can clearly see from these Figures that the normalization of the thermal component is a factor of 2 higher in the phase than that in the faint phase, although the photon indices for each of these spectra are concentrated around 2 (see Figs. 6 – 7).
In fact, we test the hypothesis of using -statistic criterion. We calculate the distribution of versus of and we find a sharp minimum of function around 1 which takes place in the range of with a confidence level of 67% and with a confidence level 99% for 101 d.o.f. (see the similar Figure of for 4U 1728-34 in ST11). Using BeppoSAX data FT11 suggested that the photon index is approximately 2 for many NS binaries which are observed in different spectral states. FT11 characterize the spectral state by a value of electron temperature and they show that (or ) when changes from 2.5 to 25 keV.
A number of X-ray flaring episodes of GX 3+1 has been detected with RXTE during 20012002 ( set) with a good rise-decay coverage. We have searched for common spectral and timing features which can be revealed during these spectral transition episodes. We present the combined results of the spectral analysis of these observations using our spectral model in Figures 67. ASM/RXTE count rate is shown on the top panel of these Figures. Further, from the top to the bottom, we show the model flux in two energy bands 3 – 10 keV (blue points) and 10 – 50 keV (crimson points). In the next panel we show a change of the TL electron temperature . One can clearly see the low amplitude spectral transition on time scales of 1 – 2 days from the phase to the phase during the time period from MJD 52000 to MJD 52200 while only varies from 2.3 keV to 4.5 keV during this transition.
Normalizations of the and component (crimson and blue points respectively) are shown in the next panel of Figs. 6 and 7. In particular, one can see from Figures 67 how the normalization correlates with the variations of ASM count rate and the model flux in 3-10 keV energy band. On the other hand, the normalization of the component is almost constant except at the mild variability episode peak, when increases from 0.02 to 0.14 (see blue points in Figure 6 at MJD=52130 and 52170). Moreover these spectral variability transitions are related to a noticeable increase of flux in the 3 – 10 keV energy range and corresponding decrease of flux that takes place in the 10 – 50 keV energy range (see the second panels from above in Figs. 6 – 7).
The illumination fraction varies from 0.1 to 0.9 as seen from Figure 8 while the index only slightly varies with time around 1 (or ) (see Figs. 67). However in most cases the soft disk radiation of GX 3+1 is subjected to reprocessing in a Compton cloud and only some fraction of the soft photon emission component () is directly seen by the Earth observer. Note that changes with COMPTB normalization (see Fig. 8, the inner panel in the left-hand upper corner). The energy spectrum of GX 3+1 during almost all states is dominated by a Comptonized component while the direct soft photon emission is always weaker and detectable in the flaring episodes only (see also Figs. 67).
Note that for BHs a definition of spectral transition involves a change of photon index (see e.g. ST09). However there is no one-to-one correspondence between and cutoff (or efold) energy . Titarchuk & Shaposhnikov (2010) demonstrate using RXTE data for BH binary XTE J1550-564 that decreases when increases from 1.4 to until reaches 2.2 and then increases. Thus for a BH the main parameter used for the spectral transition definition is a variable photon index which monotonically increases when the source goes into the phase .
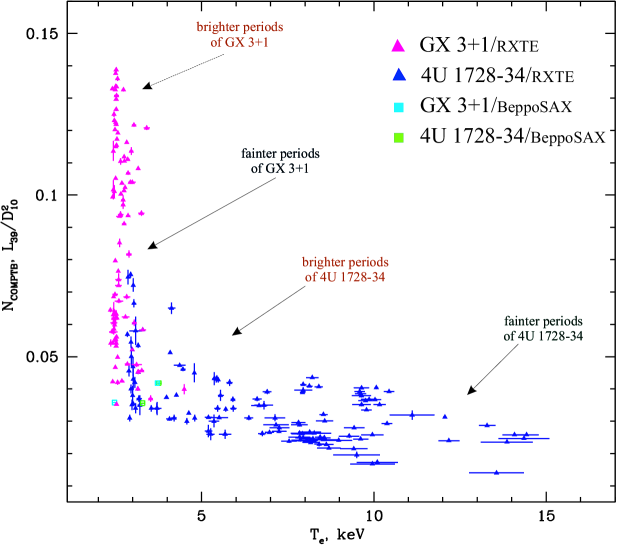
It is important to emphasize once again that in the NS binary GX 3+1 the transition from the phase to the phase takes place when COMPTB normalization changes from 0.04 to 0.15. Thus, we define the NS spectral transition in terms of the COMPTB normalization. In this case the faint phase is characterized by the low normalization value while the phase is related to the high normalization value. In Figure 9 we demonstrate the dependence of COMPTB normalization on using these best-fit parameters for GX 3+1 and 4U 1728-34 for the BeppoSAX and RXTE data. From this Figure one can clear see a monotonic behavior vs , namely decreases when the soft flux increases. It is worth noting that the values obtained using GX 3+1 data for BeppoSAX and RXTE reache the asymptotic value of about 2.5 keV at high values of the soft flux ().
To demonstrate transition properties of GX 3+1 in terms of flux (or luminosity) we define the hard color (HC) as a ratio of the flux in the 10 – 50 keV to that in the 3 – 50 keV energy band, and the soft color (SC) as a ratio of the flux in the 3 – 10 keV to that in the 10 – 50 keV energy range. Plotting HC versus SC we created diagram (CD, see the left panel of Fig. 10 ) for two atoll sources GX 3+1 () and 4U 1728-34 (). As it appears from this Figure the tracks of these two sources display a smooth and continuous (monotonic) function, pointing out the similar physical mechanism of hard/soft flux transition during a long-term source evolution for these two objects. In Fig. 10 ( panel) we demonstrate a fragment of ASM light curve of GX 3+1 which illustrates two types of flux variability. The long-term time trend (from bright to faint) is related to COMPTB normalization changes and while the second one shows short-term time variations (UB-LB) related to the Compton cloud electron temperature variations. The blue line displays a mean count rate and indicates to long-term variability of GX 3+1 flux. Note that the track of Fig. 10 ( panel) reflects a longterm evolution of GX 3+1.
It is worth noting that among all NSs only a few of and Z-sources demonstrate a full track on CD in a wide range of luminosity. For example, sources, such as 4U 1728-34, usually show a wide range of spectral states during transitions which are related to changes of the total luminosity and mass accretion rate. One can establish a substantial difference between a NS and a BH due to these flare episodes when a source evolves from the phase to the phase and when the plasma temperature of a Comptonized region changes remarkably (like in 4U 1728-34 from 2.5 keV to 15 keV during IS – B states). On the other hand GX 3+1 shows significant changes in the total luminosity but with only a slight variation of electron temperature in its state. However, the photon index stays around a value of 2 and is independent of the soft photon luminosity both in the faint phase and the bright phase.
4.2 Timing properties during LB-UB transitions
The RXTE light curves have been analyzed using the powspec task from FTOOLS 5.1. The timing analysis PCA/RXTE data was performed in 13 – 30 keV energy range using the event mode. The time resolution for this mode is 1.2 s. We generated power density spectra (PDS) in 0.1 – 500 Hz frequency range using light curves with -second time resolution. We subtracted the contribution due to Poissonian noise and Very Large Event Window for all PDSs. We used QDP/PLT plotting package to model PDS.
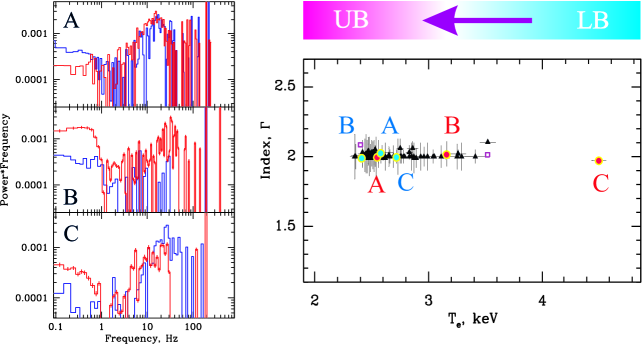
Previously, timing analysis of PCA/RXTE data for GX 3+1 observed on August 1999 (our R3 set), when the sources was in lower banana phase, was made by Oosterbroek et al. (2001). We investigated a timing behavior of GX 3+1 for our data set during all transitions between lower banana and upper banana phases (see Fig. 11). In particular, the power spectrum of GX 3+1 consists of very low-frequency noise (VLFN, described by a power-law) and high-frequency noise [HFN, described by a cutoff-power-law, see van der Klis (2005)].
In the LB phases (A , 60022-01-13-01, MJD=52554; A , 60022-01-01-00, MJD= 51998) the best-fit to the average power spectrum results in rms VLFN-component of 2% (in the 0.1 – 1 Hz range) described by power-law with the index of 1.7, whereas HFN rms (in the 1 – 100 Hz range) has 4.7% with 1.0 and 30 Hz. Generally the index of VLFN gradually decreases from 1.7 to 1.4 toward to UB. However in the vicinity of a transition point between LB and UB (red histogram of panel B of Fig. 11) jumps to 1.8 (B , 94307-05-01-00, MJD=55129) and decreases again to 1.4 (B , 60022-01-11-03, MJD=52357). In general, the UB power spectra of GX 3+1 are dominated by the VLFN with the brake at around 20 Hz at the lowest keV (see B point on the right-hand panel of Fig. 11). Specifically, during UB ( histogram of panels B of Fig. 11) one can see strong VLFN (rms=5.10.4%, =1.40.3, =139 for 102 d.o.f; all parameter errors correspond to 1 confidence level) and HFN with rms=1.70.3% and break frequency shifted from 30 Hz to 6 Hz. After UB GX 3+1 again returns to the LB showing similar to panel A properties of power density spectra (see panel C of Fig. 11).
Note that these components and their CD evolution are typical for of atoll-sources in the banana state (Hasinger & van der Klis, 1989) and caused by mass accretion rate change (van der Klis, 2005). This phase identification is supported by a combination of spectral (see Sect. 4.1) and timing properties in an agreement with – scheme.
While the aforementioned CD evolution of power spectra of GX 3+1 occurs on time scales from hours to days, we detected similar patterns for power spectrum evolution during LB – UB transitions for both faint phase and bright phase on luminosity during long-term variability within 14 years with a quasi-periodic trend during six years. The similarity of LB – UB transitions which are independent of bright/faint phases on luminosity indicates to similar accretion configurations in all phases.
In a previous analysis of other RXTE data of GX 3+1 Oosterbroek et al. (2001) report VLFN and HFN values, in LB state, which are similar to our values in interval R3, with the exception of VLFN strength for which they report 7.5% rms while we find 1.7% rms. All of the VLFN and HFN values of the analysis of EXOSAT data reported by Hasinger & van der Klis (1989) for GX 3+1 agree with our results.
4.3 Comparison of spectral and timing characteristics atoll sources GX 3+1 and 4U 1728-34
4.3.1 Quasi-Constancy of the photon index
The sources GX 3+1 and 4U 1728-34 demonstrate a similar behavior of the parameter vs mass accretion rate (or our COMPTB normalization), namely the quasi-constancy of the photon index and almost identical long-term variations of ASM mean count rate (see also ST11). According to FT11 and ST11 this observational fact can presumably indicate that the energy release in the transition layer for these two sources is much higher than cooling flux of the soft (disk) photons.
4.3.2 A difference of the electron temperature ranges in GX 3+1 and 4U 1728-34
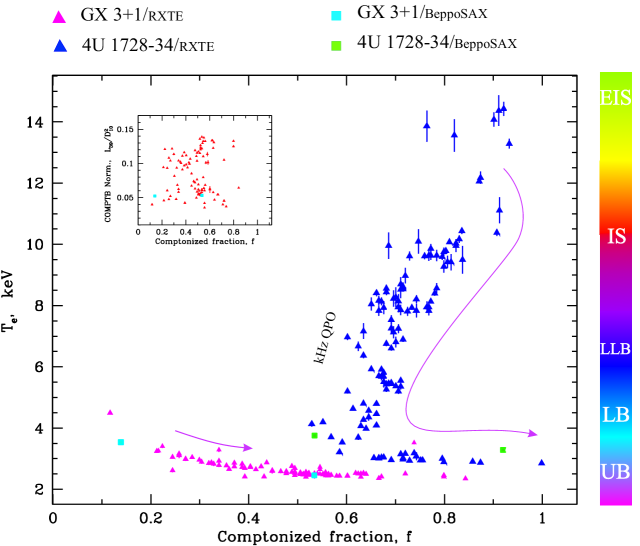
A comparison of the best-fit spectral parameters for these two atoll sources shows that a variability is generally related to changes of COMPTB normalization, and a variability is mainly correlated with the electron temperature variations (see Fig 10). Note that the ranges of disk and NS temperatures are similar for both of these objects, namely keV and 1.2 – 1.7 keV respectively. On the other hand variations of the electron temperature are quite different. The electron temperature changes in a wide range =2.5 – 15 keV for 4U 1728-34, while for GX 3+1 varies in a narrow range from 2.3 to 4.5 keV (see Figs. 8 – 9). The reason for this difference of temperature ranges is quite obvious. While 4U 1728-34 shows an evolution from the extreme island state (EIS) to the upper banana state (UB) [see, Di Salvo et al. (2001) and ST11] GX 3+1 demonstrates only a short LB – UB track on CD (see Fig. 8). These ranges of CD states are related to the ranges of .
4.3.3 Comparison of spectral evolution as a function of the COMPTB normalization for GX 3+1 and 4U 1728-34
We can also compare spectral parameter evolution for GX 3+1 and 4U 1728-34 using COMPTB normalization because the distances to these sources are almost the same (see Table 5). Namely, for GX 3+1 the distance is in the range of 4.26.4 kpc (Kuulkers & van der Klis, 2000), whereas for 4U 1728-34 it is 4.5 kpc (van Paradijs, 1978). In Figure 9 we show a correlation of COMPTB normalization presumably proportional to mass accretion rate) and the electron temperature for these two atoll sources. GX 3+1 demonstrates a wider range of COMPTB normalization (by factor of 2 higher than that for 4U 1728-34) while varies only from 2.5 to 4.5 keV. The common interval of for GX 3+1 and 4U 1728-34 is in the range 2.5 – 4.5 keV only and the low limit of the electron temperature of 2.5 keV takes place at the peak luminosity for 4U 1728-34 (see ST11) and during increases in luminosity for GX 3+1, i.e. during so called UB state (see Fig. 8).
4.3.4 Correlation of illumination parameter vs electron temperature and its relation with different states on color-color diagram
One can see from Table 5 that the range of illumination fraction of Compton cloud (TL) is wider for GX 3+1 () than that for 4U 1728-34 (). It can be related to different illumination of the transition layer (TL) for these two sources. For 4U 1728-34 the solid angle viewed from NS changes by factor 2 whereas in GX 3+1 that changes by factor 4. However, the photon index for these two sources which indicates that the energy release in the transition layer for these two sources is much higher than cooling flux of the disk photons (see FT11 and ST11 for details of X-ray spectral formation in TL).
In Figure 8 we present a plot versus for atoll sources GX 3+1 and 4U 1728-34 during variability. Pink/bright blue and blue/green points correspond to RXTE/Beppo observations of GX 3+1 and 4U 1728-34 respectively. COMPTB normalization measured in units versus is plotted in the incorporated top left panel for long-term () variability of GX 3+1 (see Table 4 for details). The bended arrows along the corresponding tracks correspond to an increase in mass accretion rate. On the right-hand side of Figure we also present the sequence of CD states which are listed according to the standard atoll-Z scheme (Hasinger & van der Klis, 1989). Here we also show that the CD sequence is definitely related to the electron temperature . The diagram of versus demonstrates a clear correlation and while the diagram versus , presented in the incorporated panel of Fig. 8 shows only chaotic scattering of points in a wide range of 0.2 – 0.9.
Moreover, we find two different track shapes on diagram of versus for two atoll sources GX 3+1 and 4U 1728-34 and their relations with the standard sequence of CD states (Fig. 8). When the fraction increases, the electron temperature decreases monotonically from approximately 4.5 keV to 2.3 keV for GX 3+1, while 4U 1728-34 demonstrates more complicated behavior pattern. At EIS, with a decrease of , the fraction slightly varies from 0.9 to 1. When further decreases from 12 keV to 4 keV, decreases from 0.9 to 0.5. Finally, during the LB-UB state transition increases from 0.5 to 1.
Thus we show that the evolution CD states can be traced by the correlation between and too. Note that the tracks of on this diagram resemble the atoll tracks on the standard color-color diagram (Schultz et al., 1989).
5 Conclusions
We present our analysis of the spectral properties observed in X-rays from the neutron star X-ray binary GX 3+1 during long-term transitions between the phase and the phase superimposed by short-term transitions between lower banana and upper banana states. We analyze all transition episodes for this source observed with BeppoSAX and RXTE. For our analysis we apply the good spectral coverage and resolution of SAX detectors from 0.1 to 200 keV along with coverage in the energy range from 3 to 50 keV.
We show that the X-ray broad-band energy spectra during all spectral states can be adequately fitted by the combination of a Blackbody, a Comptonized and a Gaussian components. We also show that photon index of the best-fit Comptonized component in GX 3+1 is almost constant, with a value of 2 and consequently is almost independent of COMPTB normalization which is presumably proportional to mass accretion rate (see Figs. 6 – 7, 11). We should remind a reader that this index stability has recently been suggested using X-ray observations of quite a few of other NS sources. Namely atoll sources: X 1658-298, GS 1826-238, 1E 1724-3045 and also Z-sources: Cyg X-2, Sco X-1, GX 17+2, GX 340+0, GX 349+2 were observed by BeppoSAX at different spectral states and also atoll source 4U 1728-34 observed by BeppoSAX and RXTE [see details in FT11 and ST11 respectively].
A wide variation of parameter , obtained in the framework of our spectral model, points out a significant variation of the illumination of Comptonization region (transition layer) by X-ray soft photons in GX 3+1.
Using BeppoSAX observations we find that there are two sources of blackbody emission, one is presumably related to the accretion disk and another one is related to the NS surface for which temperatures of soft photons are about 0.7 keV and 1.3 keV, respectively.
We demonstrate that our analysis of X-ray spectral and timing properties in atoll source GX 3+1 allows us to distinguish between and long-term variabilities, and link them with LB – UB state transitions and transitions between and phases in luminosity, respectively. In this way we described flux variability between LB and UB states on time scale of hours – days in terms of two basic spectral parameters, the electron temperature and illumination fraction . We argue that monotonically increases from 2.3 keV to 4.5 keV when GX 3+1 makes a transition from UB state to LB state. We also find, two noise components (VLFN & HFN) and their evolutiona during LB – UB transitions: the X-ray power spectra (PDS) in UB are dominated by very low frequency noise (VLFN) with the break around 20 Hz, whereas in LB the PDSs are dominated by a high frequency noise (HFN) in 1 – 100 Hz range and accompanied by reduced VLFN below 1 Hz.
We demonstrate that the photon index is approximately constant when the source moves from the faint phase to the bright phase and as well as during local transitions from lower banana to upper banana. In ST11 we presented strong theoretical arguments that the dominance of the energy release in the transition layer (TL) with respect to the soft flux coming from the accretion disk, leads to almost constant photon index .
Thus we argue that the stability of this index is an intrinsic signature of atoll sources while in BHs the index monotonically changes with mass accretion rate and ultimately saturates (see ST09 and ST11) ). Photon indices of BH candidates (GRS 1915+105, GX 339-4, SS 433, H1743-322, 4U 1543-47, Cyg X-1, XTE J1550-564 and GRO J1655-40) show clear correlation with mass accretion rate [ST09, TS09 and Seifina & Titarchuk (2010)]. This correlation is accompanied by an index saturation when exceeds a certain level. The behaviors of the index for GX 3+1 and 4U 1728-34 are clearly different from that for the sample of BHC sources. The photon index while mass accretion rate changes by factor 4.
We acknowledge discussion and editing of the paper content with Chris Shrader. We are very grateful to the referee whose constructive suggestions help us to improve the paper quality.
References
- Asai et al. (1993) Asai, K., et al., 1993, PASPJ, 45, 801
- Boella et al. (1997) Boella, G. et al. 1997, A&AS, 122, 327
- Bowyer et al. (1965) Bowyer, S., Byram, E. T., Chubb, T. A., Friedman, H. 1965, Science, 147, Issue 3656, 394
- Bradt et al. (1993) Bradt, H. V., Rothschild, R. E. & Swank, J. H. 1993, A&AS, 97, 355
- Chenevez et al. (2006) Chenevez, J. et al. 2006, A&A, 449, L5
- Christian & Swank, (2006) Christian, D. J. & Swank, J. H. 1997, ApJS, 109, 177
- den Hartog et al. (2003) den Hartog, P. R., et al. 2003, A&A, 400, 663
- Di Salvo et al. (2001) Di Salvo, T., Mendez, M., van der Klis, M., Ford, E. & Robba, N.R. 2001 ApJ, 546, 1107
- Farinelli et al. (2008) Farinelli, R., Titarchuk, L., Paizis, A. & Frontera, F. 2008, ApJ, 680, 602 (F08)
- Farinelli & Titarchuk (2011) Farinelli, R. & Titarchuk, L., 2011, A&A, 525, 102 (FT11)
- Ford & van der Klis (2000) Ford, E. C., van der Klis, M., Mendez, M., et al. 2000, ApJ, 537, 368
- Frontera et al. (1997) Frontera, F. et al. 1997, SPIE, 3114, 206
- Galloway et al. (2008) Galloway, D.K. et al. 2008, ApJS, 179, 360
- Hasinger & van der Klis (1989) Hasinger, G. & van der Klis, M. 1989, A&A, 225, 79
- Homan et al. (1998) Homan, J., van der Klis, M., Wijnands, R., Vaughan, B., & Kuulkers, E. 1998, ApJ, 499, L41
- Hanson & van Horn (1975) Hanson, C.J. & van Horn, H. M. 1975, ApJ, 195, 735
- Kuulkers (2002) Kuulkers, E. 2002, A&A, 383, L5
- Kuulkers & van der Klis (2000) Kuulkers, E & van der Klis, M. 2000, A&A, 356, L45
- Lewin et al. (1987) Lewin, W. H. G., van Paradijs, J., Hasinger, G., et al. 1987, MNRAS, 226, 383
- Makishima et al. (1983) Makishima, K. et al. 1983, ApJ, 267, 310
- Molkov et al., (1999) Molkov, S. V., Grebenev, S. A., Pavlinskij, M. N. & Sunyaev, R. A., 1999, Proc. of the 3rd INTEGRAL Workshop “The Extreme Universe”, ApLc, 38, 141
- Muno et al. (1994) Muno, M. P., Remillard, R. A., & Chakrabarty, D. 2002, ApJ, 568, L35
- Naylor et al., (1991) Naylor, T., Charles, P.A. & Longmore, A.J. 1991, MNRAS, 252, 203
- Oosterbroek et al. (2001) Oosterbroek, T., Barret, D., Gianazzi, M. & Ford, E.C. 2001, A&A, 366, 138
- Paizis et al. (2006) Paizis, A., Farinelli, R., Titarchuk, L., et al. 2006, A&A, 459, 187
- Pavlinsky et al. (1994) Pavlinsky, M. N., Grebenev, S. A. & Sunyaev, R. A. 1994, ApJ, 425, 110
- Parmar et al. (1997) Parmar, A. N., et al. 1997, A&AS, 122, 309
- Schnerr et al. (2003) Schnerr, R. S., Reerink, T., van der Klis, M., et al. 2003, A&A, 406, 221
- Schultz et al. (1989) Schultz, N. S., Hasinger, G. & Trumper, J. 1989, A&A, 225, 48
- Seifina & Titarchuk (2011) Seifina, E. & Titarchuk, L. 2011, ApJ, 737, 128 (ST11)
- Seifina & Titarchuk (2010) Seifina, E. & Titarchuk, L. 2010, ApJ, 722, 586 (ST10)
- Shakura & Sunyaev (1973) Shakura, N. I., & Sunyaev, R. A. 1973, A&A, 24, 337
- Shaposhnikov & Titarchuk (2009) Shaposhnikov, N. & Titarchuk, L. 2009, ApJ, 699, 443 (ST09)
- Stella et al. (1985) Stella, L., White, N. E., & Taylor, B. G. 1985, in Recent Results on Cataclysmic Variables, 125-128
- Strohmayer (1998) Strohmayer, T. 1998, in American Institute of Physics Conference Series, 397 (astro-ph/9802022v1)
- Titarchuk & Shaposhnikov (2010) Titarchuk, L. & Shaposhnikov, N. 2010, ApJ, 724, 1147
- Titarchuk & Seifina (2009) Titarchuk, L. & Seifina, E. 2009, ApJ, 706, 1463
- Titarchuk & Osherovich (1999) Titarchuk, L. G. & Osherovich, V. A. 1999, ApJ, 518, L95
- van der Klis (2005) van der Klis, M. 2005, Ap&SS, 300, 149
- van der Klis (2000) van der Klis, M. 2000, ARA&A, 38, 717
- van Paradijs (1978) van Paradijs, J. 1978, Nature, 274, 650
- Woosley & Taam (1976) Woosley, S. E. & Taam, R. E. 1976, Nature, 263, 101
- Wijnands et al., (1998) Wijnands, R., van der Klis, M., & van Paradijs, J. 1998, in IAU Symp. 188: The Hot Universe, 370
| Obs. ID | Start time (UT) | End time (UT) | MJD interval | CD state |
|---|---|---|---|---|
| 20603001 | 1999 Feb. 28 11:02:15 | 1999 Feb. 30 09:14:15 | 51237.4-51238.9 | upper banana |
| 20835001 | 1999 Aug. 30 18:33:08 | 1999 Aug. 31 04:54:32 | 51420.8-51421.91 | lower banana |
Reference. (1) Oosterbroek et al. (2001)
| Number of set | Dates, MJD | RXTE Proposal ID | Dates UT | Rem. | Phase on |
|---|---|---|---|---|---|
| lumonosity | |||||
| R1 | 50365 | 10069 | Oct. 9 03:36:00 – 04:08:00, 1996 | ||
| R2 | 50962-51118 | 30042, 30048 | May 29 – Nov. 1, 1998 | ||
| R3 | 51324-51445 | 40023, 404251 | May 26 – Sept. 24, 1999 | SAX | |
| R4 | 51998-52554 | 60022 | March 30, 2001 – Oct. 7, 2002 | ||
| R5 | 52881 | 80105 | Aug. 30 03:53:36 – 06:29:13, 2003 | ||
| R6 | 53108-53280 | 90022 | Apr. 13 – Oct. 2, 2004 | ||
| R7 | 55440.6-55440.8 | 94307 | Sept. 1 15:00:32 – 21:07:58, 2010 |
References: (1) Oosterbroek et al. (2001)
| Observational | MJD, | N | Eline, | (d.o.f.) | |||||||
|---|---|---|---|---|---|---|---|---|---|---|---|
| ID | day | keV | keV | keV | keV | ||||||
| 20603001 | 51237.5 | 0.47(3) | 2.65(2) | 1.30(3) | 0.99(7) | 3.68(5) | 0.09(4) | 4.18(3) | 7.4(1) | 0.55(4) | 1.08(457) |
| 20835001 | 51420.8 | 0.62(5) | 1.61(1) | 1.21(5) | 1.07(4) | 2.4(2) | -0.32(8) | 3.56(2) | 6.0(1) | 0.43(4) | 1.16(445) |
† The spectral model is , normalization parameters of and components are in units of where is the soft photon luminosity in units of 1037 erg/s, is the distance to the source in units of 10 kpc and component is in units of in line. †† Gaussian component is in units of ? total photons cm?2 s in line.
| Observational | MJD, | log(A) | N | , | Eline, | (d.o.f.) | F1/F | ||||||
|---|---|---|---|---|---|---|---|---|---|---|---|---|---|
| ID | day | keV | keV | keV | keV | ||||||||
| 10069-03-01-00 | 50365.172 | 1.00(8) | 2.40(2) | 0.03(1) | 10.88(2) | 1.10(8) | 2.74(5) | 6.53(3) | 0.58(5) | 0.95(4) | 1.1(67) | 6.79/1.28 | |
| 30042-04-01-00 | 50962.598 | 1.0(1) | 2.52(1) | -0.04(3) | 6.3(1) | 1.65(5) | 3.17(3) | 6.51(2) | 0.5(1) | 0.46(2) | 1.50(67) | 4.13/0.80 | |
| 30042-04-02-00 | 50973.668 | 1.02(7) | 2.42(1) | -0.1(1) | 9.9(1) | 1.17(4) | 2.6(1) | 6.5(1) | 0.5(1) | 0.37(8) | 1.12(67) | 2.69/1.49 | |
| 30048-01-01-00 | 51011.138 | 0.99(2) | 2.44(2) | 0.18(8) | 6.3(2) | 1.45(8) | 3.12(8) | 6.42(8) | 0.6(1) | 0.7(1) | 0.82(67) | 4.68/1.03 | |
| 30042-04-03-00 | 51113.941 | 1.01(2) | 3.15(2) | 0.39(5) | 4.00(6) | 1.5(1) | 3.05(2) | 6.53(1) | 0.50(8) | 0.42(1) | 0.87(67) | 3.26/1.31 | |
| 30042-04-03-01 | 51114.207 | 1.03(3) | 3.17(2) | 0.41(5) | 4.07(6) | 1.5(1) | 3.07(2) | 6.58(1) | 0.52(7) | 0.44(1) | 0.91(67) | 3.62/1.56 | |
| 30042-04-04-00 | 51118.739 | 1.1(1) | 3.52(8) | 0.45(6) | 3.7(1) | 1.7(5) | 2.86(3) | 6.51(4) | 0.6(2) | 0.47(2) | 1.18(67) | 3.03/1.34 | |
| 40023-01-01-00 | 51324.737 | 1.0(3) | 2.48(2) | 0.02(1) | 5.98(8) | 1.6(2) | 2.62(8) | 6.43(9) | 0.67(9) | 0.9(1) | 1.35(67) | 4.68/1.03 | |
| 40023-01-01-01 | 51325.310 | 1.0(2) | 2.40(1) | 0.23(3) | 5.78(6) | 1.6(2) | 2.64(9) | 6.43(5) | 0.67(8) | 0.73(7) | 0.75(67) | 4.15/0.88 | |
| 40023-01-01-02 | 51325.542 | 1.(1) | 2.46(1) | -0.01(1) | 5.85(4) | 1.6(2) | 2.38(8) | 6.45(5) | 0.62(6) | 0.73(8) | 1.26(67) | 4.06/0.77 | |
| 40023-01-03-00 | 51390.248 | 1.0(1) | 2.54(1) | 0.01(1) | 6.20(6) | 1.56(8) | 2.6(1) | 6.49(7) | 0.60(7) | 0.7(1) | 0.94(67) | 4.33/0.88 | |
| 40023-01-02-00 | 51398.243 | 0.9(2) | 2.53(1) | 0.04(2) | 5.61(5) | 1.4(1) | 2.68(9) | 6.45(5) | 0.64(6) | 0.76(9) | 1.01(67) | 3.99/0.81 | |
| 40023-01-02-01 | 51398.188 | 0.9(1) | 2.50(2) | 0.02(2) | 5.50(5) | 1.5(1) | 2.78(7) | 6.45(5) | 0.48(8) | 0.61(9) | 1.01(67) | 3.93/0.76 | |
| 40023-01-02-02 | 51399.644 | 0.9(1) | 2.49(8) | 0.01(1) | 6.93(8) | 1.2(1) | 2.47(5) | 6.46(9) | 0.69(9) | 0.96(8) | 0.53(67) | 4.74/0.94 | |
| 40023-01-02-03 | 51400.131 | 1.01(6) | 2.51(5) | 0.06(2) | 6.19(7) | 1.2(1) | 3.16(4) | 6.38(5) | 0.8(1) | 1.09(6) | 0.71(67) | 4.34/0.86 | |
| 40023-01-02-04 | 51400.192 | 1.01(9) | 2.4(1) | 0.06(2) | 5.77(6) | 1.18(3) | 2.83(5) | 6.45(9) | 0.52(5) | 0.61(6) | 0.85(67) | 3.97/0.75 | |
| 40023-01-02-05 | 51400.259 | 1.0(1) | 2.6(1) | -0.09(5) | 6.72(6) | 1.25(2) | 2.9(1) | 6.50(7) | 0.46(7) | 0.63(9) | 0.77(67) | 4.64/0.93 | |
| 40023-01-02-06 | 51400.325 | 1.0(1) | 2.45(7) | 0.18(9) | 6.19(5) | 1.25(8) | 3.04(8) | 6.46(8) | 0.41(6) | 0.45(9) | 0.92(67) | 4.26/0.92 | |
| 40023-01-02-07 | 51400.723 | 1.0(1) | 2.45(1) | 0.11(2) | 6.85(4) | 1.20(8) | 2.38(7) | 6.45(8) | 0.47(5) | 0.45(8) | 0.92(67) | 4.70/0.98 | |
| 40023-01-04-00 | 51404.304 | 0.99(1) | 4.50(4) | -0.9(1) | 3.99(9) | 1.82(3) | 3.63(9) | 4.55(5) | 0.50(7) | 0.70(6) | 1.70(67) | 4.16/0.94 | |
| 40023-01-03-01 | 51405.307 | 1.(1) | 2.48(1) | 0.09(2) | 6.38(6) | 1.20(8) | 2.32(9) | 6.55(8) | 0.56(9) | 0.60(8) | 1.28(67) | 4.39/0.92 | |
| 40425-01-01-00 | 51420.779 | 1.0(1) | 3.05(7) | -0.5(5) | 6.05(8) | 1.59(8) | 4.01(6) | 6.5(1) | 0.6(1) | 1.05(4) | 0.82(67) | 4.84/0.97 | |
| 40425-01-01-01 | 51420.846 | 1.09(5) | 2.83(9) | -0.31(7) | 6.85(7) | 1.59(9) | 4.09(9) | 6.5(1) | 0.62(9) | 0.87(9) | 1.05(67) | 5.36/1.21 | |
| 40425-01-01-02 | 51421.018 | 1.05(1) | 2.8(1) | -0.29(3) | 6.23(2) | 1.59(5) | 3.74(9) | 6.5(1) | 0.61(8) | 0.85(2) | 1.34(67) | 4.88/1.10 | |
| 40425-01-01-03 | 51421.084 | 1.01(1) | 3.29(9) | -0.29(3) | 5.83(5) | 1.59(8) | 4.19(6) | 6.5(1) | 0.65(5) | 0.86(3) | 1.30(67) | 4.87/0.98 | |
| 40425-01-01-04 | 51421.151 | 1.0(1) | 2.85(8) | -0.33(6) | 4.77(4) | 1.55(7) | 3.91(3) | 6.38(2) | 0.58(7) | 0.99(2) | 1.15(67) | 4.87/0.98 | |
| 40425-01-01-05 | 51421.218 | 1.08(9) | 2.99(5) | -0.43(3) | 5.22(5) | 1.49(8) | 4.11(2) | 6.38(4) | 0.59(4) | 1.11(8) | 1.39(67) | 4.47/0.88 | |
| 40425-01-01-06 | 51421.285 | 1.02(8) | 2.69(6) | -0.19(6) | 4.24(2) | 1.35(7) | 3.79(3) | 6.38(3) | 0.62(8) | 0.87(6) | 1.36(67) | 3.77/0.74 | |
| 40023-01-05-00 | 51445.320 | 0.99(3) | 2.59(9) | -0.06(4) | 7.38(7) | 1.24(8) | 2.7(1) | 6.47(8) | 0.46(4) | 0.62(4) | 0.84(67) | 4.96/1.03 | |
| 40023-01-03-01 | 51445.599 | 1.0(1) | 2.35(4) | 0.73(9) | 6.44(7) | 1.16(7) | 2.32(1) | 6.54(9) | 0.4(1) | 0.52(8) | 1.70(67) | 4.80/1.13 | |
| 60022-01-01-00 | 51998.64 | 1.06(3) | 2.49(1) | 0.04(1) | 12.03(1) | 1.20(5) | 2.86(2) | 6.24(2) | 0.5(1 | 1.50(6) | 1.07(67) | 7.94/1.69 | |
| 60022-01-01-01 | 51998.71 | 1.03(9) | 2.52(2) | 0.07(4) | 12.97(3) | 1.20(7) | 2.31(3) | 6.5(1) | 0.56(8) | 1.33(5) | 1.09(67) | 8.43/1.91 | |
| 60022-01-01-02 | 51998.78 | 1.01(3) | 2.57(1) | -0.04(1) | 11.92(3) | 1.2(1) | 3.26(2) | 6.59(5) | 0.58(7) | 1.33(7) | 0.87(67) | 8.43/1.91 | |
| 60022-01-01-03 | 51999.78 | 1.02(7) | 2.47(3) | 0.04(1) | 12.31(4) | 1.20(3) | 2.39(4) | 6.55(4) | 0.55(7) | 1.57(6) | 1.15(67) | 8.02/1.69 | |
| 60022-01-02-00 | 52028.61 | 1.00(9) | 2.51(6) | 0.03(1) | 11.50(3) | 1.20(5) | 2.74(4) | 6.56(2) | 0.53(6) | 1.22(5) | 1.13(67) | 7.56/1.62 | |
| 60022-01-02-01 | 52028.94 | 1.01(3) | 2.54(2) | 0.01(1) | 11.73(2) | 1.20(6) | 2.51(6) | 6.50(6) | 0.59(5) | 1.23(3) | 1.05(67) | 7.62/1.65 | |
| 60022-01-01-04 | 52029.47 | 1.07(3) | 2.52(1) | 0.06(2) | 13.88(6) | 1.17(9) | 3.15(2) | 6.50(7) | 0.62(7) | 1.61(8) | 0.98(67) | 9.15/2.02 | |
| 60022-01-01-05 | 52029.61 | 1.03(6) | 2.51(2) | 0.2(1) | 13.36(3) | 1.20(5) | 2.39(6) | 6.51(6) | 0.50(8) | 1.03(5) | 0.88(67) | 8.80/2.21 | |
| 60022-01-01-06 | 52029.69 | 1.05(3) | 2.53(4) | -0.01(1) | 11.54(4) | 1.20(4) | 2.84(9) | 6.54(2) | 0.53(9) | 1.26(6) | 1.40(67) | 7.57/1.58 | |
| 60022-01-03-00 | 52067.39 | 1.01(4) | 2.53(1) | 0.21(7) | 13.35(3) | 1.20(7) | 2.62(4) | 6.51(2) | 0.5(1) | 1.22(3) | 1.09(67) | 8.87/2.22 | |
| 60022-01-03-01 | 52067.58 | 1.03(5) | 2.52(3) | 0.04(1) | 12.65(3) | 1.20(4) | 2.36(5) | 6.55(8) | 0.35(4) | 1.28(3) | 1.30(67) | 8.22/1.82 | |
| 60022-01-03-01 | 52068.30 | 1.07(9) | 3.16(2) | -0.46(9) | 10.82(4) | 1.20(5) | 5.41(3) | 6.36(3) | 0.41(8) | 1.58(4) | 1.20(67) | 8.24/1.94 | |
| 60022-01-04-03 | 52102.363 | 1.03(9) | 3.25(9) | -0.57(8) | 9.44(7) | 1.31(7) | 5.47(4) | 7.07(3) | 0.50(9) | 1.64(5) | 1.07(67) | 7.44/1.60 | |
| 60022-01-04-00 | 52103.361 | 1.01(5) | 2.72(5) | -0.20(8) | 9.7(1) | 1.30(6) | 6.65(9) | 7.09(4) | 0.52(9) | 1.86(5) | 1.24(67) | 8.38/1.78 | |
| 60022-01-04-02 | 52103.685 | 1.0(1) | 2.87(6) | -0.1(1) | 10.68(9) | 1.20(7) | 4.01(9) | 7.03(3) | 0.50(5) | 1.63(3) | 1.04(67) | 7.78/1.72 | |
| 60022-01-01-07 | 52127.54 | 0.99(3) | 2.53(7) | 0.24(1) | 13.08(3) | 1.18(4) | 2.64(9) | 6.58(3) | 0.36(8) | 1.14(3) | 1.10(67) | 8.71/2.21 | |
| 60022-01-03-03 | 52128.667 | 0.99(5) | 2.78(5) | -0.26(5) | 10.23(1) | 1.20(8) | 6.8(1) | 6.34(5) | 0.4(1) | 1.57(3) | 1.04(67) | 8.24/1.94 | |
| 60022-01-04-04 | 52128.734 | 1.0(1) | 2.93(5) | -0.29(8) | 10.40(7) | 1.20(9) | 5.8(1) | 7.09(4) | 0.38(7) | 1.65(4) | 1.05(67) | 8.04/1.96 | |
| 60022-01-03-04 | 52129.386 | 1.02(6) | 2.72(6) | -0.17(7) | 9.9(1) | 1.20(4) | 5.97(9) | 6.42(3) | 0.37(8) | 1.83(3) | 1.01(67) | 8.38/1.86 | |
| 60022-01-04-01 | 52131.114 | 1.07(6) | 2.87(6) | -0.3(1) | 9.36(3) | 1.20(8) | 4.56(6) | 7.09(5) | 0.46(6) | 1.64(4) | 1.15(67) | 7.15/1.53 | |
| 60022-01-05-00 | 52131.507 | 1.0(1) | 2.62(5) | -0.09(1) | 8.5(1) | 1.30(6) | 5.8(1) | 5.99(7) | 0.47(4) | 1.69(3) | 1.16(67) | 7.49/1.60 | |
| 60022-01-05-01 | 52131.375 | 0.99(7) | 2.89(8) | -0.36(1) | 8.2(1) | 1.20(4) | 6.5(1) | 5.98(7) | 0.41(8) | 1.72(6) | 1.05(67) | 7.61/1.64 | |
| 60022-01-06-01 | 52166.493 | 1.0(1) | 2.75(3) | -0.17(2) | 11.19(5) | 1.20(9) | 5.53(5) | 5.87(7) | 0.43(9) | 1.61(3) | 0.96(67) | 8.73/2.13 | |
| 60022-01-06-03 | 52168.754 | 1.00(7) | 2.96(6) | -0.37(5) | 11.36(6) | 1.2(1) | 5.52(9) | 5.57(8) | 0.39(4) | 1.63(3) | 1.16(67) | 8.76/2.05 | |
| 60022-01-06-05 | 52169.610 | 1.01(4) | 2.65(4) | 0.08(7) | 11.04(7) | 1.20(5) | 5.26(8) | 6.17(3) | 0.418) | 1.65(6) | 1.06(67) | 8.34/2.31 | |
| 60022-01-06-06 | 52169.678 | 1.02(5) | 3.04(6) | -0.40(3) | 12.17(8) | 1.20(9) | 5.22(7) | 6.28(2) | 0.38(6) | 1.63(8) | 1.11(67) | 8.94/2.20 | |
| 60022-01-06-07 | 52170.534 | 1.03(5) | 2.6(1) | -0.04(3) | 7.20(4) | 1.20(5) | 5.33(3) | 6.47(7) | 0.50(8) | 1.68(7) | 1.12(67) | 6.58/1.38 | |
| 60022-01-06-00 | 52170.983 | 1.00(5) | 2.65(7) | -0.15(5) | 9.4(1) | 1.30(6) | 6.53(7) | 5.87(6) | 0.39(7) | 1.64(4) | 1.1(67) | 7.98/1.72 | |
| 60022-01-06-09 | 52171.194 | 1.06(7) | 2.86(5) | -0.23(4) | 11.1(1) | 1.20(7) | 5.70(5) | 6.47(8) | 0.37(9) | 1.74(5) | 1.06(67) | 8.75/2.13 | |
| 60022-01-06-08 | 52172.176 | 1.04(4) | 2.99(8) | -0.43(6) | 10.40(5) | 1.20(9) | 5.39(6) | 6.57(6) | 0.4(1) | 1.71(4) | 1.1(67) | 8.22/1.82 | |
| 60022-01-06-10 | 52172.241 | 1.0(1) | 2.66(4) | -0.25(5) | 10.03(4) | 1.20(5) | 6.26(8) | 6.43(7) | 0.40(8) | 1.68(3) | 0.95(67) | 8.44/2.02 | |
| 60022-01-06-11 | 52172.725 | 0.99(6) | 2.62(9) | -0.49(7) | 9.34(5) | 1.30(6) | 6.34(5) | 6.40(3) | 0.38(7) | 1.74(2) | 1.08(67) | 8.30/1.83 | |
| 60022-01-06-12 | 52172.792 | 1.00(3) | 3.41(9) | -0.54(4) | 12.08(7) | 1.20(8) | 5.24(9) | 6.81(5) | 0.35(8) | 1.81(5) | 1.01(67) | 8.84/2.15 | |
| 60022-01-06-13 | 52172.852 | 1.03(5) | 2.83(3) | -0.20(3) | 11.63(6) | 1.20(5) | 6.09(9) | 6.17(7) | 0.32(5) | 1.77(7) | 1.05(67) | 8.88/2.24 | |
| 60022-01-07-00 | 52201.445 | 1.04(4) | 2.75(5) | -0.13(3) | 10.13(3) | 1.20(6) | 5.50(8) | 6.24(8) | 0.35(8) | 1.69(3) | 1.07(67) | 8.06/1.98 | |
| 60022-01-07-02 | 52204.424 | 1.06(9) | 2.75(5) | -0.23(6) | 9.11(4) | 1.20(5) | 5.42(9) | 6.36(6) | 0.3(1) | 1.65(4) | 0.89(67) | 7.57/1.67 | |
| 60022-01-07-03 | 52207.202 | 1.03(5) | 2.76(3) | -0.02(1) | 11.05(5) | 1.20(7) | 5.07(9) | 5.85(7) | 0.35(8) | 1.62(3) | 1.15(67) | 8.31/2.32 | |
| 60022-01-07-04 | 52207.071 | 1.01(4) | 2.69(3) | -0.01(1) | 10.37(3) | 1.20(3) | 5.56(8) | 6.52(5) | 0.4(1) | 1.76(5) | 1.12(67) | 8.26/2.06 | |
| 60022-01-08-00 | 52230.164 | 1.0(5) | 2.58(4) | -0.01(1) | 7.64(1) | 1.3(1) | 5.67(7) | 5.87(7) | 0.50(9) | 1.64(3) | 1.15(67) | 6.84/1.49 | |
| 60022-01-09-00 | 52295.306 | 1.0(4) | 2.51(4) | 0.23(1) | 12.25(4) | 1.2(1) | 3.53(8) | 5.97(8) | 0.46(8) | 1.67(6) | 1.14(67) | 8.55/2.04 | |
| 60022-01-10-00 | 52321.559 | 1.0(5) | 2.50(4) | 0.11(1) | 13.26(4) | 1.20(9) | 2.71(8) | 5.85(9) | 0.41(6) | 1.71(8) | 1.2(67) | 8.72/1.97 | |
| 60022-01-10-01 | 52320.301 | 1.0(6) | 2.51(2) | 0.09(1) | 13.77(1) | 1.20(6) | 2.61(8) | 5.78(7) | 0.46(7) | 1.61(4) | 1.1(67) | 9.08/2.18 | |
| 60022-01-10-02 | 52320.876 | 1.0(3) | 2.52(1) | 0.06(1) | 12.19(4) | 1.20(5) | 2.60(8) | 5.87(6) | 0.4(1) | 1.65(4) | 1.04(67) | 8.01/1.76 | |
| 60022-01-10-03 | 52324.647 | 0.99(2) | 2.44(2) | 0.14(5) | 11.36(4) | 1.10(8) | 1.57(6) | 6.26(6) | 0.47(9) | 1.87(3) | 1.11(67) | 6.39/1.37 | |
| 60022-01-10-04 | 52325.760 | 0.99(2) | 2.44(3) | 0.15(6) | 11.91(5) | 1.10(9) | 2.23(6) | 6.47(7) | 0.51(6) | 1.79(6) | 1.09(67) | 6.39/1.37 | |
| 60022-01-08-00 | 52230.164 | 1.00(5) | 2.58(4) | -0.02(1) | 7.64(2) | 1.2(1) | 5.67(7) | 6.75(6) | 0.53(8) | 1.86(4) | 0.88(67) | 6.84/1.49 | |
| 60022-01-11-00 | 52356.747 | 0.99(3) | 2.50(2) | 0.08(7) | 9.94(6) | 1.10(8) | 1.29(6) | 6.55(4) | 0.49(6) | 1.86(7) | 1.2(67) | 6.39/1.37 | |
| 60022-01-11-01 | 52356.814 | 0.99(1) | 2.47(1) | 0.12(4) | 11.79(3) | 1.10(5) | 1.58(6) | 6.46(3) | 0.5(1) | 1.85(7) | 1.15(67) | 7.54/1.64 | |
| 60022-01-11-03 | 52357.083 | 0.99(2) | 2.41(1) | 0.6(1) | 13.29(4) | 1.10(8) | 2.8(1) | 6.57(7) | 0.50(9) | 1.87(4) | 1.1(67) | 8.56/1.94 | |
| 60022-01-11-02 | 52394.572 | 1.0(1) | 2.51(2) | 0.41(4) | 12.56(4) | 1.10(4) | 6.2(1) | 6.38(5) | 0.39(7) | 1.94(3) | 1.19(67) | 9.92/2.36 | |
| 60022-01-12-00 | 52394.891 | 1.0(1) | 2.73(4) | 0.08(7) | 13.26(7) | 1.10(7) | 5.76(8) | 6.49(9) | 0.37(8) | 1.85(6) | 1.01(67) | 9.92/2.36 | |
| 60022-01-13-00 | 52554.152 | 1.0(1) | 2.46(2) | 0.6(1) | 12.5(9) | 1.1(1) | 9.48(4) | 6.35(5) | 0.35(4) | 1.91(4) | 1.07(67) | 9.92/2.36 | |
| 60022-01-13-01 | 52554.484 | 1.00(5) | 2.56(5) | 0.03(1) | 13.6(7) | 1.20(5) | 2.85(7) | 6.48(7) | 0.36(9) | 1.86(3) | 1.16(67) | 8.87/1.99 | |
| 90022-05-01-00 | 53108.101 | 1.04(8) | 2.42(9) | -0.18(6) | 4.22(3) | 1.5(1) | 4.07(3) | 6.38(6) | 0.53(2) | 0.87(5) | 1.36(67) | 3.85/0.79 | |
| 90022-05-01-01 | 53108.256 | 1.00(8) | 3.1(1) | -0.46(7) | 4.75(7) | 1.59(9) | 3.68(5) | 6.34(5) | 0.60(8) | 1.03(7) | 1.38(67) | 3.99/0.84 | |
| 90022-05-02-00 | 53238.243 | 1.01(8) | 2.56(4) | 0.10(6) | 4.20(7) | 1.19(7) | 2.58(9) | 6.39(9) | 0.62(3) | 0.77(9) | 1.34(67) | 3.07/0.64 | |
| 90022-05-03-00 | 53245.990 | 1.06(9) | 2.36(2) | 0.30(6) | 5.42(5) | 1.19(8) | 1.5(1) | 6.5(1) | 0.6(1) | 0.79(8) | 1.00(67) | 3.76/0.75 | |
| 90022-05-04-00 | 53252.490 | 1.00(4) | 2.5(1) | 0.10(7) | 6.05(9) | 1.19(6) | 1.51(8) | 6.6(1) | 0.65(8) | 0.86(9) | 1.00(67) | 3.11/0.83 | |
| 90022-05-04-01 | 53253.859 | 1.0(1) | 2.47(2) | 0.06(2) | 6.08(3) | 1.50(6) | 2.49(5) | 6.50(9) | 0.66(6) | 0.83(5) | 1.25(67) | 4.23/0.85 | |
| 90022-05-05-00 | 53263.468 | 1.01(4) | 2.52(1) | 0.04(1) | 5.33(2) | 1.50(8) | 2.24(2) | 6.49(7) | 0.67(8) | 0.97(7) | 1.15(67) | 4.23/0.85 | |
| 90022-05-06-00 | 53265.412 | 1.09(6) | 2.52(2) | 0.01(1) | 5.42(3) | 1.45(7) | 2.46(3) | 6.6(1) | 0.63(6) | 0.87(5) | 1.15(67) | 3.78/0.75 | |
| 90022-05-06-01 | 53265.541 | 1.0(1) | 2.50(1) | 0.01(1) | 5.56(5) | 1.39(5) | 2.08(4) | 6.62(9) | 0.62(4) | 0.79(7) | 1.05(67) | 3.79/0.77 | |
| 90022-05-06-02 | 53265.675 | 1.01(2) | 2.51(2) | 0.04(2) | 5.54(6) | 1.41(4) | 2.34(6) | 6.67(5) | 0.61(8) | 0.79(5) | 1.07(67) | 3.82/0.78 | |
| 90022-05-06-03 | 53265.806 | 1.02(5) | 2.56(2) | -0.02(1) | 4.98(3) | 1.6(1) | 2.22(5) | 6.6(1) | 0.62(9) | 0.81(9) | 1.08(67) | 3.44/0.69 | |
| 90022-05-07-00 | 53279.124 | 1.00(7) | 2.53(1) | 0.10(6) | 3.53(1) | 1.70(8) | 2.45(3) | 6.64(7) | 0.64(5) | 0.85(6) | 1.18(67) | 3.44/0.69 | |
| 90022-05-07-00 | 53280.960 | 1.03(9) | 2.42(1) | 0.31(3) | 5.42(3) | 1.50(9) | 2.18(3) | 6.65(8) | 0.62(8) | 0.79(7) | 0.97(67) | 3.44/0.69 | |
| 94307-05-01-00 | 55129.659 | 1.02(3) | 3.16(4) | 0.41(3) | 4.53(7) | 1.4(1) | 3.08(2) | 6.58(2) | 0.4(1) | 0.32(1) | 1.09(67) | 3.21/1.28 | |
| 94307-05-01-000 | 55440.307 | 1.04(4) | 3.16(5) | 0.45(4) | 4.53(7) | 1.50(8) | 3.08(3) | 6.59(5) | 0.40(7) | 0.34(2) | 0.87(67) | 3.21/1.28 | |
| 94307-05-01-00 | 55440.62 | 1.03(8) | 2.50(2) | 0.25(2) | 4.67(2) | 1.4(1) | 4.17(4) | 6.64(9) | 0.62(9) | 0.68(9) | 1.13(67) | 3.78/0.78 | |
| 94307-05-01-01 | 55440.701 | 1.03(9) | 3.16(4) | 0.41(3) | 4.53(7) | 1.40(6) | 3.08(2) | 6.58(3) | 0.4(1) | 0.32(6) | 0.89(67) | 3.21/1.28 | |
| 94307-05-01-02 | 55440.766 | 1.02(3) | 3.26(7) | -0.56(3) | 4.57(1) | 1.35(7) | 4.13(2) | 6.21(2) | 0.5(1) | 0.21(7) | 0.98(67) | 3.21/1.28 |
† The spectral model is , where is fixed at a value 1.6 cm-2 (Oosterbroek et al., 2000); color temperature is fixed at 0.6 keV (see comments in the text); †† normalization parameters of and components are in units of , where is the source luminosity in units of 1037 erg/s, is the distance to the source in units of 10 kpc and component is in units of in line , †††spectral fluxes (F1/F2) in units of ergs/s/cm2 for (3 – 10) and (10 – 50) keV energy ranges respectively.
| Source | Alternative | Class2 | Distance, | Presence of | , | ||||
|---|---|---|---|---|---|---|---|---|---|
| name | name | kpc | kHz QPO | keV | keV | keV | |||
| 4U 1744-26 | GX 3+1 | Atoll, Sp, B | 4.53 | none5 | 2.3-4.5 | 0.04-0.15 | 0.6 | 1.16-1.7 | 0.2-0.9 |
| 4U 1728-34 | GX 354-0 | Atoll, Su, D | 4.2-6.44 | +6 | 2.5-15 | 0.02-0.09 | 0.6-0.7 | 1.3 | 0.5-1 |