Magnetodielectric effect and phonon properties of compressively strained EuTiO3 thin films deposited on LSAT
Abstract
Compressively strained epitaxial (001) EuTiO3 thin films of tetragonal symmetry have been deposited on (001) (LaAlO3)0.29-(SrAl1/2Ta1/2O3)0.71 (LSAT) substrates by reactive molecular-beam epitaxy. Enhancement of the Néel temperature by 1 K with 0.9% compressive strain was revealed. The polar phonons of the films have been investigated as a function of temperature and magnetic field by means of infrared reflectance spectroscopy. All three in-plane polarized infrared active phonons show strongly stiffened frequencies compared to bulk EuTiO3 in accordance with first principles calculations. The phonon frequencies exhibit gradual softening on cooling leading to an increase in static permittivity. A new polar phonon with frequency near the TO1 soft mode was detected below 150 K. The new mode coupled with the TO1 mode was assigned as the optical phonon from the Brillouin zone edge, which is activated in infrared spectra due to an antiferrodistortive phase transition and due to simultaneous presence of polar and/or magnetic nanoclusters. In the antiferromagnetic phase we have observed a remarkable softening of the lowest-frequency polar phonon under an applied magnetic field, which qualitatively agrees with first principles calculations. This demonstrates the strong spin-phonon coupling in EuTiO3, which is responsible for the pronounced dependence of its static permittivity on magnetic field in the antiferromagnetic phase.
pacs:
75.80.+q; 78.30.-j; 63.20.-eI Introduction
Multiferroic compounds in which magnetic and electric orders coexist are intensively studied due to their high potential in magnetoelectric devices as well as due to their rich and fascinating physics related to the magnetoelectric effect. Unfortunately, it appears that there are only few multiferroics in the nature and their absolute majority exhibits multiferroic properties deeply below room temperature.wang09 Moreover, most multiferroics exhibit antiferromagnetic (AFM) order and therefore only weak magnetoelectric coupling.wang09 For this reason, there is an intensive search for new materials with ferromagnetic and ferroelectric order, where the magnetoelectric coupling could be high.
Fennie and Rabefennie06 suggested a new route for preparation of multiferroics with a strong magnetoelectric coupling. They proposed to use a biaxial strain in the thin films for induction of the ferroelectric and ferromagnetic state in materials which are in the bulk form paraelectric and AFM. Basic condition for such a material is the strong spin-phonon coupling. Fennie and Rabefennie06 proposed, based on their first principles calculations, to use EuTiO3 for such purpose. Recently, Lee et al.lee10 actually confirmed the theoretical prediction and revealed ferroelectric and ferromagnetic order in the tensile strained EuTiO3 thin films deposited on DyScO3 substrates.
Bulk EuTiO3 is an antiferromagnet with G-type AFM order below = 5.3 K.guire66 Temperature dependence of its permittivity ’ exhibits quantum paraelectric behavior, i.e. ’ increases on cooling and saturates at low temperatures due to quantum fluctuations, which inhibit the creation of long-range ferroelectric order. Recently, it was theoretically predicted that EuTiO3 has antiferrodistorted ground state.rushchanskii10 ; rushchanskii11 Experimental studies show that at room temperature the crystal structure is cubic perovskite,brous53 which transforms to tetragonal structure near 280 K.bussmann-holder11 ; allieta11 ; goian12a ’(T) exhibits a sharp drop below due to a strong spin-phonon coupling.katsufuji01 A large interaction of the magnetic moment with the crystal lattice was also manifested by 7% increase of ’ with magnetic field, observed at 2 K.katsufuji01 Linear magnetoelectric coupling is forbidden by the symmetry of EuTiO3. In spite of this, a strong bi-quadratic magnetoelectric coupling was recently reported below .shvartsman10
Low-temperature infrared (IR) reflectivity studies of EuTiO3 ceramics reveal three polar phonons typical for cubic perovskites.kamba07 ; goian09 The frequency of the lowest frequency (TO1) phonon decreases (the mode softens) on cooling, which fully explains the increase of static permittivity on lowering temperature via the Lyddane-Sachs-Teller (LST) relation. Below 100 K the soft TO1 mode frequency deviates from the classical Cochran law and finally levels off below 30 K.kamba07 Such temperature dependence follows the Barrett formula, which describes the saturation of ’(T) at low temperatures due to quantum fluctuations. Based on the plasma frequencies of the polar phonons, the TO1 mode was assigned to Slater mode, i.e. Ti cations vibration against the oxygen octahedra, and the TO2 phonon (near 150) was assigned to Last mode, i.e. vibration of Eu cations against the TiO6 octahedra.goian09 Temperature dependence of the IR spectra indicated coupling (mixing of their eigenvectors) of both the modes.goian09 Moreover, a strong spin coupling with the soft mode (SM)is expected microscopically due to a superexchange between Eu2+ 4 spins via the 3 states of the Ti4+ ions.akamatsu11
Here we report a study of the epitaxial compressively strained EuTiO3 thin films deposited on (001) (LaAlO3)0.29-(SrAl1/2Ta1/2O3)0.71 (LSAT) substrate. Lee et al.lee10 have shown that the maximum expected compressive strain of -0.9% in this case is not sufficient for induction of the ferroelectric and ferromagnetic order. Nevertheless, we will show here that the phonon properties of EuTiO3/LSAT are strongly influenced: The in-plane soft mode frequency is remarkably stiffened in comparison to the bulk EuTiO3 ceramics and moreover its IR reflection band is more than five times narrower. It enabled us a detailed investigation of the magnetic field dependence of this phonon. We will show that shift of the lowest-frequency optical phonon with magnetic field is mainly responsible for observed magnetodielectric effect in EuTiO3. Moreover, we will report about an antiferrodistortive (AFD) phase transition appearing in this film near 150 K.
II Experimental
Films of two thicknesses (22 and 42 nm) were deposited by reactive molecular-beam epitaxy on the (001) LSAT substrate. Details of the deposition were described elsewhere.lee09 The 42 nm film was slightly relaxed, but the 22 nm film was fully (-0.9%) compressively strained, its XRD showing the same in-plane lattice parameter (3.870 Å) as the substrate. The substrates of 10x10x1 mm size were provided by R. Uecker and his colleagues from the Institute of Crystal Growth, Berlin, Germany.
The unpolarized IR reflectance spectra were taken using a Bruker IFS 113v FTIR spectrometer at temperatures from 1.8 to 300 K with the resolution of 2. We checked also the polarized spectra at 300 and 10 K, but no in-plane anisotropy was observed, confirming that the substrate plate as well as the thin films are macroscopically optically isotropic in the (001) plane down to 10 K. An Optistat CF cryostat (Oxford Instruments) was used for cooling the samples without magnetic field down to 5 K. The investigated spectral range (up to 650) was limited by the transparency region of the polyethylene windows of the cryostat. A helium-cooled Si bolometer operating at 1.6 K was used as a detector. Custom-made superconducting magnetic cryostat was used for IR studies at various magnetic fields up to 13 T at temperatures between 1.8 and 4.2 K.
Each of the reflectance spectra was evaluated as a two-layer optical system.zelezny98 At first, the bare substrate reflectivity was measured as a function of temperature and carefully fitted using the generalized factorized damped harmonic oscillator modelgervais83
| (1) |
where and denote the transverse and longitudinal frequency of the j-th polar phonon, respectively, and TOj and LOj denote their corresponding damping constants. ∗() is related to the reflectivity R() of the bulk substrate by
| (2) |
The high-frequency permittivity = 5.88 resulting from the electronic absorption processes was obtained from the room-temperature frequency-independent reflectivity tails above the phonon frequencies and was assumed to be temperature independent.
When analyzing the reflectance of the substrate together with the film, we kept the earlier fitted bare substrate parameters fixed at each temperature and only the dielectric function of the film was adjusted. For this purpose, we preferentially used a classical three-parameter damped oscillator modelgervais83
| (3) |
since it uses less fitting parameters. This approach is well justified, because the damping of LO phonons of the film do not influence appreciably the reflectance spectra. Only the lineshape of the lowest frequency doublet was not well reproduced and therefore a coupled damped harmonic model was applied at low temperatures (see below.)
The IR reflectance measurements were performed on samples with a 1 mm thick substrates which was thick enough to avoid the parasitic IR signal from the multiple reflection in the substrate. The same samples were afterwards polished to 248m to reach the optimal MW resonance near 15 GHz where the samples were measured as the composite TE01δ dielectric resonators in the shielding cavitybovtun11 using their dielectric resonance. Precisely the same thicknesses of bare substrates and substrates with the films are needed for an accurate evaluation of the in-plane complex permittivity of the films. Each sample was measured twice, in the Sigma System M18 temperature chamber (100-370 K) and in the He-cooled Janis close-cycle cryostat (10-370 K).
High resolution X-ray diffraction (XRD) measurements were performed on a two-axis diffractometer in a Bragg-Brentano geometry (focalization circle with a diameter of 50 cm). Cu-K (wavelength =1.54056) radiation was emitted from a 18 kW rotating anode generator. The out of plane lattice constant of the film as well as the substrate were determined with accuracy of 0.0003 . Cryostat was operating between 10 K and 300 K with an accuracy better than 0.5 K.
Magnetic properties were measured using a SQUID magnetometer (Quantum Design) from 2 to 30 K. Sample with the 42 nm thin film was cut to four pieces of 3.5x4.5x0.248 mm3 size and all four stacked samples were measured simultaneously.
III Theoretical considerations
In parallel with the experimental studies, we also investigated the EuTiO3 films using a first-principles density-functional calculations within the spin-polarized gradient approximation (GGA). In particular, we have studied the effect of the strain and magnetic field on phonon frequencies in the bulk and thin films. Our initial guess for the low temperature structure of EuTiO3 is analogous to that of the bulk SrTiO3 ( space group). In the course of this work, this structure was confirmed experimentallygoian12a for the bulk EuTiO3 and according to our calculations, it is also a plausible structure for the thin films under the compressive strains.
For the electronic structure calculations and structural relaxations we used projector augmented-wave potentials as implemented in the Vienna Ab initio Simulation Package (VASP). To account for the strong electron correlation effects on the -shell of Eu atoms, we used the DFT+U scheme in the Dudarev’s approach with an on-site Hubbard U and Hund’s exchange JH. For the bulk EuTiO3 of space group , U=5.7 eV is used. In order to correct for the effect of oxygen octahedron rotations on the magnetism, the Hubbard parameter is increased to U=6.2 eV for EuTiO3 in the space group .birolETO Hund’s exchange is kept fixed at JH=1.0 eV for all calculations. Details of the calculations can be found in Refs. rushchanskii10 ; rushchanskii11 .
For the sake of comparison with the experiment, we have calculated frequencies of the polar phonon modes in the bulk cubic and tetragonal EuTiO3 as well as in tetragonal lattices with equatorial lattice parameters fixed to those of the SrTiO3 and LSAT substrates. In order to estimate the frequency changes under strong bias magnetic field, the calculations were carried out both for the AFM order (anticipated ground state) and for ferromagnetic (FM) order (i.e. for the expected induced magnetic order under magnetic field). Resulting mode frequencies are listed in Table 1.
| Bulk EuTiO3 | Bulk EuTiO3 | EuTiO3/SrTiO3 | EuTiO3/LSAT | EuTiO3/LSAT | |||||||||||
|---|---|---|---|---|---|---|---|---|---|---|---|---|---|---|---|
| Experiment at 1.9 K | |||||||||||||||
| FM | AFM | FM | AFM | FM | AFM | FM | AFM | FM | AFM | FM | AFM | FM | AFM | FM | AFM |
| 70 | 77 | 125 | 133 | 107 | 113 | 132 | 138 | 77 | 86 | 113 | 124 | 121 | 125 | 104.0, ? | 105.5, 115 |
| 162 | 165 | 158 | 159 | 156 | 158 | 159 | 161 | 147 | 148 | 160 | 161 | 164 | 166 | ? | 162 |
| 251 | 251 | 246 | 246 | 255 | 255 | ||||||||||
| 422 | 422 | 414 | 414 | 428 | 428 | ||||||||||
| 549 | 550 | 533 | 534 | 526 | 527 | 536 | 537 | 519 | 519 | 531 | 532 | 532 | 532 | ? | 551 |
IV Results
IV.1 Magnetic properties
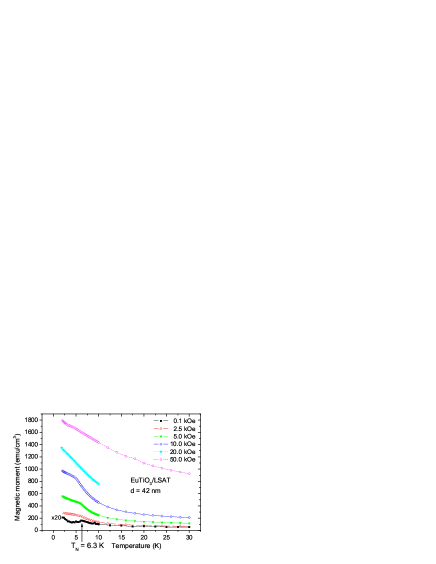
Magnetization curves taken at various external magnetic fields (see Fig. 1) reveal TN=6.3 K. It means that the -0.9% compressive strain in the film enhances TN by 1.0 K because the coupling of spins localized at the 4f levels of Eu cations increases with the reducing lattice parameter in the compressively strained films. Note that the +1.1% tensile strain in EuTiO3/DyScO3 induces the ferromagnetic order below 4.2 K.lee10 On the other hand, it was reported that the as-deposited thin EuTiO2.86 films on SrTiO3 (this substrate has exactly the same lattice constant 3.905 Å as the bulk EuTiO3) exhibit an elongated c-axis and a ferromagnetic order below 5 K,Kugimiya07 ; Fujita09 while the same films post annealed at 1000 C in reducing atmosphere exhibit AFM order and relaxed out-of-plane lattice strain.Fujita09
IV.2 Temperature dependence of the phonon spectra
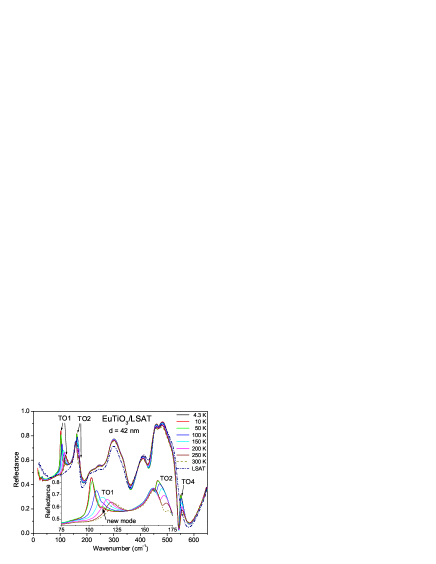
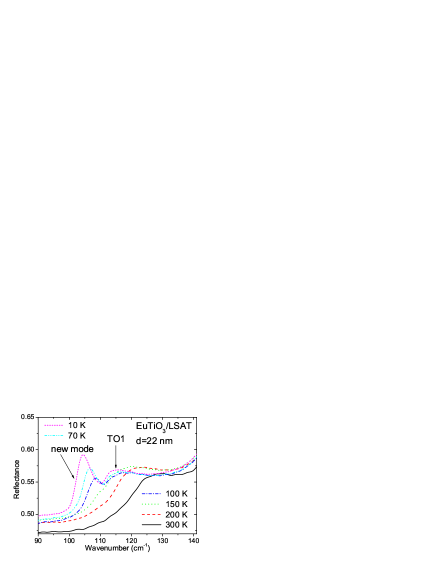
IR reflectance of the EuTiO3 42 nm film plotted at various temperatures is shown in Fig. 2. Comparison of the spectra with those of bare LSAT substrate allows us to distinguish the three TO phonons of the film (marked by the arrows). The highest frequency phonon is marked TO4 (the TO3 phonon is silent). The two lowest-frequency TO phonons show up softening on cooling, which is better seen in the inset of Fig. 2. The three modes correspond well the three polar modes of the cubic EuTiO3, as shown in the Table I. Moreover, a new weak mode appears near 112 below 100 K. Since the 42 nm film was not fully strained, we have measured also the IR reflectance spectra from a fully (and uniformly) strained 22 nm film. Due to the smaller film thickness, the intensity of the TO1 reflection band is lower (see Fig. 3), but one can clearly see the mode splitting already below 150 K. Note that in this case the new mode is activated below the TO1 phonon frequency, while in the thicker film the new mode has higher frequency than the TO1 mode. Origin of the new mode will be discussed in section V.
Shape of the IR reflectance bands in Fig. 3 is rather unusual and the splitting of the TO1 mode cannot be fitted well just with a sum of independent oscillators (Eq. 3). Therefore, the coupled oscillator formula was used for the fit of the split modes (their bare parameters are marked with subscripts and ) and the rest of modes were fitted with Eq. 3. The coupled oscillator formula has the form petzelt87
| (4) |
using the imaginary coupling constant model. The rest of symbols have the same meaning as in Eq. 3.
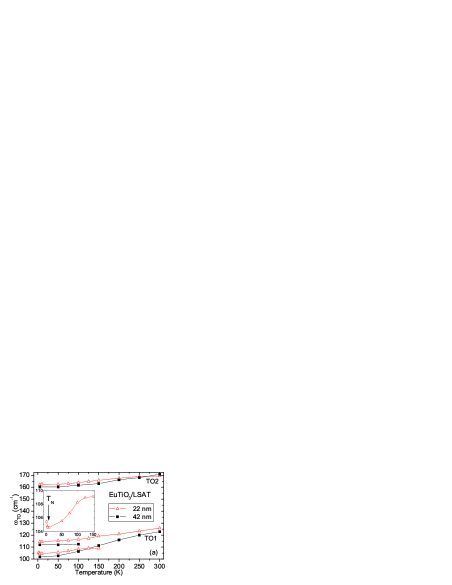
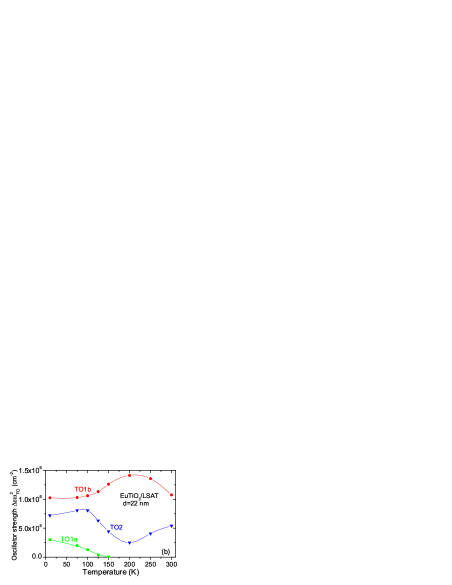
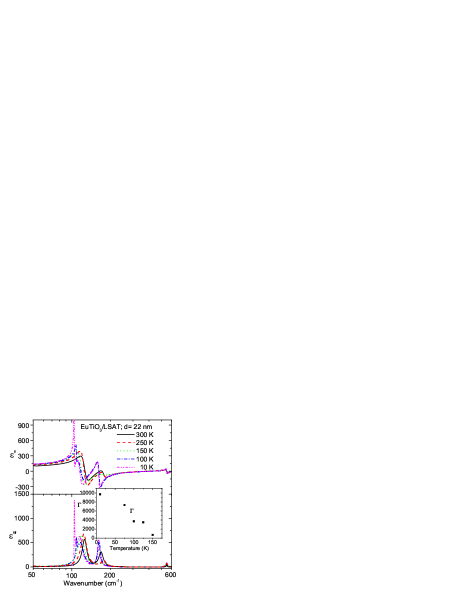
Fig. 4a shows the temperature evolution of the polar phonon frequencies below 170 obtained from the reflectance fits of both films. At 10 K the TO phonon frequencies are 83, 151 and 533 for the bulk ceramics,goian09 while our 22 nm film shows phonons at 115, 162, 551 and the additional new mode at 105 . There is a strong phonon frequency stiffening in the films due to the compressive strain. Note also that the phonon frequencies are higher in the 22 nm film than in the 42 nm one (see Fig. 4a), obviously due to the higher strain in the former case.
Complex permittivity spectra evaluated from the IR reflectance are shown in Fig. 5. Stiffening of all in-plane polar phonons is responsible for a lower in-plane permittivity ’ in the films compared with the bulk sample. At 10 K the static permittivity reaches the value of 146 compared to 405 in the single crystal.katsufuji01 Here it should be stressed that compressive strain reduces the in-plane permittivity, but the out-of-plane permittivity should be enhanced, because the TO1 phonon component polarized perpendicularly to the film plane should be softer. Unfortunately, we cannot see this phonon in our near-normal reflectivity geometry.
In our fit we used =0, i.e. we suppose that the bare lowest-frequency mode has zero dielectric strength. The imaginary coupling does not shift the phonon frequencies, it merely deforms the spectral line shape and transfers the oscillator strength from TO1b to the new TO1a mode (see Fig. 4b). Dramatic increase of the coupling constant is seen on cooling below 150 K in inset of Fig. 5. This causes the increase of its strength on cooling. Also the temperature dependences of the TO1b and TO2 mode oscillator strengths are remarkable. They give evidence on mixing of eigenvectors of both the modes.
IV.3 Microwave dielectric measurements
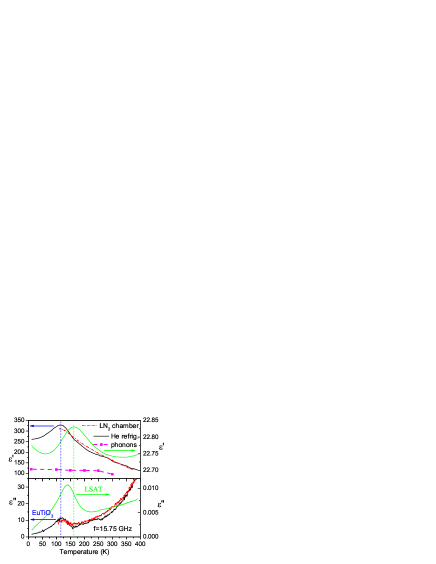
The non-monotonous dependence of the oscillator strengths of TO1b and TO2 modes (see Fig. 4b) could be related to an AFD phase transition involving anti-phase tilts of the oxygen octahedra ( in Glazer notation). This phase transition occurs in the bulk EuTiO3 near room temperaturebussmann-holder11 ; goian12a , but in the strained films it can be expected at lower temperatures (e.g. near 180 K in the 1% tensile strained EuTiO3/DyScO3)lee10 . Also the TO1a -TO1b coupling could be related to this transition, if the distorted phase would be ferroelectric. Therefore, we have investigated the temperature dependence of the in-plane MW permittivity of the film and of the substrate itself. Complex permittivity of the film measured near 15 GHz shows a dielectric anomaly near 120 K (see Fig. 6) reminding a ferroelectric phase transition. Nevertheless, the second harmonic generation (SHG) measurements of the EuTiO3/LSAT film did not reveal any acentric phase down to 2 K.lee10 Moreover, from theory we know that the spontaneous polarization (and the main dielectric anomaly) should occur in the [001] direction in the compressively strained films,fennie06 ; schlom07 , whereas we measure only the in-plane dielectric response. It is suspicious that the low temperature MW ’ is higher than the sum of phonon contributions to ’ (see Fig. 6) and that the maximum of ’ occurs 30 K below the temperature where the new mode activates in the IR spectra. Since we do not see any phonon anomaly in the IR spectra explaining the dielectric anomaly near 120 K, it seems that the MW dielectric anomaly has its origin in some dielectric dispersion below the phonon frequencies, most probably due to diffusion of charged defects (e.g. oxygen vacancies). Such defects play the main role in the conductivity of the films, which deteriorates the dielectric studies of EuTiO3/LSAT in the kHz region.
IV.4 Magnetodielectric effect and tuning of the phonon frequency by magnetic field
Bulk EuTiO3 has a high static 400 and low SM frequency. Therefore it shows a high (7%) tunability of ’ by the magnetic field B,katsufuji01 and an unusually high 7 change of the SM TO1 frequency with B is expected theoretically.fennie06 Such a shift was not confirmed in our IR spectra of the bulk ceramics, presumable because the TO1 reflection band is too broad (almost 100 ). kamba07 However, the sharper TO1 reflectance band in compressively strained EuTiO3 films (see Figs. 2 and 3) appears to be more promising for such observation, although the expected frequency shift (see Table 1) is somewhat lower ( 4).
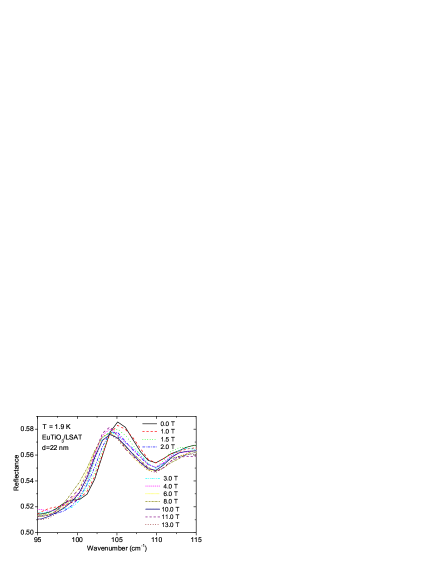
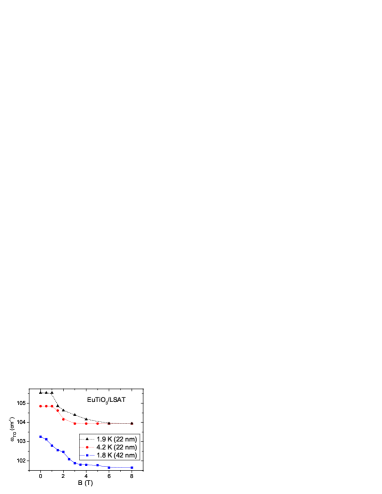
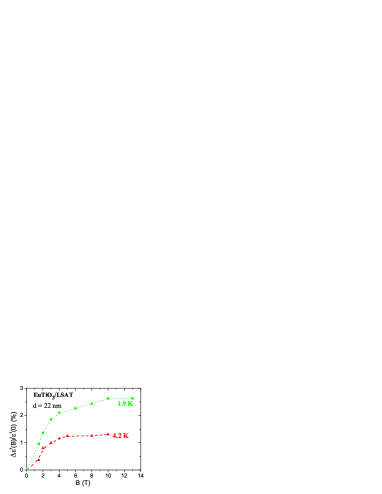
Actually, we have observed an almost 2 decrease of the lowest-frequency phonon with B up to 10 Tesla (see Figs. 7 and 8). The phonon frequency shifts could be determined with a high accuracy of 0.1 thanks to the sharp feature of the reflectance band. The absolute changes of the phonon frequencies on B were similar and reproducible in both films, even though the origin of the sharp phonon seen in Figs. 2 and 3 appears to be different. It corresponds predominantly to TO1 and an optical phonon from the Brillouin zone edge (see the discussion in the next section) in the 42 and 22 nm film, respectively. The higher frequency component of the TO1 reflectance band is weaker and broader, therefore it is not possible to evaluate its change with B. Magnetodielectric effect, i.e. the relative change of the static permittivity with magnetic field B () obtained from the fits of reflectance spectra is plotted in Fig. 9. As expected, one can see that the change of in the thin film is almost three times smaller than that in the single crystal,katsufuji01 because the phonons are stiffened in the films. The change of appears to be larger at 1.9 K than at 4.2 K (Fig. 9). It is caused by the larger phonon frequency shift with B at 1.9 K (see Fig. 8), since also the shift of the phonon frequency on cooling below TN is larger at 1.9 K than at 4.2 K (see inset of Fig. 4). It corresponds also to larger relative change of the permittivity at 2 K than at 4.2 K reported in single crystalkatsufuji01 and ceramics.kamba07 Here it should be noted that the magnetic field influence on the SM component polarized perpendicular to the film plane (unattainable in our experiment) should be higher than the influence on the phonons polarized in the film plane. This is shown also in Table I.
Phonon frequencies obtained from the first principles calculation in the AFM (i.e. without applied B) and in the ferromagnetic phase (i.e. in a high B) are summarized in Table 1. One can see that mainly the lowest frequency phonons shift down with the magnetic field. Theoretical frequency shift is twice larger in Table 1 than in our experiment (Fig. 8), because the calculations were performed at conditions of 0 K, while the experiment was done at 2 K and the shift should increase on cooling below TN. In this way we confirmed that the magnetodielectric effect in EuTiO3 is due to the change of the polar phonon frequency with magnetic field.
It is well known from the literature that it is rather easy to change the phonon frequencies by hydrostatic pressure or external electric field. This effect is most remarkable in ferroelectrics, in which the ferroelectric SM is highly sensitive to boundary conditions. Electric field dependence of the ferroelectric SM was first-time observed in Raman scattering of SrTiO3,schaufele67 ; worlock67 and the hydrostatic pressure dependences of the SM were reviewed by Samara and Peercy.samara81
On the other hand, direct observations of phonon frequency changes on application of external magnetic field B are very scarce in literature and most of magnetic materials do not exhibit measurable effects. Ruf et al.ruf88 observed 1.5 change of one phonon line with B in the Raman scattering spectra of YBa2Cu3O7. This phonon frequency was sensitive to the superconductive phase transition and its changes were observed slightly below Tc under the field of 6-12 T. Sushkov et al.sushkov02 reported on small B-dependent line-shape changes in the IR absorption spectra of molecular magnet Mn12-acetate, but a very high magnetic field of 30 T was necessary to get a measurable effect. Multiferroics exhibit relatively high tunability of ’ so that also larger changes of phonon frequencies with B could be expected. This was confirmed in GdMnO3 and DyMn2O5 multiferroics.pimenov06 ; cao08 In the former case, a phonon frequency change by less than 1 was observed due to a phonon coupling with magnonpimenov06 while in the latter case a high field of 18 T was necessary to see a 2 change of phonon frequency.cao08 In our EuTiO3 film the phonon frequency change due to B is comparable to the previous case, but a much lower magnetic field was needed.
It should be stressed that the magnetodielectric effect in EuTiO3 is not caused by a linear magnetoelectric coupling, since bilinear terms (where and are components of the magnetic and electric field, respectively) are not allowed in the thermodynamic potential.shvartsman10 Nevertheless, higher order magnetoelectric effects, accounted for by the and terms in the thermodynamic potential, are permitted. The strong quadratic and bi-quadratic magnetoelectric effects were actually experimentally confirmed in bulk EuTiO3 by Shvartsman et al.shvartsman10
Dzyaloshinskii recently proposed a splitting of polar phonons in ferroelectrics due to an external magnetic field.dzyaloshinskii09 We do not see any splitting of phonons in the magnetic field, but we observe a 50% increase of the SM damping with magnetic field (see the broadening of reflection band with magnetic field in Fig. 7). At 1.9 K its damping is 4.2 at B=0 T, while at B=13 T it is 6. Broadening of the phonon linewidth could be a consequence of a small phonon splitting, which is not resolved.
V Discussion
Let us now try to explain the origin of activation of the new mode near the TO1 phonon frequency in the IR spectra of EuTiO3/LSAT (see Fig. 4). We consider two possibilities: 1) the doubly degenerate component of the TO1 phonon probed in our experiment splits due to anisotropic in-plane strain, which is created due to a phase transition in the LSAT substrate. 2) the new mode originates from the Brillouin zone (BZ) edge due to an AFD phase transition (with multiplication of the primitive unit cell and BZ folding).
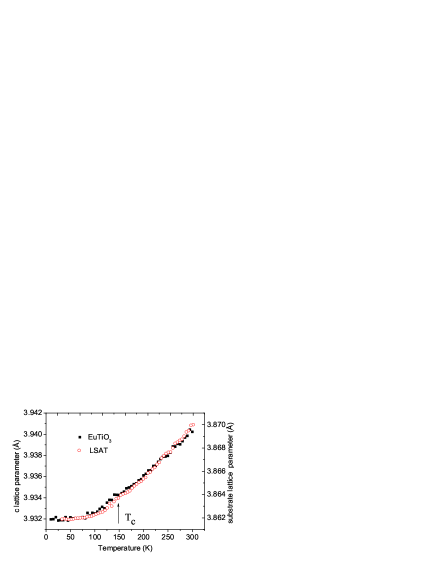
Let us discuss the first possibility. The in-plane polarized modes can split if the tetragonal symmetry of film reduces to orthorhombic or lower-symmetry structure. It is possible only in the case, when the in-plane strain would be anisotropic, i.e. the LSAT substrate would not be cubic. Indeed, it has been reported that the LSAT substrate exhibits a small distortion from cubic symmetry near 150 K and its low-temperature phase has tetragonal or orthorhombic symmetry.chakoumakos98 We have measured temperature dependence of the LSAT lattice constant and it really exhibits a small hump near 150 K (see Fig. 10) and the same anomaly is revealed also in the out-of plane EuTiO3 film lattice parameter. Moreover, the structural phase transition in LSAT can be recognized also in the microwave dielectric permittivity, where a small anomaly was observed near 150 K (see Fig. 6). Nevertheless, in case of substrate-induced anisotropic strain the split modes should have different symmetries and therefore they cannot couple, as observed in our spectra. Moreover, the possible anisotropic strain from the non-cubic LSAT substrate should as well split the phonons in SrTiO3/LSAT (SrTiO3 and EuTiO3 have the same lattice constant and therefore the strain in both films is the same), but this was not detected.nuzhnyy09 On the other hand, we have revealed the same new phonon activated in IR spectra near 150 K in EuTiO3 films deposited on NdGaO3 and LaAlO3. Compressive strains in both films are slightly relaxed and have the value of about 0.9%,goian12a , i.e. close to EuTiO3/LSAT. Since the NdGaO3 and LaAlO3 substrates do not exhibit any structural phase transition, the new mode observed in all three films cannot be activated due to anisotropic strain.
Let us discuss the second possibility that the new mode originates from the BZ edge. It can be expected that the AFD phase transition evidenced in the bulk EuTiO3bussmann-holder11 ; allieta11 ; goian12a and tensile strained thin film EuTiO3/DyScO3 (see supplement of Ref. lee10 ) should occur in the compressive thin films as well. The tetragonal symmetry reported for the bulk can be also well compatible with the thin film epitaxial geometry. Temperature of the phase transition may be considerably shifted in comparison to the bulk, of course. In the AFD phase two new phonons near 255 and 430 stemming from the R-point of the BZ edge become active in the IR spectra, as it can be seen from the Table I. However, the frequencies are much higher than that of our new mode seen between 110 and 105.
It is known that two structural soft modes (SMs) from the R-point of the BZ edge can be activated in low-frequency Raman spectra below the AFD phase transition in SrTiO3 (TC=105 K).fleury68 The AFD structure of SrTiO3 is the same as in EuTiO3 and the two AFD SMs should be IR inactive in both materials, if their structure remains centrosymmetric. However, these AFD SMs were also discovered in the low-temperature IR spectra of bulk SrTiO3 ceramicspetzelt01 and polycrystalline films. ostapchuk02 Their activation was explained by polar distortion near the grain boundaries.petzelt01 ; ostapchuk02 Activation of the AFD SM was also observed in tensile strained SrTiO3 and EuTiO3 films on DyScO3 substrates, since the tensile strain induces a ferroelectricity in both films.lee10 ; nuzhnyy09b Our new mode seen near 105 does not remind any AFD SM, because it does not harden below the assumed AFD transition temperature near 150 K. Nevetheless, it can be an optical mode from the BZ edge. Theoretical calculationsbettis11 show that the lowest-frequency optical branch exhibits almost no q dispersion in BZ, therefore TO1 mode (q=0) and the optical mode from the BZ edge have almost the same frequency. AFD SMs have probably much lower frequencies, therefore they are not resolved in our spectra. Nevertheless, both AFD SMs and optical mode from BZ boundary can be activated after folding of BZ zone only if the crystal structure becomes at least locally broken. Even if we know that the loss of the inversion center was not evidenced by the SHG signal in EuTiO3/LSAT,lee10 , it is known that the IR probe is sensitive on local breaking of the symmetry known e.g. from polar nanoclusters in relaxor ferroelectrics.hlinka06
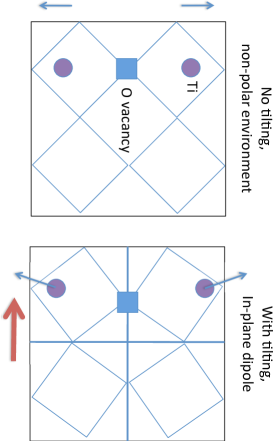
Here we propose a new possible mechanism of polar nanocluster appearance in the EuTiO3 as the consequence of AFD phase transition and oxygen vacancies, which are always present in the lattice. Let us imagine that we have oxygen vacancies in the TiO2 plane of the perovskite structure (see Fig. 11). Then, in the ideal perovskite structure without octahedra tilting the local environment around the vacancy is antipolar: two neighboring Ti atoms are equally displaced in opposite directions. In a structure which allows oxygen octahedra tilting, the displacements of Ti atoms are antipolar in one direction, but with uncompensated dipoles in orthogonal direction (see Fig. 11). In such case the local inversion symmetry is broken. We have calculated the structure in a 40-atomic simulation cell (i.e. EuTiO2.875 instead of EuTiO3) around this defect and found that it has caused Ti displacements not only around the vacancy, but also in other Ti’s in the vacancy neighborhood. Of course, the displacements of the neighboring Ti are the largest. Also, we found that the formation energy of the O vacancy in the TiO2 plane is by 0.03 eV lower than of the vacancy in the EuO plane (i.e. apical oxygen).
The IR inactive folded modes can become IR active also if we assume AFM short-range order even if it remains centrosymmetric. Our density-functional calculations for an auxiliary structure compatible with AFM order yielded a new IR active phonon (originally optical one from the BZ edge) with frequency that is 12 lower than the TO1 mode. The strength of this mode strongly depends on the conditions under which it is calculated. We have used finite displacements approach to calculate the force constant. For 0.025 displacement from their equilibrium position, the mode-plasma frequency of the new mode is about 270 (for comparison the TO1 mode has the plasma frequency around 1040). If the displacement is only 0.0027 , then the calculated mode-plasma frequency is only 24. This is a sort of probe of anharmonicity and it points to a rather strong anharmonicity of this particular mode. This mechanism of the mode activation requires a short-range magnetic order at least up to 150 K. Recent not yet published SR experimentbosmann-holder12 performed on bulk EuTiO3 revealed short-range magnetic correlations up to 300 K, which is rather surprising, because the AFM critical temperature is only 5.3 K.
Finally we can conclude that the new mode near 105 is of the same symmetry as the TO1 mode. It probably stems from lowest-frequency optical phonon branch and it is activated from the BZ edge due to the AFD phase transition. Its activation in IR spectra requires local reduction of the symmetry, which can occur due to creation of polar or magnetic nanoclusters.
VI Conclusion
Due to the compressive strain, all polar phonons polarized in the plane of the EuTiO3 films are considerably stiffened in comparison to the bulk ceramics. Below 150 K a new IR active mode was revealed near 110. We understand it as optical phonon from the BZ edge, which activates in the IR spectra below the AFD phase transition under circumstance of presence of polar and/or magnetic nanoclusters. Magnetization data show that the compressive strain enhances the Néel AFM temperature by 1 K due to the strain enhanced superexchange interaction. IR reflectance studies in magnetic field revealed a striking tuning of the lowest phonon frequency with the magnetic field. This is responsible for the magnetodielectric effect reported previously in the bulk EuTiO3.katsufuji01 Observed change of the polar phonon frequency with the magnetic field is in agreement with our theoretical calculations. Similar IR experiments with magnetic field are rather rare in the literature, because the phonon frequency changes are usually under spectral resolution in materials without a strong spin-phonon coupling. Our study shows that the IR reflectance measurements of a rather thin film can be more sensitive to the magnetic field (in the case of suitable non-conducting substrate) than the reflectivity spectra of the bulk samples or transmission spectra of the thin films. So, the IR reflectance spectroscopy is a very promising tool for a study of the magnetodielectric effect as well as of structural phase transitions in thin dielectric films deposited on electrode-less nonconducting substrates.
Acknowledgements.
This work was supported by the Czech Science Foundation (Projects Nos. 202/09/0682 and P204/12/1163). J.H. Lee and D. G. Schlom were supported by the National Science Foundation through the MRSEC program (Grant No. DMR-1120296). T. Birol and C. J. Fennie were supported by the DOE-BES under Grant No. DE-SCOO02334. Part of this work was supported by the Young Investigators Group Programme of the Helmholtz Association, Germany, contract VH-NG-409. KZR and ML gratefuly acknowledge the support of Jülich Supercomputing Centre. We are grateful to E. Šantavá for help with the magnetic measurements.References
- (1) K.F. Wang, J.-M. Liu, and Z.F. Ren, Adv. Phys. 58, 321 (2009).
- (2) C.J. Fennie and K. M. Rabe, Phys. Rev. Lett. 97, 267602 (2006).
- (3) J.H. Lee, L. Fang, E. Vlahos, X. Ke, Y.W. Jung, L. Fitting Kourkoutis, J.W. Kim, P.J. Ryan, T. Heeg, M. Roeckerath, V. Goian, M. Bernhagen, R. Uecker, P.C. Hammel, K.M. Rabe, S. Kamba, J. Schubert, J.W. Freeland, D.A. Muller, C.J. Fennie, P.E. Schiffer, V. Gopalan, E. Johnston-Halperin, and D.G. Schlom, Nature, 466, 954 (2010); ibid 476, 114 (2011). Details about IR studies of EuTiO3/DyScO3 can be found in electronic supplement.
- (4) T.R. McGuire, M.W. Shafer, R.J. Joenk, H.A. Alperin, and S.J. Pickart, J. Appl. Phys. 37, 981 (1966).
- (5) K.Z. Rushchanskii, S. Kamba, V. Goian, P. Vaněk, M. Savinov, J. Prokleška, D. Nuzhnyy, K. Kn ek, F. Laufek, S. Eckel, S.K. Lamoreaux, A.O. Sushkov, M. Ležaić, Nature Materials, 9, 649 (2010).
- (6) K.Z. Rushchanskii, N.A. Spaldin and M. Ležaić, subm. to Phys. Rev. B.
- (7) J. Brous, I. Fankuchen, E. Banks, Acta Cryst. 6, 67 (1953).
- (8) A. Bussmann-Holder, J. Köhler, R.K. Kremer, and J.M. Law, Phys. Rev. B 83, 212102 (2011).
- (9) M. Allieta, M. Scavini, L. Spalek, V. Scagnoli, H.C. Walker, C. Panagopoulos, S. Saxena, T. Katsufuji, and C. Mazzoli, arXiv:1111.0541
- (10) V. Goian, S. Kamba, O. Pacherova, J. Drahokoupil, F. Laufek, A. Fuith, W. Schranz, M. Kachlík, K. Maca, J.Hlinka, under preparation.
- (11) T. Katsufuji and H. Takagi, Phys. Rev. B 64, 054415 (2001).
- (12) V.V. Shvartsman, P. Borisov, W. Kleemann, S. Kamba, T. Katsufuji, Phys. Rev. B 81, 064426 (2010).
- (13) S. Kamba, D. Nuzhnyy, P. Vaněk, M. Savinov, K. Knížek, Z. Shen, E. Šantavá, K. Maca, M. Sadowski and J. Petzelt, Eur. Phys. Lett. 80, 27002 (2007).
- (14) V. Goian, S. Kamba, J. Hlinka, P. Vaněk, A.A. Belik, T. Kolodizhnyi, and J. Petzelt, J. Eur. Phys. B., 71, 429 (2009).
- (15) H. Akamatsu, Y. Kumagai, F. Oba, K. Fujita, H. Murakami, K. Tanaka, and I.Tanaka, Phys. Rev. B 83, 214421 (2011).
- (16) J.H. Lee, X. Ke, N.J. Podraza, L. Fitting Kourkoutis, T. Heeg, M. Roeckerath, J.W. Freeland, C.J. Fennie, J. Schubert, D.A. Muller, P. Schiffer, D.G. Schlom, Appl. Phys. Lett. 94, 212509 (2009).
- (17) V. Železný, I. Fedorov, J. Petzelt, Czech. J. Phys. 48, 537 (1998).
- (18) F. Gervais, in Infrared and Millimeter Waves, vol. 8, ed. K. J. Button (New York: Academic Press 1983) chapter 7, p. 279.
- (19) V. Bovtun, V. Pashkov, M. Kempa, S. Kamba, A. Eremenko, V. Molchanov, Y. Poplavko, Y. Yakymenko, J.H. Lee, and D.G. Schlom, J. Appl. Phys. 109, 024106 (2011).
- (20) T. Birol, C.J. Fennie, under preparation.
- (21) K. Kugimiya, K. Fujita, K, Tanaka, K. Hirao, J. Magn. Mag. Mat. 310, 2268 (2007).
- (22) K. Fujita, N. Wakasugi, S. Murai, Y. Zong, and K. Tanaka, Appl. Phys. Lett. 94, 062512 (2009).
- (23) J. Petzelt, G.V. Kozlov, A.A. Volkov, Ferroelectrics, 73, 101 (1987).
- (24) D.G. Schlom, L.-Q. Chen, Ch.-B. Eom, K.M. Rabe, S.K. Streiffer, and J.-M. Triscone, Annu. Rev. Mater. Res. 37, 589 (2007).
- (25) R.F. Schaufele, M.J. Weber, and B.D. Silverman, Phys. Lett. 25A, 47 (1967).
- (26) J.M. Worlock and P.A. Fleury, Phys. Rev. Lett. 19, 1176 (1967).
- (27) G.A. Samara and P.S. Peercy, Solid State Physics, Advances in Research and Applications, vol. 36, ed. H. Ehrenreich, F. Seitz and D. Turnbull (New York: Academic), p. 1 (1981).
- (28) T. Ruf, C. Thomsen, R. Liu, and M. Cardona, Phys. Rev. B, 38, 11985 (1988).
- (29) A.B. Sushkov, J.L. Musfeldt, Y.J. Wang, R.M. Achey and N.S. Dalal, Phys. Rev. B 66, 144430 (2002).
- (30) A. Pimenov, T. Rudolf, F. Mayr, A. Loidl, A.A. Mukhin, and A.M. Balbashov, Phys. Rev. B 74, 100403(R) (2006).
- (31) J. Cao, L.I. Vergara, J.L. Musfeldt, A.P. Litvinchuk, Y.J. Wang, S. Park, and S.-W. Cheong, Phys. Rev. Lett. 100, 177205 (2008).
- (32) I. Dzyaloshinskii, Phil. Mag. 89, 2079 (2009).
- (33) D. Nuzhnyy, J. Petzelt, S. Kamba, T. Yamada, M. Tyunina, A.K. Tagantsev, J. Levoska, N. Setter, J. Electroceram. 22, 297 (2009).
- (34) D. Nuzhnyy, J. Petzelt, S. Kamba, X. Martí, T. Čechal, C.M. Brooks, and D.G. Schlom, J. Phys.: Condens. Matter 23, 045901 (2011).
- (35) J.H. Haeni et al., Nature 430, 758 (2004). 95, 232902 (2009).
- (36) B.C. Chakoumakos, D.G. Schlom, M. Urbanik, J. Luine, J. Appl. Phys. 83, 1979 (1998).
- (37) P.A. Fleury, J.F. Scott, and J.M. Worlock, Phys. Rev. Lett. 21, 16 (1968).
- (38) J. Petzelt et al. Phys. Rev. B 64, 184111 (2001).
- (39) T. Ostapchuk et al. Phys. Rev. B 66, 235406 (2002).
- (40) D. Nuzhnyy, J. Petzelt, S. Kamba, P. Kužel, C. Kadlec, V. Bovtun, M. Kempa, J. Schubert, C.M. Brooks, and D.G. Schlom, Appl. Phys. Lett. 95, 232902 (2009).
- (41) J.L. Bettis, M.-H. Whangbo, J. Köhler, A. Bussmann-Holder, and A.R. Bishop, Phys. Rev. B 84, 184114 (2011).
- (42) J. Hlinka, J. Petzelt, S. Kamba, D. Noujni, and T. Ostapchuk, Phase Transitions 79, 41 (2006).
- (43) A. Bussmann-Holder, private communication.