Multiwavelength studies of hard X-ray selected sources
Abstract:
Hard X-ray surveys like those provided by IBIS and BAT on board the INTEGRAL and Swift satellites list a significant number of sources which are unidentified and/or unclassified and which deserve multiwaveband observations to be properly characterized. In this work we have been able to follow up 148 such sources, finding 27 X-ray binaries and 121 Active Galactic Nuclei (AGN). From the AGN sample we extracted a set of 94 AGN, belonging to the INTEGRAL/IBIS and Swift/BAT surveys, for which we performed an X-ray study to determine absorption and 2-10 keV flux by means of XMM-Newton and Swift/XRT available observations. Using a new diagnostic diagram we identified a few peculiar sources which apparently do not fit within the AGN unified theory. Finally, we have compared the optical versus X-ray properties of these 94 AGN to study the optical reddening versus the X-ray absorption local to the AGN.
1 Introduction
A critically important region of the astrophysical spectrum is the hard X-ray band, from 15 to 200 keV. In this band, an unusually rich range of astrophysical processes occurs. This is the energy domain where fundamental changes from primarily thermal to non-thermal sources/phenomena are expected, where the effects of absorption are drastically reduced and where most of the extreme astrophysical behaviour takes place.
Surprisingly, for such a pivotal region of the astronomical spectrum, the hard X-ray Universe has been relatively unexplored until recently. A number of surveys at energies higher than 10 keV are however now available to study the high energy sky. Indeed the surveys performed by IBIS on board INTEGRAL, together with those made by BAT on board Swift, provide the best sample of objects selected in the hard X-ray band to date ([1], [2]). They work in similar spectral bands, but concentrate on different parts of the sky: IBIS maps mainly the Galactic plane, while BAT focuses on observations at high Galactic latitudes. All these pioneering studies indicated that the sky is rich of sources emitting above 10 keV, the majority being active galaxies of different types, X-ray binaries (with a black hole or a neutron star as accreting object) and pulsars. But there is more than producing a catalogue in the study of the sky at energies greater than 10 keV. Hard X-ray observations are crucial in studying absorbed sources and in exploring spectral features.
In this work we have selected from the surveys of [2] for BAT and [1] and [4] for IBIS, those objects either without optical identification, or not well studied or without published optical spectra. Following the method applied by [8], [9], [10], [11], [12] and [13] for the optical spectroscopic follow-up of unidentified INTEGRAL sources, we determine the nature of 148 selected objects, of which a large fraction (82) turned out to be active galaxies. The remaining objects were found to be binaries of different types and will not be discussed further here (for more details see Parisi 2011 Bologna University Ph.D. thesis).
From the sample of AGN, we extracted a set of 94 objects for which we performed an X-ray followup study by means of XMM-Newton and Swift/XRT observations. We determined their X-ray spectral properties and in particular, for most objects in the sample, we measured photon index, absorption column density and X-ray flux. Using a diagnostic diagram (see. [6]) we identified a few peculiar sources like unabsorbed type 2 sources and absorbed type 1 objects: the first ones could be Compton thick AGN candidates (sources with column density greater than 1024 cm-2), but also AGN without a Broad Line Region, while the second group may be composed of AGN viewed from a particular line of sight. Both types of objects are unexpected in the classical unified model of AGN. Finally, in the last part we have compared the optical properties of these 94 AGN with their X-ray characteristics and we discussed our overall results.
2 Observations and data analysis
For the optical follow up work, we used a set of 9 optical telescopes (2 national and 7 international)
plus archival spectra from 6dF111http://www.aao.gov.au/local/www/6dF and SDSS222http://www.sdss.org.
The data reduction was performed with the standard procedure using IRAF as described in [8], [9], [10], [11], [12] and [13].
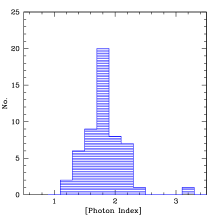
The X-ray data analysis was performed using Swift/XRT pointings for 85 out of 94 objects, while for the remaining ones archival XMM-Newton observations have been considered. Due to the low statistics available, we chose for each source the best energy range for the spectral analysis and we employed as our baseline model, a simple power law (often fixing the photon index to a canonical value of 1.8), absorbed by the Galactic ([3]) and, when required, the intrinsic neutral hydrogen column density. In figure 1 we report the photon index and the Log(NH) distributions for the total sample composed of 94 AGN. The average values for these distributions are respectively 1.830.34 and 22.60.8.
3 X-ray versus optical classification
The basic hypothesis of the unified theory of AGN is that the X-ray absorption and optical obscuration are tightly related: absorbed AGN should be classified as type 2 in optical (narrow permitted and forbidden lines are visible, so that in the optical spectra we only see the Narrow Line Region), while unabsorbed ones are expected to be of type 1 (broad permitted lines and narrow forbidden lines are visible, as we see both the Broad and the Narrow Line Regions).
This relationship is not always respected as it is evident in our sample (made of 38 type 1 and 56 type 2 objects333For type 1 objects we means Seyfert 1-1.9 according to the classification reported in [16]) where we find absorption in
a number of type 1 objects and no absorption in a number of type 2 sources. In particular, unabsorbed type 2 AGN, could be either unrecognized Compton thick, or heavily obscured objects, or alternatively ”naked” type 2 sources, i.e. those lacking the broad line region.
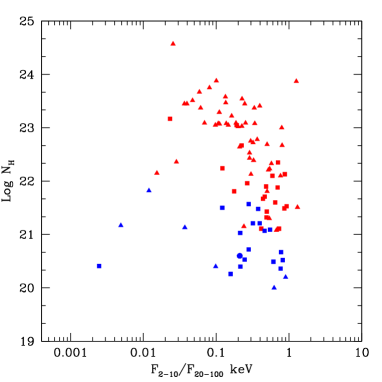
To discriminate among these classes, we use the diagnostic diagram provided by [6]. This diagram uses the NH versus softness ratio
F(2-10keV)/F(20-100keV) to look for Compton thick AGN candidates and its validity
has recently been confirmed by [15] and [7]: misclassified Compton thick objects populate the part
of the diagram with low absorption and low softness ratios. Figure
2 shows this diagnostic tool applied to our sample.
The 20-100 keV data have been obtained from the IBIS and BAT surveys ([1] and [2]).
In the case of BAT data we estimated
the 20-100 keV flux from the published 14-195 keV value, assuming a power law of photon index = 2.02.
In the plot of figure 2, an indication
of decreasing softness ratio as the absorption increases is visible as
expected if the 2-10 keV flux is progressively depressed when the
absorption becomes stronger. Blue (red) symbols in the figure represent
upper limits (measured values) on the column density both for type 1 and type 2 objects, which are indicated with red squares and triangles respectively. As anticipated, most of our sources follow the expected
trend except for a few objects which have too low a softness ratio for
the observed column density, suggesting a Compton thick nature.
We therefore suggest that 3 of our sources can be new Compton thick AGN candidates for which further analysis is necessary
(i.e. those Seyfert 2 galaxies with F(2-10keV)/F(20-100keV) below a value of 0.05), while 3 more can be possibly naked Seyfert 2
(i.e. those Seyfert 2 galaxies with F(2-10keV)/F(20-100keV) above a value of 0.1 and with only a galactic NH); lastly 7 are absorbed
type 1 objects, where the intrinsic NH is greater than 1022 cm-2.
In any case further analysis is necessary because, a low softness ratio may also arise from source variability, since follow-up observations
with XMM and Swift/XRT were not taken simultaneously with INTEGRAL.

4 Optical versus X-ray absorption
Various studies have shown that X-ray and optical nuclear absorptions do not always match in AGNs. In particular, the measured optical extinction seems to be lower than that inferred from the absorption measured in X-rays, assuming a Galactic gas-to-dust ratio ([5], [16]); this evidence comes so far from studies done on small samples of AGN. This is an important effect since it could provide important observational consequences such as a mismatch between optical and X-ray classification. From our analysis, we found that the Balmer decrement and hence the reddening E(B-V) is lower in the broad line than in the narrow line sources; this is similar to what observed in X-rays where type 1 objects tend to have lower absorbing column densities than type 2 AGN. Therefore we do not expect a big mismatch between the optical and the X-ray classification. Clearly a one to one comparison is necessary and now possible with our sample of AGN. For this, we use the E(B-V) calculated from the Balmer decrement using the following formula derived from [14]:
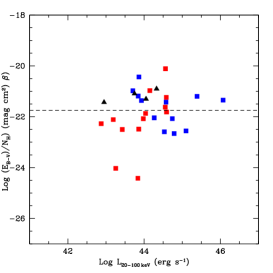
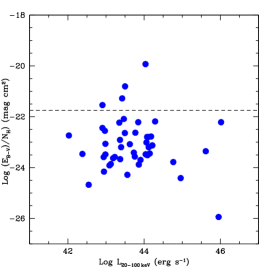
where H is the observed Balmer decrement, is the intrinsic one (2.86), while a is a constant (2.21), and the X-ray column density estimated from the X-ray spectra discussed in the previous chapter. Following [5], we choose to show in Figure 3 the EB-V/NH ratio as a function of the 20-100 keV luminosity; the dotted line reported in the figure represents the standard Galactic gas-to-dust ratio. It is worth noting that E(B-V) refers to extinction in the broad line region (BLR) in Seyfert 1s and to the narrow line region (NLR) in Seyfert 2; it is therefore not surprising that low EB-V/NH values are found for Seyfert 2s, since narrow lines originate mostly outside the region where the X-ray absorption takes place. Indeed we find that the EB-V/NH ratio is around the Galactic standard for the majority of type 1 sources (Fig. 3, right panel); the only two exceptions are IGR J12107+3822 and IGR J09253+6929, which have a very low EB-V/NH. Both have a conspicuous X-ray column density and are intermediate Seyferts. The first source has a good quality 2-10 keV spectrum and so we can assume that the value of the X-ray column density is well constrained; this could be an intermediate Seyfert with complex absorption where we see the nucleus not directly, but at some inclination angle so that our line of sight intercepts thicker material from the torus. The second source has a low quality X-ray spectrum with huge errors in the estimate of the NH and a fixed photon index; it is thus possible that, with better statistics, its position in the graph shifts to a EB-V/NH ratio closer to the dotted line.
Concerning the more heavily absorbed X-ray type 2 sources (Fig. 3, left panel), we observe two typologies: those with an EB-V/NH ratio not very different from the galactic value and those substantially lower than the Galactic standard by a factor of 10-100. The first objects are somehow unexpected and could be AGN with extra dust absorption in the NLR. Further observations of these objects could be of some interest.
5 Discussion and conclusion
To conclude, in our sample, composed of 38 type 1 and 56 type 2 active galaxies, we find that the majority of our sources follow the unified theory of AGN, with absorbed AGN classified as type 2 and unabsorbed AGN as type 1. Some objects are however somewhat peculiar, as they do not follow this trend. Using the diagnostic diagram of [6], we isolated these peculiar sources and discriminate among absorbed Seyfert 1, Compton thick sources or naked Seyfert 2, finding 3 possible Compton thick sources, 3 naked type 2 and 7 absorbed type 1 AGN. Concerning the hard X-ray and optical properties, if we compare our work with respect to the work of [5] and more recently that of [16], our results are somehow different. Most of our type 1 AGN show similar amount of reddening in optical and X-rays which indicates a similar region (torus/BLR) for the dust and gas extinction. On the other hand not all type 2 AGN, but only a fraction, show low EB-V/NH ratios as expected given that the optical extinction originate outside the region where the X-ray absorption takes place.
References
- [1] A.J. Bird, A. Bazzano, L. Bassani, et al. 2010, ApJS, 186, 1
- [2] G. Cusumano, V. La Parola, A. Segreto, et al. 2010, A&A, 524, 64
- [3] J.M. Dickey & F.J. Lockman, 1990, A&A, 28, 215
- [4] R. Krivonos, S. Tsygankov, M. Revnivtsev, et al. 2010, A&A, 523, 61
- [5] R. Maiolino, A. Marconi, M. Salvati, et al. 2001, A&A, 365, 28
- [6] A. Malizia, R. Landi, L. Bassani, et al. 2007, ApJ, 668, 81
- [7] A. Malizia, L. Bassani, F. Panessa, et al. 2009, MNRAS, 394, 121
- [8] N. Masetti, Palazzi, E., Bassani, L., et al. 2004, A&A, 426, L41
- [9] N. Masetti, L. Bassani, A. Bazzano, et al. 2006a, A&A, 455, 11
- [10] N. Masetti, L. Morelli, E. Palazzi, et al. 2006b, A&A, 459, 21
- [11] N. Masetti, E. Mason,L. Morelli, et al. 2008, A&A, 482, 113
- [12] N. Masetti, P. Parisi, E. Palazzi, et al. 2009, A&A, 495, 121
- [13] N. Masetti, P. Parisi, E. Palazzi, et al. 2010, A&A 519, A96
- [14] D.E. Osterbrock, 1989, Astrophysics of Gaseous Nebulae and Active Galactic Nuclei
- [15] Y. Ueda. S. Eguchi, Y. Terashima, et al. 2007, ApJ, 664, L79
- [16] H. Winkler, 1992, MNRAS, 257, 677
- [17] L. Winter, K.T. Lewis, M. Koss, et al. 2010, ApJ, 710, 503