On the nature of high X-ray luminosities in SDSS galaxies
Abstract
Surveys have revealed a class of object displaying both high X-ray luminosities (LX 1042 erg s-1), and a lack of a discernible active galactic nucleus (AGN) in the optical band. If these sources are powered by star formation activity alone, they would be the most extreme X-ray luminosity star forming galaxies known. We have investigated the mechanism driving the X-ray luminosities of such galaxies by studying the X-ray emission of three moderate redshift (z 0.1) examples of this class, selected from a cross-correlation of the SDSS-DR5 and 2XMMp-DR0 catalogues. X-ray spatial and long-term variability diagnostics of these sources suggest that they are compact X-ray emitters. This result is supported by the detection of rapid short term variability in an observation of one of the sources. The X-ray spectra of all three sources are best fitted with a simple absorbed power-law model, thus betraying no significant signs of star formation. These results indicate that the X-ray emission is powered by AGN activity. But why do these sources not display optical AGN signatures? We show that the most likely explanation is that the optical AGN emission lines are being diluted by star formation signatures from within their host galaxies.
keywords:
galaxies: active galactic nuclei (AGN): star formation: starburst galaxies.1 Introduction
Deep and wide area X-ray surveys (e.g., Alexander et al. 2003; Lehmer et al. 2005; Kim et al. 2007; Elvis et al. 2009; Watson et al. 2009; Xue et al. 2010) have resolved up to 90% of the X-ray background into discrete sources over the 0.5–8 keV band (e.g., Lumb et al. 2002; Moretti et al. 2003; Bauer et al. 2004; Worsley et al. 2005; Hickox & Markevitch 2006). The majority of the objects detected in these surveys are luminous X-ray sources at 0.2–5 with erg s-1 (e.g., Hornschemeier et al. 2001; Barger 2003; Brandt & Hasinger 2005; Treister et al. 2005; Silverman et al. 2010). Many of these luminous X-ray sources are clearly Active Galactic Nuclei (AGN), as demonstrated by the detection of either optical AGN signatures (i.e., broad emission lines and/or narrow high-excitation emission lines; e.g., Barger et al. 2002; Szokoly et al. 2004) or hard X-ray spectra (; Mushotzky et al. 2000; Giacconi et al. 2001). However, a significant fraction of these luminous X-ray sources display optical spectroscopic signatures consistent with star formation (e.g., Barger et al. 2002; Szokoly et al. 2004; Eckart et al. 2006; Trouille et al. 2008). The luminous X-ray emission could be due to either AGN activity where the optical spectroscopic signatures are extinguished or diluted (e.g., Moran et al. 2002; Maiolino et al. 2003; Goulding & Alexander 2009), or star formation activity. These objects are distinct from the population of X-ray dim, ’normal’, star forming galaxies now being revealed in deep high- surveys (e.g., Lehmer et al. 2008).
If confirmed as star forming galaxies, then these luminous X-ray sources will be the most powerful starburst galaxies known (with – erg s-1), exceeding the X-ray luminosity of the brightest star forming galaxies in the local Universe by over an order of magnitude (e.g., Moran et al. 1999; Zezas et al. 2001; Lira et al. 2002; Ptak et al. 2003). However, accurately characterising the X-ray emission from these distant luminous X-ray sources is challenging due to their faint fluxes and therefore limited X-ray photon statistics. Greater insight into their nature can be gained by selecting the rare nearby ( 0.15) examples of these luminous X-ray sources where the photon statistics are much improved (e.g., Horschemeier et al. 2005). The advantages of this approach are twofold; firstly the accurate characterisation of the X-ray emission via X-ray spectral and variability analyses, and secondly the accurate characterisation of the optical spectroscopic signatures.
In this paper we present XMM-Newton data and detailed analyses of three X-ray luminous galaxies at 0.1. These targets were selected from the 80 deg2 overlap between the pre-release version of the source catalogue of the XMM-Newton Serendipitous survey (2XMMp-DR0)111The 2XMMp catalogue (http://xmmssc-www.star.le.ac.uk/Catalogue/2XMMp/) is a subset of the full 2XMM catalogue (Watson et al., 2009). Most of the details of its production are very similar to the full 2XMM catalogue, as described by Watson et al. (2009). and the Sloan Digital Sky Survey data 5 (SDSS-DR5)222http://www.sdss.org/dr5. The aim of this study is simply to determine whether the X-ray emission is powered by star formation, or by AGN activity. This paper is structured as follows: in section 2, we give details about the source selection criteria. The X-ray observations used in this study are described in section 3, along with the data reduction details. In section 4, we describe the results of the spatial, spectral, and timing analyses performed on the X-ray data for each source. In section 5, we discuss the results , and finally, we conclude the paper in section 6. Throughout this work, we assume the values km s-1 Mpc-1, and .
2 Source Selection
As an initial step, we cross-correlated the SDSS DR5 and 2XMMp-DR0 catalogues. From the large number of cross-matches we then selected X-ray sources that were identified with galaxies possessing star formation dominated SDSS optical spectra, with no clear AGN signature. The criteria used included, for example, strong narrow emission lines, low [SII]/Hand [OIII]/H ratios, and underlying continua dominated by young stars.
| Source ID | Mag a | Notes f | ||||||
|---|---|---|---|---|---|---|---|---|
| 2XMMp… | SDSS… | (arcsec) | (mag) | (1020 cm-2) | ||||
| J082042.4+205715 | J082042.46+205714.9 | 16.6g | 0.114 | 9.6 | 1.28 | 0.213 | 4.25 | (1) |
| J123719.3+114915 | J123719.34+114915.9 | 18.3g | 0.108 | 3.6 | 1.09 | 0.183 | 2.56 | |
| J140052.5-014510 | J140052.57-014510.0 | 17.7g | 0.149 | 5.4 | 1.13 | 0.232 | 3.89 | (2) |
Notes: a Observed SDSS magnitude and filter; b Semi-major axis of the isophotal ellipse; c Ratio of major and minor axes; d Galactic foreground extinction according to Schlegel et al. (1998); e Galactic neutral absorbing column from colden ; f Additional notes: (1) This source was previously detected in the 0.2 – 2 keV X-ray band by ROSAT, at a flux of 7.6 erg cm-2 s-1. It was also detected as an infra-red source by the 2MASS survey with a J-band magnitude of 14.33, and as a radio source in the FIRST and NVSS surveys at a 1.4 GHz flux density of 4 mJy. (2) Also detected in the 2dF Galaxy Redshift Survey (Colless et al. 2001) as 2dFGRS TGN272Z262, confirming the above redshift measurement. Data for the galaxy properties are taken from the SDSS catalogue, and the notes result from searches in the NED (http://nedwww.ipac.caltech.edu/) and SIMBAD (http://simbad.u-strasbg.fr/simbad/) databases.
| Source ID | Balmer Decrement | AVa | LHαb | SFRHαc | Fd | SFRe | LXf | SFRXg |
|---|---|---|---|---|---|---|---|---|
| (2XMMp…) | (mag) | ( 1042 erg s-1) | (M yr-1) | (mJy) | (M yr-1) | ( 1042 erg s-1) | (M yr-1) | |
| J082042.4+205715 | 6.55 | 2.40 | 3.55 | 28.1 | 4.5i | 110 | 5.4 | 400 |
| J123719.3+114915 | 4.20 | 1.11 | 0.70 | 5.6 | 4.4ii | 95 | 2.8 | 200 |
| J140052.5-014510 | 7.68 | 2.86 | 4.21 | 33.4 | 1.1i | 50 | 13.9 | 1000 |
Note: a V-band extinction, calculated with the assumption that the non-reddened Balmer ratio should be 2.86; b De-reddened H luminosity; c H star formation rate as per Doherty et al (2006); d 1.4 GHz radio flux; e 1.4 GHz radio star formation rate as per Bressan et al (2002). Note that the radio fluxes recorded in this table for both J123719.3+114915 and J140052.5-014511 are conservative 3 upper limits; f Initial 0.3 – 10.0 keV X-ray luminosity measurement based on the 2XMMp catalogue; g X-ray star formation rates calculated as per Grimm et al. (2003). [i as observed by the NVSS; ii as observed by the FIRSTsurvey.]
| Source ID | Obs ID | Observation | Instrument b | Off-axis angle c | Exposure d | Detected source | Light curve |
|---|---|---|---|---|---|---|---|
| date a | counts | bin size e | |||||
| (2XMMp…) | (arcmins) | (ks) | (s) | ||||
| J082042.4+205715 | 01088605011 | 15-10-2001 | EPIC | 7.1 | 16.3 | 62561 | 2500 |
| J082042.4+205715 | 79251 | 18-09-2007 | ACIS-I | 9.7 | 48.8 | 27819 | 5000 |
| J082042.4+205715 | 0505930301∗2 | 04-04-2008 | EPIC | 0 | 36.6 | 4405133 | 1500 |
| J123719.3+114915 | 01128401011 | 12-06-2003 | EPIC | 4.7 | 14.7 | 18555 | 2500 |
| J123719.3+114915 | 95582 | 29-02-2008 | ACIS-S | 0 | 49.3 | 13412 | 12500 |
| J140052.5-014510 | 02004309011 | 02-07-2004 | EPIC | 11.0 | 7.5 | 57141 | 500 |
| J140052.5-014510 | 0505930101∗2 | 18-10-2007 | EPIC | 0 | 21.4 | 374399 | 1000 |
| J140052.5-014510 | 0505930401∗2 | 10-01-2008 | EPIC | 0 | 16.4 | 176091 | 500 |
| J140052.5-014510 | 95572 | 11-03-2008 | ACIS-S | 0 | 49.4 | 178042 | 2500 |
Notes: a Date in dd-mm-yyyy. b EPIC=XMM-Newton EPIC-MOS and pn cameras; ACIS-S = Chandra ACIS-S camera; ACIS-I = Chandra ACIS-I camera. c Angular distance between the pointing axis for the observation (for XMM-Newton this is taken from the pn detector axis) and the source. d The flaring-compensated exposure time. e The timing analysis light curve bin sizes. ∗ The targets of these observations are recorded in the archive as 2XMMp J082042.5+205715, and 2XMMp J140052.6-014511, as a result of rounding errors by the proposers. 1 Observations from which the data are archival. 2 Observations from which the data was obtained especially for this study.
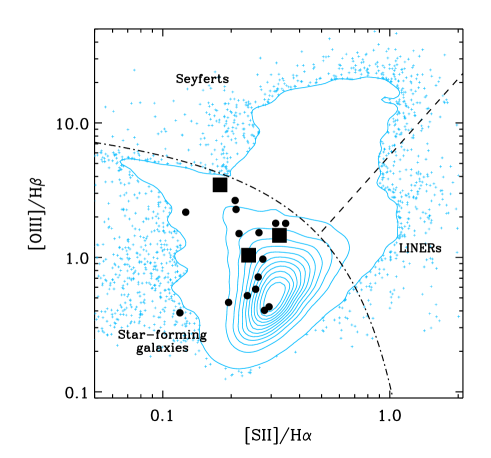
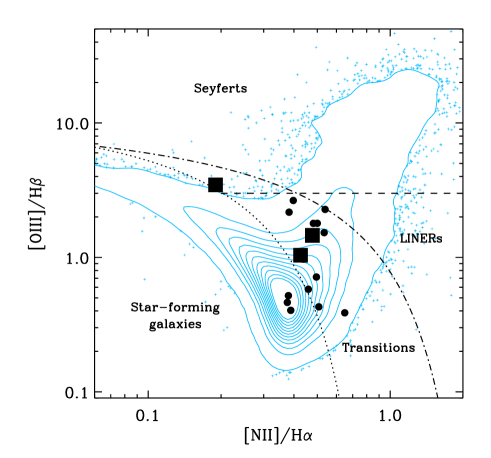
These serendipitous X-ray bright starburst galaxy candidates were then further filtered to provide a small sample of objects for follow-up observations in order to conduct a more detailed investigation. The main criteria were: (i) unusually high apparent X-ray luminosity for a starburst galaxy, , and (ii) an estimated on-axis EPIC-pn count rate in excess of 0.01 ct s-1 for better photon statistics. Nineteen sources were found to match the first criterion. Of these sources, three were identified matching the second criterion: 2XMMp J082042.4+205715, 2XMMp J123719.3+114915, and 2XMMp J140052.5-014510. The characteristics of these three objects are presented in Table 1. Figure 1 shows the emission-line diagnostic diagrams representing the [SII]/H versus [OIII]/H and [NII]/H versus [OIII]/H ratios of a large sample of galaxies, selected from the SDSS DR7 catalogue. Included in this sample are the ratios of our three galaxies, represented by the three filled squares in both panels. In the case of the [SII]/H diagnostic, all three of the sources’ flux ratios lie well within the starburst region of the diagram. In the [NII]/H diagram, the three sources’ ratios lie within the diagram’s Transition region. This, however, does not indicate a definite presence of an AGN. For example, a number of pure star forming galaxies such as NGC 7714, Mrk 711, and UM 304 have flux ratios that pertain to those of Transition sources (Terlevitch et al. 1991). No evidence has been reported on the presence of AGNs within these galaxies. The filled circles represent the remaining 16 sources that were selected from the SDSS catalogue based on high X-ray luminosity.
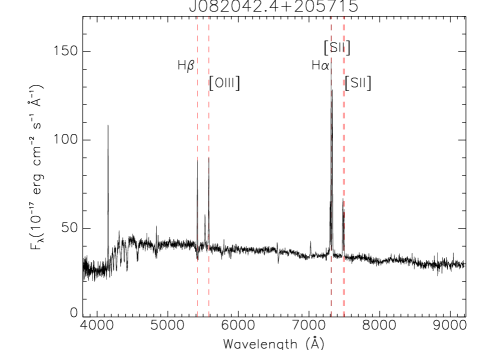
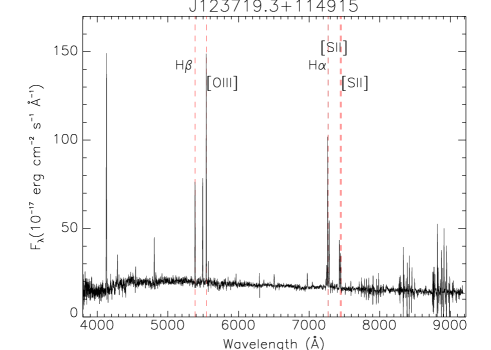
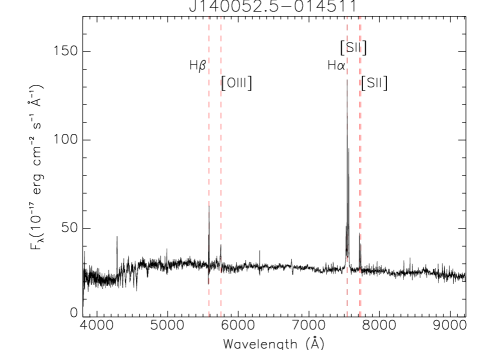
We obtained SDSS optical data for the objects from the SDSS DR7 catalogue333The observations were taken in 2002 and are associated with the SDSS-DR5 release. The reduction of the spectra was done in 2008, and is associated with SDSS-DR7 (http://www.sdss.org/dr7/). The sources’ SDSS optical spectra can be seen in Fig. 2. Optical AGN signatures (i.e., emission lines from broad and narrow line regions near to an AGN) are lacking in these spectra. However, signs of star formation, such as the presence of strong H and H lines, are seen. Along with the optical data, radio data were obtained from the NRAO VLA Sky Survey (NVSS)444http://www.cv.nrao.edu/nvss/ and the VLA Faint Images of the Radio Sky at Twenty-Centimeters (FIRST) survey555http://sundog.stsci.edu/ for each source. Using both the optical and radio data, we estimated the sources’ H and 1.4 GHz radio fluxes, and converted them to star formation rates as per Doherty et al. (2006) and Bressan et al (2002), respectively. We also estimate the sources’ X-ray star formation rates as per Grimm et al. (2003). Estimated star formation rates can be seen in Table 2. In all three sources, a moderate H star formation rate is seen, ranging from 6 to 30 M yr-1. Two of the three radio star formation values are calculated using conservative 3 upper limits to radio flux, and therefore only represent upper limits to star formation rates, with SFR1.4GHz 95 and 50 M yr-1 for J123719.3+114915 and J140052.5-014511, respectively. The one remaining star formation rate is relatively high, at 110 M yr-1 for J082042.4+205715. The X-ray estimates are a lot higher than these values, at 400, 200, and 1000 M yr-1. These extremely high values were calculated on the assumption that the X-ray emission from these galaxies is powered by star formation alone. This suggests that non-stellar activity is dominating the X-ray emission. We investigate this possibility in later sections of the paper.
Because the sources are off-axis in the serendipitous observations, these data are not good enough to yield high quality photon statistics. Therefore, new XMM-Newton observations were sought and obtained for two of the objects (PI: Roberts); two of the three were also awarded new observations on Chandra (PI: Gelbord) with the third already being observed at the edge of the NGC 2563 group field-of-view. Details of the full set of XMM-Newton and Chandra observations of the three objects are presented in Table 3.
3 Observations and Data Reduction
A total of nine X-ray observations are examined in this analysis. The archival data sets were either downloaded from the XMM-Newton Science Archive666http://xmm.esac.esa.int/xsa/ or the Chandra Data Archive777http://cxc.harvard.edu/cda/. The three targets were initially identified at a variety of off-axis angles in three separate serendipitous XMM-Newton detections (see Table 3). J082042.4+205715 and J140052.5-014510 were subsequently observed on-axis as the target of follow-up XMM-Newton observations, with the latter observed on two separate occasions. All observations were taken in a full frame imaging mode, although in the XMM-Newton observation 0505930101, only the pn and MOS1 detectors obtained sufficient data for the analysis. This is because the pn had a full active buffer during the observation, which resulted in the data begin lost from the MOS2 detector. The overall exposure of MOS2 was 5 ks as a result, thus yielding a net photon count of 20.
Reduction of the XMM-Newton data was performed using XMM-Newton sas version 8.0.0 software. Contamination by background flaring was present in all observations. In order to remove this, good time interval (GTI) files were created by excluding periods during which the count rate in the 10 - 15 keV full field pn light curves exceeded 1 ct s-1, and the data were filtered to remove these periods in the subsequent analyses.
Spectral data were extracted from circular regions of radius 45 arcseconds, centred on each of the source positions, with only two exceptions. In observation 0112840101, J123719.3+114915 is located immediately adjacent to a chip gap in the MOS1 data, forcing us to obtain the data in an aperture of only 12.5 arcseconds radius. The resulting aperture encircled only 50% the energy of the source. This loss of area was compensated for by the corresponding source ancilliary matrix file (see below). In the case of the 0505930301 data, J082042.4+205715 was sandwiched between a nearby source – not present in the 0108860501 data – and a pn chip gap, causing the aperture to be shrunk to 30 arcseconds radius (a slight offset of the aperture allowed a full 45 arcsecond radius region to be used in the MOS data). Corresponding background files were extracted from source-free circular regions with radii at least 1.5 times greater than source extraction regions, or multiple regions with a summed area equivalent to this. They were positioned on the same chip as, and in close proximity to, the source regions. The spectral data files were extracted with FLAG = 0 and either PATTERN 4 for pn or PATTERN 12 for MOS, using standard XMM-Newton tasks. Response matrix and ancillary response files were also created as part of these tasks. In all but one of the resulting spectral files the data were grouped into bin sizes of at least 20 counts per bin. The spectra from 0112840101 were left unbinned as the overall number of photon counts (185 55 cts) was too low to be compatible with model fitting via standard analysis. Instead, Cash statistical analyses (Cash 1979) were utilised on the spectral data (see Section 4.3).
Source and background light curves were extracted in the standard manner to facilitate timing analysis of the XMM-Newton data. This used the same regions from which the spectral files were extracted. For the analysis of this data, we set a minimum signal to noise ratio (S/N) requirement of 5 per bin. In order to accommodate this, the light curve bin sizes were set according to the source photon count rate. Table 3 contains details of the temporal binning corresponding to individual observations. In order to correct for GTI gaps (due to background flaring) that left substantial time periods missing within individual light curve bins - and hence gave erroneous count rates - we created new GTI files on the same binning as the light curves. These were used when extracting the light curves, and effectively removed the time bins associated with flaring, leaving only bins containing reliable count rates.
Unlike the XMM-Newton observations, only one of the three sources was detected serendipitously with Chandra (again, see Table 3). This source, J082042.4+205715, was detected off-axis by the ACIS-I instrument with the camera in the full frame, timed exposure mode. The remaining two sources were observed by the ACIS-S instrument in two separate on-axis follow-up observations, again with the camera in a full frame, timed exposure mode. All of the data were obtained in the very faint telemetry format.
The Chandra data was reduced using ciao software (version 4.1.1), adopting standard methods. Spectra were extracted using the ciao specextract routine. In the subsequent spectral analysis the spectral data files for observations 7925 and 9558 were left unbinned due to the low quality of the data and, as with the lower quality XMM-Newton data, Cash statistical analysis was performed. The one remaining observation, 9557, possessed sufficient source counts to permit binning to at least 20 counts per bin and model fitting using statistics. As per the timing analysis with XMM-Newton data, Chandra light curves were extracted from apertures similar to those used to extract the spectra. The bin sizes for the light curves were again set using the S/N 5 requirement (also see Table 3 for the Chandra light curve binning).
4 Results
4.1 Point Source Analysis
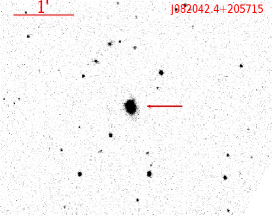
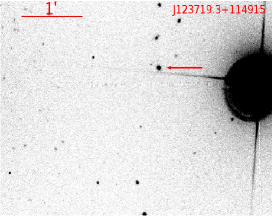
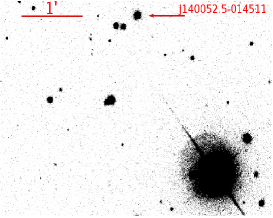
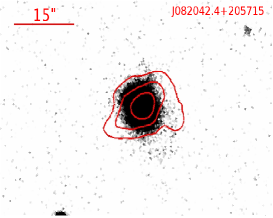
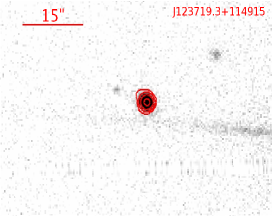
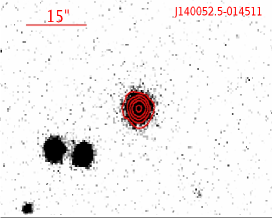
A first, key test of whether the X-ray emission of the selected objects originates in an AGN or a starburst region, is whether the X-ray emission appears point-like at the highest available spatial resolution. If extension is present, this would confirm that there is a spatially extended X-ray emission region, consistent with at least part of the X-ray emission originating in a large starburst region. Such a test is possible for our objects as high spatial resolution ( 1 arcsec/pixel) Chandra data are available for all three of them. We show both the identification of the counterpart starburst galaxy on an SDSS R-band field, and a close-up of the individual galaxy with Chandra X-ray emission contours overlaid, in Fig. 3. Note that the obvious extension of the contours to J082042.4+205715 can, to first order, be explained by point spread function (PSF) degradation due to its off-axis location in the Chandra ACIS-I field-of-view (cf. Table 3). The other objects appear compact, consistent with a point-like source on axis.
In order to best determine whether the sources are truly point-like or extended, it is necessary to undertake a detailed analysis of the PSF of each of the sources. In order to do this, we first simulated the PSF of point-like sources with the same flux and off-axis angles as our objects. These simulations require the use of both the Chandra ray tracer, chart 888http://cxc.harvard.edu/chart, and the MARX999http://space.mit.edu/CXC/MARX/ simulator. Firstly, we use chart to produce a series of simulated monochromatic PSFs, ranging over the 0.3 – 10 keV range, with appropriate fluxes and positions with respect to the detector axis. These PSFs are the result of ray-tracing through the Chandra HRMA X-ray optics, and still require projecting onto the detector plane (taking account of the detector response). This functionality is provided by marx, which we therefore use to complete the simulation process. We then compare these simulated PSFs to the actual data using the ciao srcextent script101010http://cxc.harvard.edu/ciao/threads/srcextent/. This uses a Mexican Hat Optimisation algorithm to determine a ’size’ – effectively an average radius – for each PSF, and directly compares the two. We show the results from srcextent in Table 4 for the real data, and the simulated monochromatic PSF at 1 keV.
| Source | Obs. | PSF | Source | Source |
|---|---|---|---|---|
| ID | ID | sizea | sizea | size |
| (2XMMp…) | (arcsec) | (arcsec) | (kpc) | |
| J082042.4+205715 | 7925 | 2.910.35 | 2.55 | 6.49 |
| J123719.3+114915 | 9558 | 0.490.04 | 0.47 | 1.20 |
| J140052.5-014510 | 9557 | 0.50 | 0.450.03 | 1.150.08 |
Note: a The Mexican hat optimisation algorithm employed by srcextent fits a 2-D elliptical Gaussian to the PSF; the ’size’ quoted is calculated as , where and are the semi-major and semi-minor axes of the elliptical Gaussian respectively. The errors are quoted at the 90% confidence level.

As Table 4 shows, the observational data does not appear extended with respect to the simulated data at 1 keV (chosen as an illustrative example as it is close to the peak of the Chandra effective area). Indeed, none of the simulated PSFs (over the typical ACIS energy range) appeared significantly narrower than the observational data. [In fact, we note that in most cases the simulated PSFs appeared slightly broader, although the PSFs generally agreed at about the 90% error level.] From the measured extents, we have deduced that the physical sizes of the X-ray sources are constrained to within 6.5 kpc for J082042.4, and to within 1.2 kpc for both J123719.3 and J140052.5. It is worth noting that the compact nature of at least two of these sources does not rule out the presence of star formation within the galaxies’ nuclei. It is possible for compact nuclear star formation to be occuring on less than kpc scales, given the distances of the sources.
4.2 Intra-observational variability
A second key distinction between AGN activity and large star formation regions can be made on the basis of their short-term variability. A large, spatially extended region composed of many individual X-ray sources will not vary coherently on short timescales (i.e. within a single X-ray observation, typically less than a day). A compact object like an AGN, on the other hand, may readily vary on timescales of hours (e.g. Lawrence et al. 1987; Markowitz et al. 2003; Smith & Vaughan 2007). We therefore analysed the light curve of each observation to search for short-term variability.
Using the background-subtracted light curves, we employed a fit to test whether the X-ray data are variable against a constant count rate hypothesis. To improve statistics, the EPIC-pn and MOS data were co-added for each observation before testing. All but one of the datasets were found to show no strong evidence for short-term variability, consistent with a constant count rate during each observation. The exception was observation 9557 for J140052.5-014510, which returned a null hypothesis probability of 0.001 for a constant count rate. We show the light curve for this observation in the upper panel of Fig. 4. In it, the count rate can be seen to drop by a factor of 2 and then rise back to its previous value within a matter of 6 hours. This implies that at least 50% of the X-ray emission from this source originates in a region that is no more than light-hours across, consistent with the central regions of an AGN.
We investigate the nature of this ’dip’ in the light curve further in the lower panel of Fig. 4, where we display the evolution of the hardness ratio during the count rate dip. To calculate this, we split the data into two bands, a 0.3 – 1.2 keV soft band () and a 1.2 – 10 keV hard band (), and derived light curves in both, on twice the binning of the original light curve to maintain good statistics. We then combined these into a hardness ratio as , with errors calculated as per Ciliegi et al. (1997). The figure shows that, other than a significant softening in one bin (between 10 and 15 ks into the observation), the hardness of the data remains roughly constant. This includes the period of the dip (roughly 20 - 40 ks) – although the data points suggest a slight hardening in this period, it is not statistically significant. This lack of strong spectral hardening implies that the dip is probably not originating in a simple increase in absorbing column, lasting for several hours. Instead, it might have one of two alternative origins; either it is an intrinsic fluctuation in the output of the compact region, or it is the result of a Compton-thick medium passing in front of the X-ray emission region and (at least) partially obscuring it.
4.3 Spectral Results
| Source/Obs ID | /dof | C-stat/% | EPIC-pn flux | ACIS flux | ||
|---|---|---|---|---|---|---|
| (1) | (2) | (3) | (4) | (5) | (6) | (7) |
| 2XMMp J082042.4+205715 | ||||||
| 0108860501 | 36.5/42 | |||||
| 7925 | 554.1/99 | |||||
| 0505930301 | 209/220 | |||||
| 2XMMp J123719.3+114915 | ||||||
| 0112840101 | 1180/69 | |||||
| 9558 | 343.8/50 | |||||
| 2XMMp J140052.5-014510 | ||||||
| 0200430901 | 25.1/24 | |||||
| 0505930101 | 168/169 | |||||
| 0505930401 | 111/97 | |||||
| 9557 | 105/85 |
Columns: (1) Source name, and observation ID for the spectral data. (2) Absorption column density intrinsic to the source ( cm-2). An additional foreground Galactic column (as per Table 1) is also applied and held fixed in the fit. (3) Power-law photon index. (4) value and number of degrees of freedom for the best fitting model. (5) C-statistic for best fitting model (in the cases where maximum likelihood fitting was used due to the low data quality), with the percentage of Monte-Carlo simulations with a value less than that obtained in the fit to the model. (6) & (7) Observed 0.3 – 10 keV band flux ( erg cm-2s-1).
The third diagnostic test we apply to the data is to analyse the X-ray spectrum of each dataset. Although AGN are now known to display very complex spectral phenomenology in the soft X-ray regime including warm absorbers (e.g. Blustin et al. 2005) and soft excesses (e.g. Gierliński & Done 2004), in the absence of high quality data their spectra are still commonly fitted with simple power-law models (e.g. in deep surveys, Alexander et al. 2005). Starburst regions also have complex spectra (see e.g. Pietsch et al. 2001; Read & Stevens 2002), but, in addition to a strong continuum, these are dominated by relatively narrow emission lines from hydrogen-like and helium-like charge states of the abundant low- elements that are present in the hot gas energised by the starburst processes, typically modelled with an optically thin, thermal spectrum with multiple temperature components (e.g., Moran et al. 1999; Jenkins et al. 2004; Warwick et al. 2007). Crucially, these components are detectable even in moderate quality XMM-Newton data (e.g. Franceschini et al. 2003; Jenkins et al. 2004), providing a test of whether the starburst dominates the X-ray emission.
The spectra were analysed using xspec version 11.3.2 (Arnaud 1996). For the XMM-Newton datasets we had three separate spectra for each observation of each source (one from the pn camera, and two from the MOS); these were analysed simultaneously, with a constant coefficient inserted to model calibration uncertainties between the detectors. The value of this coefficient was fixed to 1.0 for the pn, and allowed to vary in the fits to the MOS data. In practise, the value of this constant varied by no more than between detectors in the majority of observations.
As noted in section 3, most fits were performed using the standard xspec minimisation techniques. However, some of the data were so poor they did not meet the Gaussian criteria for fitting; consequentially we used the Cash statistics option in xspec to perform maximum likelihood fitting to these data. Cash statistics was only used on observations 7925, 9558, and 0112840101. We began by analysing the background spectrum for each source. For the Chandra data we constrained its form by fitting a simple power-law continuum model to it, using the Cash statistics option in xspec (i.e., ”cstat”). In the case of the XMM-Newton data in observation 0112840101, we examined only the pn data as the datasets were heavily background-dominated, and the MOS cameras only contributed 20 - 30 source counts each. The background data had sufficient statistics to use fitting, and required a broken power-law plus a narrow gaussian component to produce a good fit. The source data itself was then analysed, but not background subtracted. Instead, the results of the fit to the background spectrum were added as a fixed component to the spectral model, scaled appropriately for the relative aperture sizes. The model fitting was then performed using Cash statistics. The quality of the fit was evaluated using the ’goodness’ command, which we set to compare the obtained C-statistic value to 1000 Monte-Carlo simulations based on the best fitting model, and provides a percentage of simulated datasets with a C-statistic value lower than that obtained in the fit.
The spectral fitting was conducted using a very basic absorbed power-law continuum model. The precise combination of models utilised was TBABS*ZTBABS*ZPO in xspec syntax, where the TBABS component represents the foreground absorption column in our own Galaxy, the ZTBABS is the absorption column local to the X-ray source (and hence redshifted), and the ZPO is the redshifted power-law continuum. The foreground Galactic absorption was set to a fixed value, calculated using the NRAO dataset of Dickey & Lockman (1990) in the colden Galactic hydrogen column density calculator within the Chandra Proposal Planning Toolkit111111http://cxc.harvard.edu/toolkit/colden.jsp, and shown for each galaxy in Table 1. The redshifts were derived from SDSS data, and are also listed in Table 1. For both the Galactic and intrinsic absorption columns, the abundance levels are set as per Wilms, Allen and McCray (2000). We show the result of these fits in Table 5. The errors quoted in Table 5 are the 90% errors on the model parameters for one interesting parameter, and the 68% errors for the fluxes. As an example of the data quality, we show the four spectra from observations of J140052.5-014510 in Fig. 5.
All the fits provide statistically acceptable explanations of the data with a simple absorbed power-law model (null hypothesis probability ). The goodness criteria for both fits of J123719.3+114915 are also acceptable; however we note the Cash statistics fit to the 7925 data for J082042.4+205715 has a poor goodness (99% of simulated power-law datasets providing a better Cash statistic). However, the data for this model is too poor to attempt more complicated fits.
Table 5 shows that each of the sources displays a very distinct spectrum. J082042.4+205715 has a relatively hard slope, with , but has little intrinsic absorption with a column cm-2. J123719.3+114915 appears very hard with a power-law slope , although its absorption column appears inconsistent between the two observations. Finally, J140052.5-014510 has both a very low absorption column of cm-2, and the softest spectrum with, . Note that all the spectral fits in Table 5 are shown in chronological order (see Table 3 for observation dates).
Although the power-law models provide reasonable fits to the data, we examined whether there was any evidence for further spectral complexity by the addition of further components to the model. We only did this for the better datasets, i.e. those that allowed statistics to be used (all observations of J140052.5-014510, and the XMM-Newton observations of J082042.5+205715). Given that starburst spectra show strong collisionally-excited emission lines, we started by adding a MEKAL component (Mewe et al. 1985, Mewe et al. 1986, Kaastra, 1992) to each power-law model, setting each MEKAL component to the appropriate redshift and to solar abundance. In all cases, the improvements to the fits were minimal. By setting the MEKAL temperature to 0.6 keV (cf. Jenkins et al. 2004) and re-fitting for each dataset we were able to place an upper limit on the contribution of a starburst-like MEKAL component to each power-law dominated spectrum. In the case of J082042.5+205715 the 99% upper limit was no more than 5.5% of the total 0.3 - 10 keV flux, whereas for J140052.5-014510 the 99% upper limit was just under 9%. Hence a hot gas starburst component can only be present in the spectra of those two objects at a comparatively minor level.
A separate additional component that may be present in the data is a soft excess, as is found in many AGNs (e.g. Gierliński & Done 2004). We performed similar analyses to those for the addition of a MEKAL, and found no strong evidence for the presence of a soft excess in any dataset (maximum from the addition of a DISKBB model with two additional degrees of freedom).
A final test we performed on the data was to constrain the presence of a neutral Fe K line. A high ( keV) equivalent width 6.4 keV Fe K emission line is indicative of the presence of a Compton-thick obscuring torus, blocking the direct line-of-sight to an AGN (e.g. Awaki et al. 1991; Ghisellini, Haardt & Matt 1994). We therefore added a narrow 6.4 keV Gaussian component to the spectra (at the appropriate redshift) and calculated the 99% upper limits on the possible contribution of such a component to each spectrum. We tabulate the results in Table 6. Clearly, the data for J140052.5-014510 only rules out a keV equivalent width line in one dataset (9557), and even that still has a rather high equivalent width of eV allowed at the 99% limit. In contrast, the 0505930301 data for J082042.5+205715 places a very stringent 99% upper limit of 140 eV on any possible Fe K line contribution, clearly ruling out a high equivalent width line for this object.
| Observation ID | Equivalent width limit |
|---|---|
| (keV) | |
| 2XMMp J082042.5+205715 | |
| 0108860501 | 2.04 |
| 0505930301 | 0.14 |
| 2XMMp J140052.5-014510 | |
| 0200430901 | 12.96 |
| 0505930101 | 1.06 |
| 0505930401 | 4.85 |
| 9557 | 0.86 |


4.4 Long term and spectral variability
Our final set of diagnostics are taken from studying possible variations of both the X-ray flux and X-ray spectral shape between the different observation epochs, which are separated by gaps of months to years. Again, we would expect to see little variation from spatially extended X-ray emission regions composed of many components such as a starburst region, whereas AGN can vary both temporally and spectrally over such timescales (e.g. Taylor, Uttley & McHardy 2003; Sobolewska & Papadakis 2009).
Within the spectral data analysed above we do see evidence for spectral variability between different observation epochs. We illustrate this in Fig. 5 in which we present the four different spectra of J140052.5-014510 with residuals (pn only in the three XMM-Newton datasets, for the sake of clarity), and compare each spectrum to the model best fitting to the Obs ID 9557 Chandra data. Clearly the spectra in the top three panels deviate from the shape of the last spectrum, demonstrating some degree of variability in the data. We investigate whether this is due to strong variability in the underlying spectral shape in the top three panels of Fig. 6, where we compare the measured values of the photon indices between the different observations. It is clear that the best fitting values indicate that the spectrum of J140052.5-014510 does vary significantly, over periods as short as months. It is less clear whether this is the case for the other objects; their power-law photon indices are at least consistent at the 2 level (or better) over their observations.
The long-term luminosity variations are presented as the bottom three panels, where the luminosity is calculated from the fluxes in Table 5121212These are the observed 0.3 - 10 keV luminosities, not the rest frame values. However, we note that the similar, low redshifts of the three objects lead to relatively small corrections when converting to rest frame luminosities, with the increases of for the hard spectrum source J123719.3+114915, and for the other two objects.. All three objects clearly demonstrate significant luminosity variations over timescales of months, consistent with relatively compact objects.
5 Discussion
The basic question posed at the beginning of this work was: what can power more than erg s-1 of X-ray luminosity from a galaxy with no unambiguous signatures of AGN activity? We have examined this by selecting three galaxies at a redshift 0.1 from SDSS for further study at X-ray energies, based on the requisite high apparent X-ray luminosity and an optical spectrum betraying only signs of star formation processes. The work presented in the previous section details the results of several simple tests with the power to diagnose whether the X-ray emission originates in star formation processes, or an AGN.
We find that all three sources appear more consistent with AGNs than starbursts. Firstly, all are point-like in the X-ray images (cf. Fig. 3; Table 4), although this is not convincing evidence in isolation given that the physical size limits on any extended component are of the order kpc at the distance of the galaxies, permitting at least compact nuclear starburst emission to be present. Far more convincing evidence comes from the time variability characteristics of the X-ray emission, with flux variations of factors seen for all three objects (Fig. 6; Table 5) implying that at least 50% of the X-ray luminosity originates in a region no more than a few light-years across. In the specific case of J140052.5-014510, we see its flux halving and then returning to its original value in a period of 6 hours in the Chandra ACIS-S light curve, implying the X-ray emission originates from a solar system-sized object, which – for a luminosity around erg s-1 – has to be due to an AGN. Finally, the X-ray spectra of the three objects are all well-described by a power-law continuum, consistent with moderate quality AGN data and not the strong emission line-dominated spectra seen from starbursts. It should be noted that this spectral deconvolution implies dominance by an AGN-like component, but does not rule out a bright X-ray starburst. In fact, the 99% upper limits on the MEKAL thermal plasma contributions to each spectrum still allow for in the region of erg s-1 of starburst-heated gas in J082042.4+205715 (comparable to the thermal component seen in many ULIRGs, e.g. Franceschini et al. 2003), and up to erg s-1 in J140052.5-014510.
An interesting alternative to an AGN that could plausibly produce extreme X-ray luminosities without an AGN-like optical signature is a hyperluminous X-ray source (HLX, e.g. Gao et al. 2003), the brightest of the off-nuclear ultraluminous X-ray sources (ULXs, see Roberts et al. 2007; Feng & Soria 2011 for reviews). The most luminous of these objects, ESO 243-49 HLX-1, is as bright as erg s-1 in 0.3 – 10 keV X-rays at peak (Farrell et al. 2009; Servillat et al. 2011), and so if a similar object were located close to the nucleus of a moderate redshift galaxy it might indeed share the observational characteristics of the three objects in this work. However, such objects are rare compared to bona fide AGNs – only a handful of ULXs with are detected within 100 Mpc in the 2XMM-DR1 catalogue (Walton et al. 2011), far fewer in number than AGNs in a similar volume (e.g. Ho 2008), and with the exception of ESO 243-49 HLX-1 (which may itself be an accreted dwarf galaxy nucleus, e.g. Soria et al. 2010) they are far less luminous than galactic nuclei. We therefore do not regard this as a likely nature for any of our objects.
So if these objects are all AGN-dominated in the X-rays, can we say anything about the type of AGN from the X-ray data? Firstly, only one of the objects – J123719.3+114915 – appears hard ( 1.6) and perhaps relatively highly absorbed ( 1022 cm-2 during the observation 9558), consistent with a classic type 2 object, although the poor quality of this data should be noted. The other two objects have much lower columns, with both constrained at cm-2, more consistent with type-1 AGNs. This is supported when the data are sufficiently good to place constraints on the presence of a neutral Fe K line; in both cases high equivalent width ( keV) lines are ruled out, rejecting a strong reflection component originating in the torus of a type-2 AGN (e.g. Awaki et al. 1991). However, both have different spectral slopes, with J140052.5-014510 markedly softer than J082042.4+205715. While the slope of J082042.4+205715 ( 2) is fairly typical for type-1 AGNs (e.g. Nandra & Pounds 1994), the soft slope of J140052.5-014510 ( 2) is more unusual, and consistent with slopes seen in some narrow-line Seyfert 1 galaxies (NLS1s; Vaughan et al. 1999). However, there is no strong evidence of a distinct soft excess – as is seen in NLS1s – in either object. A piece of optical evidence indicating the possible presence of NLS1 activity is the line width of H emission. By definition, NLS1 galaxies emit H with line widths 2000 km s-1 (Wang & Zhang 2007). We found that the three sources emit H at widths considerably lower than this upper limit ( 300 km s-1). However, these line widths are also consistent with those of star forming galaxies.
So why is there no signature of AGN activity in these objects’ optical spectra? A number of reasons for this have been suggested in previous work focused on the nature of so-called ’elusive AGNs’, i.e., sources that show no signs of AGN activity in the optical regime, but display signs of AGN activity in the X-ray band. One possibility is that the regions within the galaxy producing narrow and broad line emission typically seen in AGNs have been rendered ’invisible’ by obscuration. For example, obscuration of AGN activity within NGC 4945 by a heavy dusty torus was deduced by Iwasawa et al (1993). Obscuration of the narrow line region may also be caused by spherical gas clouds shrouding the nuclei of galaxies, such as PKS 031208 (Comastri et al. 2002). However, obscuration is not necessarily caused by gas and dust close to the galactic nucleus. Rigby et al. (2006) reported that from a sample of 31 AGNs at redshifts of 0.5 0.8, only the most face-on galaxies displayed optical AGN activity. This implies that the obscuration of both the broad and narrow line regions may well be caused by host galaxy dust along our line of sight (e.g., Moran et al. 1996; Rigby et al. 2006; Goulding Alexander 2009). However, given that the X-ray spectral analysis of the three sources yielded hydrogen column density upper limit values 1021 cm-2, and that the calculated extinction values from the optical spectra for the galaxies are 1.11 mag Av 2.86 mag, obscuration is unlikely to be the cause for the elusiveness of optical AGN signatures in the sources.
Another possibility is that the broad line regions (BLRs) that should be signatures of AGN activity may not be seen because of low accretion rates. According to Nicastro et al. (2000), AGN BLRs may form in disc winds at a critical distance within the accretion disc. This formation occurs at an accretion rate 10-3 (). If the accretion rate is lower than this, the BLR cannot form. A recent study by Trump et al. (2011) deduced that the BLR of an AGN becomes invisible if the accretion rate drops below 10-2 . This is because at such low accretion rates, radiatively inefficient accretion flows (RIAFs, Yuan Narayan 2004) occur and expand close to the inner radius of the accretion disc. RIAFs lack the optical/UV emission of an optically thick accretion disc and therefore cannot ionise BLRs (Yuan Narayan 2004; Trump et al. 2011). In order for a source to have an accretion rate lower than 10-2 and to be displaying a luminosity of 1042 erg s-1, the mass of the accreting black holes would have to be 8 107 M☉. Using the M- relation (Gultekin. et al. 2009) with emission values from the SDSS DR7 archive, we estimated the masses of the black holes in the centre of the sources to be 5 108 M☉, 3 107 M☉, and 2 108 M☉ for J082042.4+205715, J123719.3+114915, and J140052.5-014511, respectively. Therefore, low levels of accretion activity is a possible explanation for the lack of the BLRs in two of the three galaxies’ nuclei.
One more possibility is that the AGN activity has been optically diluted by starlight, and indeed star formation signatures, within the host galaxy. Caccianiga et al (2007) found that from a sample of of 9 star forming optically elusive galaxies, all of their AGN signatures were diluted by galactic starlight. A similar result was seen in the study of optically elusive AGNs by Trump et al (2009). In this study, 70% of the 48 optically elusive AGN were diluted by galactic starlight. If we investigate the emission-line diagnostic diagrams shown in Fig. 1, we can see that all three sources’ flux ratios are positioned, in both cases, well below the Kewley et al. (2001) maximum starburst line (it is worth reiterating that the Transition region of the [NII]/H diagnostic diagram does contain the flux ratios of pure star forming galaxies). It is likely that star formation in the galaxies has strengthened the H and H emission fluxes, thus diminishing the [SII]/H, [NII]/H, and [OIII]/H values. If we remove the galactic star formation signatures, our objects would likely end up within the AGN area of the diagram. Thus, we conclude that the elusiveness of optical AGN signatures within our galaxies is most likely due to dilution by stellar activity.
Our results are similar to those of Jia et al. (2011), where they investigate X-ray, optical, and infra-red properties of 6 Lyman break analogue (LBA) galaxies with optical line ratios similar those of our sources. They deduced that a combination of intense star formation and AGN activity is likely present within the LBAs by studying their multi-wavelength properties. Unlike the work of Jia et al., we were able to deduce AGN presence by looking at X-ray data alone, due to the superior quality of our X-ray data. Nevertheless, both our results and those of Jia et al. agree on the presence of AGN activity and star formation within both galaxy samples.
6 Conclusion
Are galaxies that are both X-ray bright ( 1042 erg s-1) and display no clear optical signatures of AGN activity truly powered by star formation? Or are these sources powered by an optically-hidden AGN? In an attempt to answer these questions, we have investigated the X-ray properties of 3 sources that were taken from a cross correlation of the SDSS DR5 and 2XMMp DR0 catalogues, that have both no optical signatures of AGN activity, X-ray luminosities exceeding 1042 erg s-1, and, crucially, relatively good X-ray data (a few hundred to few thousands of counts). This investigation was performed using data from 9 observations of the three sources, taken using both XMM-Newton and Chandra .
To test for the presence of activity within these sources’ nuclei, we adopted 4 tests: point spread analysis, intra-observational variability analysis, spectral analysis, and long term spectral and timing variability analysis. Investigating the point spread function of the 3 sources indicates that the sources’ X-ray emission in not extended. The compact nature of the sources is also evident in the long-term photon count rate variability of the three sources. J140052.5-014511 displays short term count rate variability (during one Chandra observation), and long-term variability in its spectral shape, emphasising this source in particular must be very compact. All of this evidence points towards the three sources being X-ray powered by point-like objects.
The spectral analysis of the sources indicates the lack of star formation emission from the three sources in the X-ray band. All three sources’ spectra are well fitted with a simple absorbed power-law model. When fit with an absorbed power-law plus MEKAL component model, 90 of the sources’ flux is constrained to be derived from the power-law component. Note, however, that star formation may still be causing a very small proportion of X-ray emission within the nuclei of the galaxies.
The results yielded from the X-ray studies of the sources infers the presence of AGN activity within the galaxies’ nuclei. But why are these AGNs optically elusive? A number of possibilities have been suggested as to the cause of this optical elusiveness. The most likely cause for this elusiveness is that the AGNs are being optically diluted by stellar emission from within their host galaxies.
At the beginning of this study, we asked whether galaxies with X-ray luminosities 1042 erg s-1 and that display no signs of AGN activity in the optical band are truly powered by star formation, or are they powered by a hidden AGN. By studying the X-ray properties of three medium redshift objects that display these characteristics, we have discovered that such galaxies are indeed powered by AGN activity. Therefore, we have deduced that the common assumption that galaxies which display luminosities 1042 erg s-1 host AGNs appears to be safe.
Acknowledgements
This work is based on observations obtained with XMM-Newton, an ESA science
mission with instruments and contributions directly funded by ESA Member
States and the USA (NASA). This research has made use of software provided by the Chandra X-ray Center (CXC) in the application package CIAO. Funding for the SDSS and SDSS-II has been provided by the Alfred P. Sloan Foundation, the Participating Institutions, the National Science Foundation, the U.S. Department of Energy, the National Aeronautics and Space Administration, the Japanese Monbukagakusho, the Max Planck Society, and the Higher Education Funding Council for England. The SDSS Web Site is http://www.sdss.org/. The SDSS is managed by the Astrophysical Research Consortium for the Participating Institutions. This research has made use of the NASA/IPAC Extragalactic Database (NED) which is operated by the Jet Propulsion Laboratory, California Institute of Technology, under contract with the National Aeronautics and Space Administration. This research has made use of the SIMBAD database, operated at CDS, Strasbourg, France.
References
Alexander D. M., et al. 2003, AJ, 126, 539
Alexander D. M., Bauer F. E., Chapman S. C., Smail I., Blain A. W,. Brand, W. N., Iviso, R. J. 2005, ApJ, 632, 736
Arnaud K. A. 1996, Astronomical Data Analysis Software and Systems V, eds. Jacoby G. and Barnes J., p17, ASP Conf. Series volume 101
Awaki H., Koyama K., Inoue H., Halpern J. 1991, PASJ, 43, 195
Barger A. J., Cowie L. L., Brandt W. N., Capak P., Garmier G. P., Hornschemeier A. E., Steffan A. T., Wehner E. H. 2002, AJ, 124, 1839
Barger A. J. 2003, AIPC, 666, 205
Bauer F. E., et al. 2004, AdSpR, 34, 2555
Blustin A. J., Page M. J., Fuerst S. V., Branduardi-Raymont G., Ashton C. E. 2005, A&A, 431, 111
Brandt W. N. Hasinger G. 2005, ARAA, 43, 827
Bressan A., Silvia L., Granato G. L. 2002, AA, 392, 377
Caccianiga A., Severgnini P., Della Ceca R., Maccacaro T., Carrera F. J., Page M. 2007, AA, 470, 557
Cash W. 1979, ApJ, 228, 939
Ciliegi P., Elvis M., Wilkes B. J., Boyle B. J., McMahon R.G. 1997, MNRAS, 284, 401
Colless M., et al. 2001, MNRAS, 328, 1039
Comastri A., et al. 2002, ApJ, 571, 771
Dickey J. M., Lockman F. J. 1990, ARA&A, 28, 215
Eckart M. E., Stern D., Helfand D. J., Harrison F. A., Mao P. H., Yost S. H. 2006, ApJS, 165, 19
Elvis M., Civano F., Vignali C., et al. 2009, ApJS, 184, 158
Farrell S., Webb N. A., Barret D., Godet O., Rodriguies J. M. 2009, Natur, 460, 73
Feng H., Soria R. 2011, arXiv, 1109, 1610
Franceschini A., et al. 2003, MNRAS, 343, 1181
Gao Y., Wang D. Q., Appleton P. N., Lucas R. A. 2003, ApJ, 596, 171
Ghisellini G., Haardt F., Matt G. 1994, MNRAS, 267, 743
Giacconi R., et al. 2001, ApJ, 551, 624
Gierliński M. Done C. 2004, MNRAS, 349, 7
Goulding A. D., Alexander D. M. 2009, ASPC, 408, 59
Goulding A. D., Alexander D. M. 2009, MNRAS, 398, 1165
Gultekin K., et al. 2009, ApJ, 698, 198
Grimm H. -J., Gilfanov M., Sunyaev R. 2003, MNRAS, 339, 793
Hickox R. C., Markevitch M. 2006, ApJ, 645, 95
Ho L. C. 2008, ARAA, 46, 475
Hornschemeier et al. 2001, ApJ, 554, 742
Hornschemeier A. E., Heckman T. M., Ptak A. F., Tremonti C. A., Colbert E. J. M. 2005, AJ, 129, 86
Iwasawa K., Koyama K,. Awaki H., Kunieda H., Makishima K., Tsuru T., Ohashi T., Nakai N. 1993, ApJ, 409, 155
Jenkins L. P., Roberts T. P., Ward M. J., Zezas A. 2004, MNRAS, 352, 1335
Jia J., Ptak A., Heckamn T. M., Overzier R. A., Hornschemeier A., LaMassa S. M. 2011, ApJ, 731, 55
Kaastra J. S. 1992, An X-Ray Spectral Code for Optically Thin Plasmas (Internal SRON-Leiden Report, updated version 2.0)
Kauffmann G., et al. 2003, MNRAS, 346, 1055
Kewley L. J., Dopita M. A., Sutherland R. S., Heisler C. A., Trevema J. 2001, ApJ, 556, 121
Kim M., et al. 2007, ApJS, 169, 401
Lawrence A., Watson M. G., Pounds K. A., Elvis M. 1987, Nature, 325, 694
Lehmer B. D., et al. 2005, ApJS, 161, 21
Lehmer B. D., et al. 2008. ApJ, 681, 1163
Lira P., Ward M. J., Zezas A., Alonso-Herrero A., Ueno, S. 2002, MNRAS, 330, 259
Lumb D. H., Warwick R. S., Page M., De Luca A. 2002, AA, 398, 93
Maiolino R., et al. 2003, MNRAS, 344, 59
Markowitz A., et al. 2003, ApJ, 593, 96
Marconi A., Oliva E., van der Werf P. P., Maiolino R., Schreier E. J., Macchetto F., Moorwood A. F. M. 2000, AA, 357,24
Mewe R., Gronenschild E. H. B. M., van den Oord G. H. J. 1985, AAS, 62, 197
Mewe R., Lemen J. R., van den Oord G. H. J. 1986, AAS, 65, 551M
Moran E. C., Lehnert M. D., Helfand D. J, 1999, ApJ, 526, 649
Moran E. C., Halpern J. P., Helfand D.J. 1996, ApJS, 106, 341
Moran E. C., Filippenko A. V., Chornock R. 2002, ApJ, 579, 71
Moretti A., Campana S., Lazzati D., Tagliaferri G. 2003, ApJ, 588, 696
Mulchaey J. S., Davis D. S., Mushotzky R. F., Burstein D. 2003, ApJS, 145, 39
Mushotzky R. F., Cowie L. L., Barger A. J., Arnaud K. A. 2000, Nature, 404, 459
Nandra K., Pounds K.A. 1994, MNRAS, 268, 405
Nicastro F. 2000, ApJ, 530, 65
Pietsch W. N., et al. 2001, A&A, 365, 174
Ptak A., Heckman T., Levenson N. A., Weaver K., Strickland D. 2003, ApJ, 592, 782
Read A. M., Stevens I. R. 2002, MNRAS, 335, 36
Rigby J. R., Rieke G. H., Donley J. L., Alonso-Herrero A., Pérez-González P. G. 2006, ApJ, 645, 115
Roberts T. P. 2007, ApSS, 311, 203
Schlegel D. J., Finkbeiner D. P., Davis M. 1998, ApJ, 500, 525
Servillat M., Farrell S. A., Lin D., et al. 2011, arXiv, 1108, 4405
Silverman J. D,. et al. 2010, ApJS, 191, 124
Smith R., Vaughan S. 2007, MNRAS, 375, 1479
Sobolewska M. A., Papadakis I. E. 2009, MNRAS, 399, 1597
Soria R., Hau G. K., Graham A. W., et al. 2010, MNRAS, 405, 870
Szokoly G. P., et al. 2004, ApJS, 155, 271
Taylor R. D., Uttley P., McHardy I. M. 2003, MNRAS, 342, 31
Treister E., Urry M. C., Lira P. 2005, ApJ, 630, 104
Trouille M., Barger A. J., Cowie L. L., Yang Y., Mushotzky R. F. 2008, ApJS, 179, 1
Trump J. R. et al. 2009, ApJ. 706, 797
Trump J. R., et al. 2011, arXiv, 1103, 0276
Vaughan S., Reeves J., Warwick R., Edelson R. 1999, MNRAS, 309, 113
Walton D., Roberts T. P., Mateos S., Heard V. 2011, MNRAS, 416, 1844
Wang J–M., Zhang E–P. 2007, ApJ, 660, 1072
Warwick R. S., Jenkins L. P., Read A. M., Roberts T. P., Owen R. A. 2007, MNRAS, 376, 1611
Watson M. G., et al. 2009, AA, 493, 339
Wilms J., Allen A., McCray R. 2000, ApJ, 254, 914
Worsley M. A., Fabian A. C., Alexander D. M., Bauer F. E., Brandt W. N., Hasinger G., Lehmer B. D. 2005, AIPC, 801, 51
Xue Y. Q., et al. 2010, ApJ, 720, 368
Yuan F., Narayan R. 2004, 612, 724
Zezas A., Alonso-Herrero A., Ward M. 2001, ApSS, 276, 601