Suzaku study of centrally brightened supernova remnant G272.23.2
Abstract
In this work, the results from Suzaku observation of Galactic supernova remnant G272.23.2 are presented. Spectra of G272.23.2 are well fitted by a single-temperature variable abundances non-equilibrium ionization (VNEI) model with an electron temperature keV, ionization timescale s and absorbing column density cm-2. We have detected enhanced abundances of Si, S, Ca, Fe and Ni in the center region indicating that the X-ray emission has ejecta origin. We estimated the electron density to be 0.48 , age yr and the X-ray total mass M☉ by taking the distance to be d=10 kpc. To understand the origin of the centrally-peaked X-ray emission of the remnant, we studied radial variations of the electron temperature and surface brightness. The relative abundances in the center region suggest that G272.23.2 is the result of a Type Ia supernova explosion.
keywords:
ISM: supernova remnantsISM:individual G272.23.2X-rays:ISM1 Introduction
The Galactic supernova remnant (SNR) G272.23.2 was discovered in X-rays with ROSAT All-Sky Survey (Greiner & Egger, 1993), it has centrally filled X-ray morphology and a thermally dominated X-ray spectrum. Greiner, Egger & Aschenbach (1994) found that the electron temperature was between 1.01.5 keV from the ROSAT PSPC data. Winkler, Hanson & Phillips (1993) confirmed that the nature of the emission was shock-heated and the nebulosity was an SNR by measuring the [S ii]/H ratio and detecting emissions from [N ii] 658.3 nm and [O ii] 732.5 nm in the optical band. Duncan et al. (1997) carried out a series of radio observations with a Parkes radio telescope, an Australia Telescope Compact Array (ATCA) and a Molonglo Observatory Synthesis Telescope (MOST). From these observations they show that the radio spectral index of this remnant was typical of shell-type SNRs, , and almost circular in appearance with a diameter of 15 arcmin. The remnant consists of faint filaments and patches of emission with a low surface brightness as well as bright blobs that correlate well with the brightest optical filaments and of a diffuse emission component produced by shock-accelerated electrons. Harrus et al. (2001) found that the X-ray emission from G272.23.2 could be best described by a non-equilibrium ionization (NEI) model with an electron temperature of about 0.7 keV, an ionization timescale of 3200 cm-3 yr and a relatively high column density, atoms-2, from ASCA and ROSAT observations. They discussed cloud evaporation and thermal conduction models to explain the centrally peaked X-ray morphology of the remnant. Later, from an X-ray study of G272.23.2 with Chandra, Park et al. (2009) reported that the X-ray spectra of the outer shell regions showed normal compositions being consistent with the shocked interstellar medium, while central emission showed elevated abundances suggesting reverse shocked stellar ejecta from Type Ia supernova (SN). Lopez et al. (2011), based on Chandra’s observation, confirmed that G272.23.2 is a Type Ia origin.
The distance to G272.23.2 is not well known. It was estimated to be kpc from observed interstellar absorption by Greiner, Egger & Aschenbach (1994). From the statistical analysis, Harrus et al. (2001) calculated 2 kpc, which is in agreement with the distance found by Greiner, Egger & Aschenbach (1994). They also obtained an upper limit of 10 kpc using optical color excess with a distance of roughly 0.2 mag kpc-1 in the direction of G272.23.2 and adopted intermediate distance of 5 kpc to this remnant.
In this study, we investigate the nature of X-ray emission of G272.23.2 which is characterized by an apparent centrally brightened X-ray morphology and thermally dominated X-ray emission by utilizing the superior spectral capabilities for diffuse sources of X-ray Imaging Spectrometers (XIS: Koyama et al. (2007)) onboard Suzaku satellite (Mitsuda et al., 2007). The structure of the paper is as follows; in Section 2, we describe the Suzaku observation and data reduction. Image and spectral analysis are presented in Section 3 and 4, respectively. In Section 5, we discuss the physical properties of the thermal X-ray emitting plasma (5.1), possible reasons of centrally peaked morphology (5.2) and finally, relative abundances in the ejecta (5.3).
2 Observation and Data reduction
Suzaku observed G272.23.2 on 2011 May 28 by the XIS. The observation ID and exposure time are 506060010 and 130 ksec, respectively. The XIS has four CCDs: three of them (XIS0, 2, and 3) are front-illuminated (FI) and one (XIS1) is back-illuminated (BI). The XISs are sensitive to the 0.212.0 keV energy band with a 17.817.8 arcmin2 field of view (FOV). In November of 2006, XIS2 was damaged and taken off-line, therefore data taken after the 2007 observation were taken with only the remaining three XISs. The XIS was operated in the normal full-frame clocking mode. Two corners of each XIS CCD have an 55Fe calibration source which can be used to calibrate the gain and test the spectral resolution of data taken using this instrument.
Reduction and analysis of the data were performed by following the standard procedure using the headas v6.4 software package, and spectral fitting was performed with xspec v.11.3.2 (Arnaud 1996). All of the data were reprocessed, referring to the CALDB as of July 9, 2008. The redistribution matrix files (RMFs) of the XIS were produced by xisrmfgen, and auxillary response files (ARFs) by xissimarfgen (Ishisaki et al., 2007).
3 Image Analysis
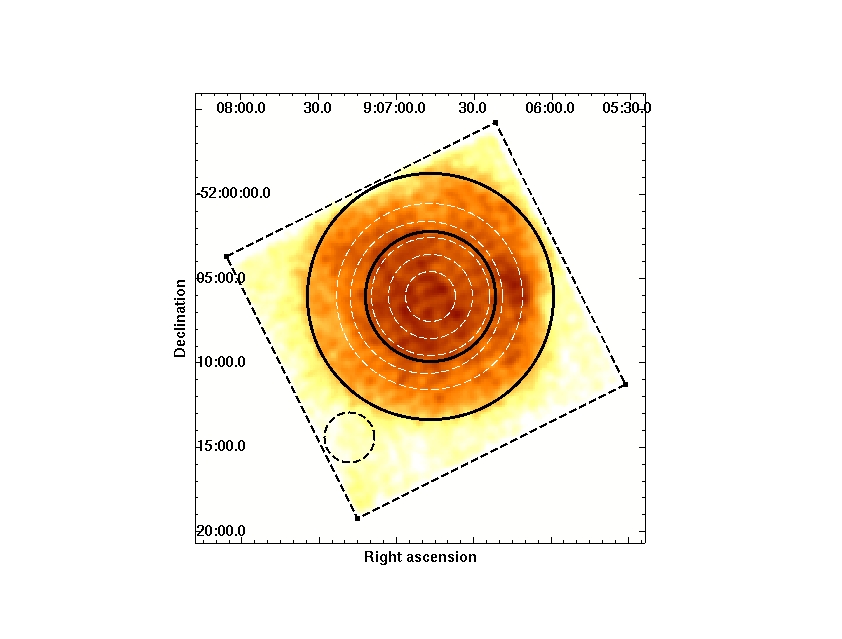
Fig. 1 shows an XIS1 image of G272.23.2 in the 0.310 keV energy band. From this figure, we see brighter emission in the central region (within 3.8 arcmin radius) and a relatively fainter emission in the outer part. Central and outer regions are shown by solid black circles centered at , . Dashed white circles with sizes of 01.5, 1.52.5, 2.53.5, 3.54.5, 4.55.5 arcmin are chosen to obtain the radial variations of the electron temperature and surface brightness. The black dashed circle with a radius of 1.5 arcmin represents the background region, , , used for spectral analysis. The black dashed square indicates the FOV of the XIS1.
4 Spectral Analysis
The spectrum is extracted first from all over the remnant (hereafter whole region) with a radius of 7.3 arcmin, then from the central region with the brightest X-rays and finally from the outer region where the X-rays are fainter, this is indicated by solid black circles (see Fig.1) for each of the XISs. The spectra are grouped with a minimum of 120 counts bin-1 for the whole region and 50 counts bin-1 for the central and outer regions.
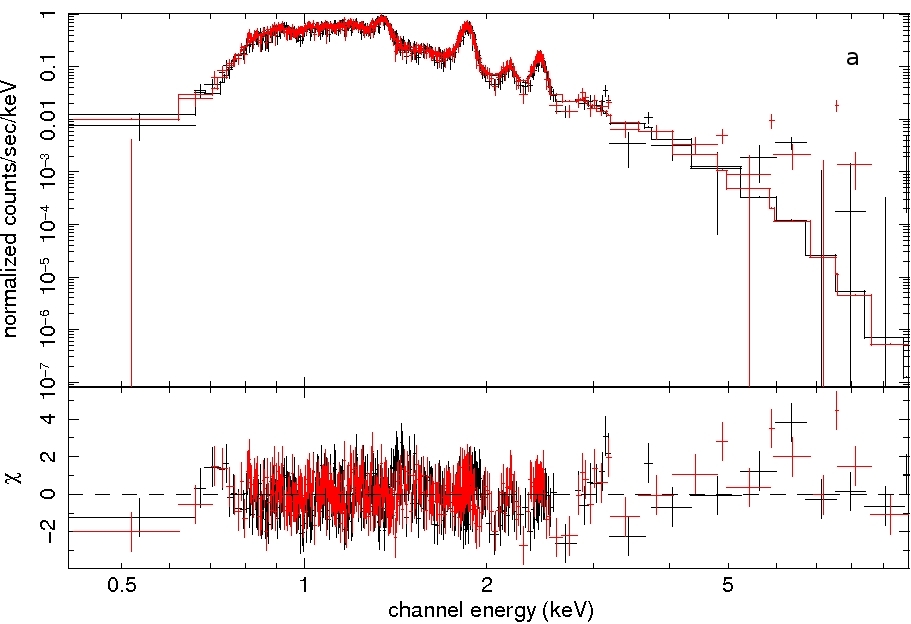
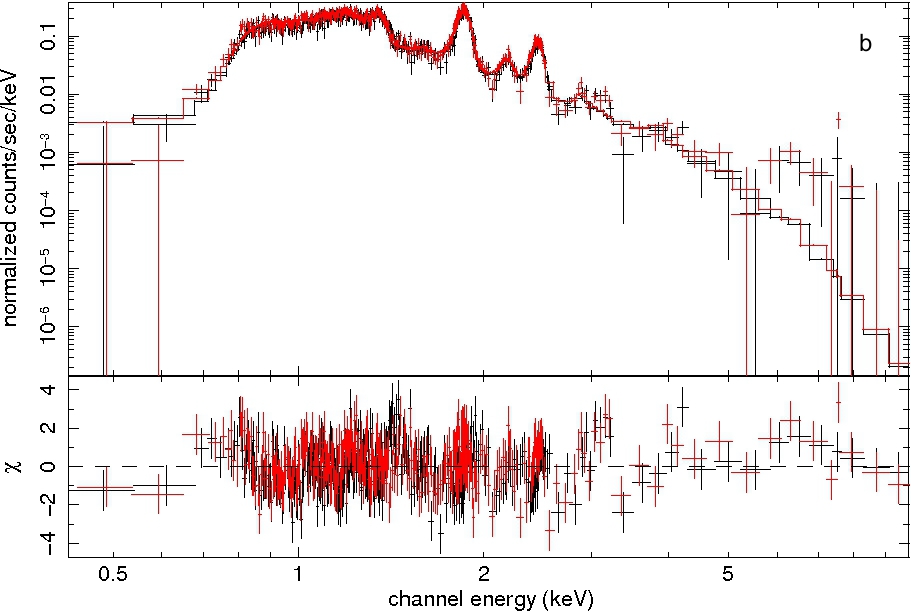
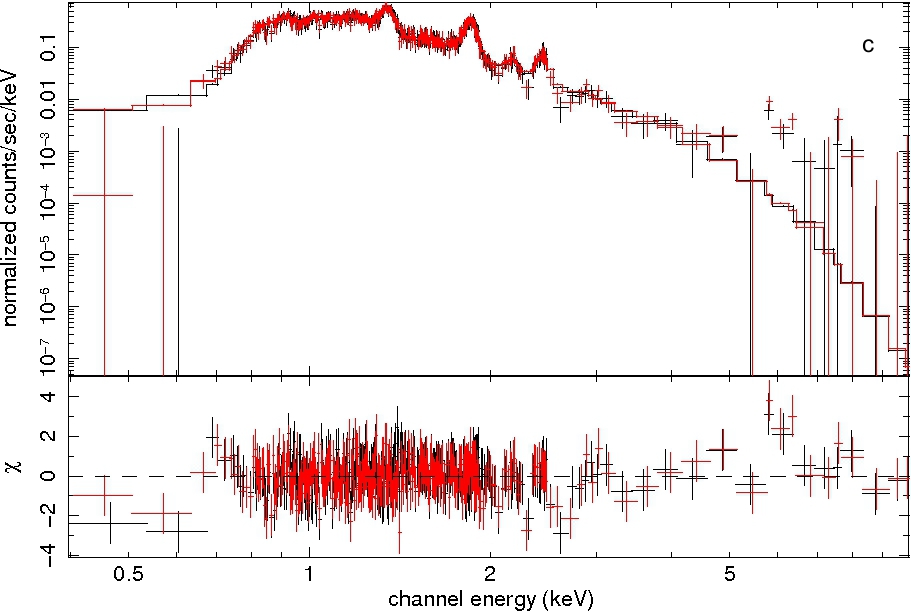
For the whole region, we applied the VNEI model, a model in xspec for a NEI collisional plasma with variable abundances (Borkowski, Lyerly & Reynolds, 2001), modified by interstellar absorption using cross sections from Morrison & McCammon (1983) in the 0.310 keV energy range. The absorption column density , electron temperature , ionization timescale , where is the electron density and is the elapsed time after the plasma was heated up, and normalization were set as free parameters and all elemental abundances were fixed to their solar values of Anders & Grevesse (1989). From this fit we obtained a reduced of 1.81 for 752 degrees of freedom (dof). Then, we allowed O, Ne, Mg, Si, S and Fe abundances to vary, since these abundances have appeared to differ from their solar values and the line features were evident in the spectra, while other elemental abundances were frozen to their solar values. In this case, the spectral fit has significantly improved with reduced of 1.02 for 746 dof. We repeated the same steps for the central and outer regions. The parameter values obtained for each region are listed in Table 1, and the errors quoted are 90 per cent confidence limits. The background-subtracted FI XIS (XIS0 and XIS3) spectra of each region in 0.310 keV are shown in Fig. 2.
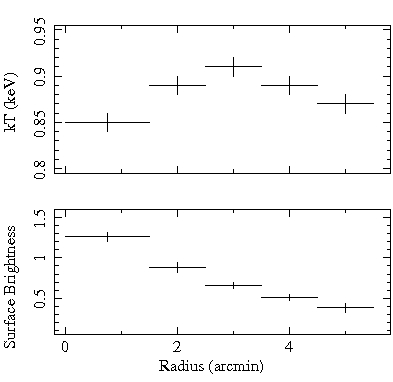
Radial variations of the electron temperature and surface brightness are plotted in Fig. 3. During spectral fittings, to get an estimate of possible temperature variation across the SNR, we fixed the absorbing column density and the ionization timescale to the values of the whole region.
| Parameters | Whole | Centre | Outer | |
|---|---|---|---|---|
| ( | 1.07 | 1.14 | 0.96 | |
| (keV) | 0.77 | 0.83 | 0.76 | |
| O (solar) | 1.4 | (1) | 0.6 | |
| Ne (solar) | 0.6 | 0.2 | 0.4 | |
| Mg (solar) | 0.7 | 0.7 | 0.6 | |
| Si (solar) | 1.3 | 2.0 | 0.8 | |
| S (solar) | 2.2 | 4.0 | 1.2 | |
| Ca (solar) | (1) | 1.8 | (1) | |
| Fe (solar) | 1.3 | 1.96 | 0.8 | |
| Ni (solar) | (1) | 3.9 | (1) | |
| ( | 6.5 | 5.3 | 6.2 | |
| normalization | 0.19 | 0.17 | 0.16 | |
| Flux111 Flux corrected for Galactic absorption in the keV energy band in the unit of erg . | 6.8 | 7.7 | 4.3 | |
| /dof | 760.7/746=1.02 | 917.2/686=1.34 | 733.7/945=0.78 |
5 Discussion and Conclusions
In this paper, we report the results of high quality X-ray spectra and detailed analysis of G272.23.2 using Suzaku XIS observation. The X-ray spectra can be represented with a non-equilibrium ionization plasma (VNEI) model with an electron temperature of keV, high absorbing column density and a relatively small ionization timescale, less than s. We found clear K-shell lines of O, Ne, Mg, Si, S, Ca, Fe and Ni in the 0.310 keV band spectra, as shown in Fig. 2. The central region is enhanced in Si, S, Ca, Fe and Ni, as shown in Table 1. This fact suggests that the X-ray emission originating from this region results from the ejecta. The abundances of the outer region are consistent with solar values indicating that the X-ray emission is produced by swept-up interstellar matter (ISM). The abundances obtained from the spectra of the whole region show that the X-ray emission results from a mixture of the ejecta and ISM. This remnant shows a centrally peaked X-ray emission and extends to a radius of 7.3 arcmin as seen in the XIS1 image (see Fig. 1). We will discus the possible reasons for the centrally peaked emission in subsection 5.2.
5.1 Thermal emission
From the thermal X-ray spectra of G272.23.2, we found a high absorbing column density of that is in agrement with the value obtained by Harrus et al. (2001) with ROSAT spectral fits and with the Galactic H i column density in that direction, (Dickey & Lockman, 1990). During the analysis we let vary for whole, center and outer parts to see if there is a significant variation all over the remnant. We found that the value obtained for these three regions are similar, indicating that there is not a significant density gradient across the remnant. One reason for the high value might be that the remnant’s distance is large or there could be molecular material or dust along the line of sight in that direction, or both. However, in literature no such material has been reported yet in that direction or in the vicinity of the remnant. Considering these cases, we will use the upper limit distance value, d=10 kpc, given by Harrus et al. (2001) throughout our calculations.
The XIS spectra suggest an ionization time scale of s. For the full ionization equilibrium, the ionization timescale, =, is required to be s (, 1984). The value that we obtained for G272.23.2 shows that the plasma is far from the full ionization equilibrium. We estimated the X-ray emitting plasma volume of the remnant to be , where is the volume filling factor of the emitting gas within the SNR, we assumed the emitting region to be a full sphere of radius 7.3 arcmin which is our XIS spectral extraction region. Based on the emission measure determined by the spectral fitting, where and are number densities of electrons and protons respectively, and V is the X-ray emitting volume, and assuming , we calculated the electron density of the plasma to be 0.48 . The age of G272.23.2 calculated to be yr from t=/. The mass of the X-ray emitting plasma of G272.23.2 estimated to be M☉ from equation , where is the mass of a hydrogen atom.
5.2 Radial profile
Centrally peaked X-ray morphology of G272.23.2 can be explained by two models cloud evaporation (, 1991) and thermal conduction (Cox et al., 1999). We first consider the cloud evaporation model of (1991). According to this model, the SNR blast wave passes over the cold clouds keeping them in the hot postshock gas. X-ray emission arises from the gas evaporated from these shocked clouds. Second, we consider the radiative model of Cox et al. (1999) also named as the “fossil” conduction model. According to this model the hot plasma in the interiors of the remnant gradually becomes uniform by thermal conduction and detectable as centrally brightened in X-ray.
We studied radial variations of the electron temperature and surface brightness profiles (see Fig. 3) to compare with these two models. We see that there is no strong radial temperature variation (0.06 keV) and it is consistent with the predictions of both evaporation and thermal conduction models. Observed surface brightness variation which peaks at the center (1.26 erg ) and declines towards outer region (0.38 erg ) is consistent with the evaporation model. However, in the vicinity of this remnant no molecular clouds or density gradient of medium has been reported yet. This case is inconsistent with the predictions of both models. The young age ( yr) of the remnant, in other words the NEI condition of the plasma can not be explained by the thermal conduction model which requires collisional ionization equilibrium condition of the plasma. Therefore, considering all these, the centrally peaked X-ray emission of this remnant may be explained with the cloud evaporation model.
5.3 Relative abundances in the ejecta
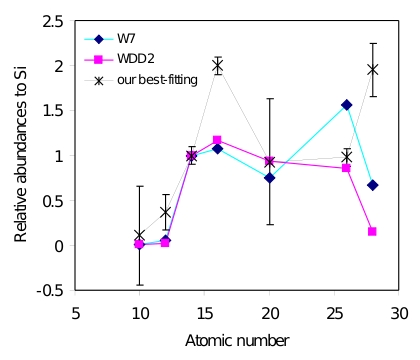
Type Ia SN produces very small quantities of low-Z elements such as Ne and Mg, and larger amounts of Si-group elements such as S and Ca, and overabundant Fe and Ni as in our case with G272.23.2. Therefore, we compare our best-fitting relative abundances with the predicted nucleosynthesis yield of the widely-used W7 and a delayed detonation (WDD2) Type Ia SN models (Nomoto et al., 1997) as given in Fig. 4.
Although the abundances of Ne, Mg and Ca relative to Si are almost consistent with both models, S and Ni relative to Si are higher than the values that both models predict. The value of Fe relative to Si is consistent with the WDD2 model, while it is much lower than the value of W7 model predicts. The reason for the low value of Fe might be that the entire Fe-rich core has not yet been shocked, as is the case in SN 1006 (Yamaguchi et al., 2008), Tycho (Tamagawa et al., 2009) and G337.2-0.7 (Rakowski, Hughes & Slane, 2001). Our results confirm that G272.23.2 has a Type Ia SN origin.
Acknowledgments
AS is supported by the TÜBİTAK PostDoctoral Fellowship. This work is supported by the Akdeniz University Scientific Research Project Management.
References
- Anders & Grevesse (1989) Anders E., Grevesse N., 1989, Geochimica Cosmochimica Acta, 53, 197
- Arnaud (1996) Arnaud K. A., 1996, in Jacoby G., Barnes J., eds, ASP Conf. Ser. Vol.101, Astronomical Data Analysis Software and Systems V. Astron.Soc. Pac., San Francisco, p. 17
- Borkowski, Lyerly & Reynolds (2001) Borkowski K. J., Lyerly W. J., Reynolds S. P., 2001, ApJ, 548, 820
- Cox et al. (1999) Cox D. P., Shelton R. L., Maciejewski W., Smith R. K., Plewa T., Pawl A., Róẏyczka M., 1999, ApJ, 524, 179
- Dickey & Lockman (1990) Dickey J.M., Lockman F. J., 1990, ARA&A, 28, 215
- Duncan et al. (1997) Duncan A. R., Primas F., Rebull L. M., Boesgaard A. M., Deliyannis C. P., Hobbs L. M., King J. R., Ryan S. G., 1997, MNRAS, 289, 97
- Greiner & Egger (1993) Greiner J., Egger R., 1993, IAU Circ. 5709
- Greiner, Egger & Aschenbach (1994) Greiner J., Egger R., Aschenbach B., 1994, A&A, 286, L35
- Harrus et al. (2001) Harrus I. M., Slane P. O., Smith R. K., Hughes J. P., 2001, ApJ, 552, 614
- Ishisaki et al. (2007) Ishisaki Y. et al., 2007, PASJ, 59, 113
- Koyama et al. (2007) Koyama K. et al., 2007, PASJ, 59, 23
- Lopez et al. (2011) Lopez L. A., Ramirez-Ruiz E., Huppenkothen D., Badenes C., Pooley D.A., 2011, ApJ, 732, 114
- (13) Masai K., 1984, Ap&SS, 98, 367
- Mitsuda et al. (2007) Mitsuda K. et al., 2007, PASJ, 59, 1
- Morrison & McCammon (1983) Morrison R., McCammon D., 1983, ApJ, 270, 119
- Nomoto et al. (1997) Nomoto K., Iwamoto K., Nakasato N., Thielemann F.-K., Brachwitz F., Tsujimoto T., Kubo Y., Kishimoto N., 1997, Nuclear Physics A, 621, 467
- Park et al. (2009) Park S., Lee J., Hughes J.P., Slane P.O., Burrows D.N., Mori K., Garmire G.P., 2009, American Astronomical Society, 41, 695
- Rakowski, Hughes & Slane (2001) Rakowski C. E., Hughes J. P., Slane P., 2001, ApJ, 548, 258
- Tamagawa et al. (2009) Tamagawa T. et al., 2009, PASJ, 61, 167
- (20) White R. L., Long K. S., 1991, ApJ, 373, 543
- Winkler, Hanson & Phillips (1993) Winkler P. F., Hanson G. J., Phillips M.M., 1993, IAU Circ. 5715
- Yamaguchi et al. (2008) Yamaguchi H. et al., 2008, PASJ, 60, 141