Casimir force measurements in Au-Au and Au-Si cavities at low temperature
Abstract
We report on measurements of the Casimir force in a sphere-plane geometry using a cryogenic force microscope to move the force probe in situ over different materials. We show how the electrostatic environment of the interacting surfaces plays an important role in weak force measurements and can overcome the Casimir force at large distance. After minimizing these parasitic forces, we measure the Casimir force between a gold-coated sphere and either a gold-coated or a heavily doped silicon surface in the 100–400 nm distance range. We compare the experimental data with theoretical predictions and discuss the consequence of a systematic error in the scanner calibration on the agreement between experiment and theory. The relative force over the two surfaces compares favorably with theory at short distance, showing that this Casimir force experiment is sensitive to the dielectric properties of the interacting surfaces.
pacs:
07.10.Pz, 12.20.Fv, 73.40.Cg, 78.20.CiI Introduction
Nanoelectromechanical systems (NEMS) are used in a broadening range of applications, such as actuators, sensors, resonators, or modern nanocharacterization tools. Size reduction not only allows for shrinking the energy consumption and for shortening the response time, but it also allows integrating a broader range of functionalities on a single chip. ekinci-2005 However, quantum physics comes into play at the nanoscale and can affect NEMS behavior. schwab-2005 Understanding these effects, and possibly controlling them, is a necessary prerequisite to optimize NEMS design. In turn, new applications driven by quantum effects can emerge, in particular in the field of ultra-high-sensitivity force or displacement detection.
The Casimir force, discovered in 1948, is the archetypical force in this framework. casimir-1948 Its purely quantum origin results from the zero-point fluctuations in the electromagnetic field. Since its theoretical prediction, the Casimir force has attracted the interest of a large community of scientists ranging from cosmologists antoniadis-2011 to NEMS designers lin-2005 through solid-state physicists. Experimentally, the first confirmation sparnaay-1958 of the Casimir effect was reported as early as 1958, but the first quantitative study lamoreaux-1997 of the Casimir force using a torsion pendulum was reported not before 1997. Soon after, an important activity has been triggered thanks to the use of atomic force microscopes (AFM) mohideen-1998 or microelectromechanical systems (MEMS). chan-2001 ; decca-2003 Most of the experiments have been carried out with a cavity in the sphere-plane geometry and very few in the plane-plane geometry bressi-2002 ; antonini-2006 that requires highly parallel surfaces.
The limited number of groups working on Casimir force measurements confirms how difficult these experiments are. ball-2007 This is explained by the small magnitude of this force as compared to the electrostatic force, and by the stronger distance dependence scaling like the inverse of the fourth (third) power of the distance in plane-plane (sphere-plane) geometry. In order to check the validity of theories describing fundamental forces, the precision of the experiments has been continuously improved, using metallic or semiconductor materials like Au-Au, lamoreaux-1997 ; chan-2001 ; decca-2005 ; decca-2007 ; kim-2008 ; vanzwol-2008 ; jourdan-2009 ; sushkov-2011 Al-Al, mohideen-1998 ; antonini-2006 Cr-Cr, bressi-2002 Au-Cu, decca-2003 Au-Ge, decca-2005b Au-Si, chen-2005 ; chen-2006 ; chen-2006b Au-Si grating, chan-2008 Ge-Ge, kim-2009 and Au-indium tin oxide. deman-2009 In parallel, the influences of layer thickness, lambrecht-2000 ; genet-2003 surface roughness, palasantzas-2005 grating structure, lambrecht-2008 and material conductivity duraffourg-2006 ; lambrecht-2007 ; dalvit-2008 have been studied theoretically to provide models for comparison or stimulate new experiments.
In this paper, we report on a detailed study of the Casimir force between a gold-coated sphere and a doped silicon substrate at liquid helium temperature (4.2 K) and compare it in situ with the case of a gold-coated surface. The use of the sphere-plane geometry avoids the challenge of controlling with high accuracy the parallelism of two flat surfaces separated by a submicron gap. Our aim is to reveal the dependence of the force on the materials properties and to compare it quantitatively with theory. Thermalization at low temperature provides an exceptional mechanical stability of the interacting surfaces, which is highly beneficial for long-term force measurements. In principle, it should also improve the force sensitivity because of a reduced Brownian motion of the cantilever, but other effects, such as optomechanical couplings, degrade the expected increase in sensitivity in our experiment. Cooling down the experiment decca-2010 also suppresses the thermal contribution of the Casimir force, genet-2000 allowing a direct comparison with the zero-temperature theoretical calculations.
After a complete description of our calibration procedure, we show that parasitic forces can perturb significantly the Casimir force measurements and that the setup environment can be modified to suppress this artifact. We then discuss the variations of the minimizing potential with distance by considering first the patch potential effect, speake-2003 and then a simple electrostatic model hadjadj-2002 that reproduces the data. Finally, we present relative measurements of the Casimir force in the 100–400 nm distance range obtained by changing in situ the sample surface from gold to silicon. The relative force between the two materials is in qualitative agreement with theory, but the absolute values of the force show a systematic error with respect to the theoretical predictions that are tentatively attributed to an aging of the scanner calibration.
The paper is organized as follows. Section II describes the homemade low-temperature force microscope. Section III explains the force measurements and data analysis. Section IV discusses the origin and suppression of a long-range residual force due to the electrostatic environment. Section V presents the results on the minimizing potential and Casimir force obtained for gold and silicon surfaces. Conclusions are drawn in Section VI.
II Low-temperature force microscope
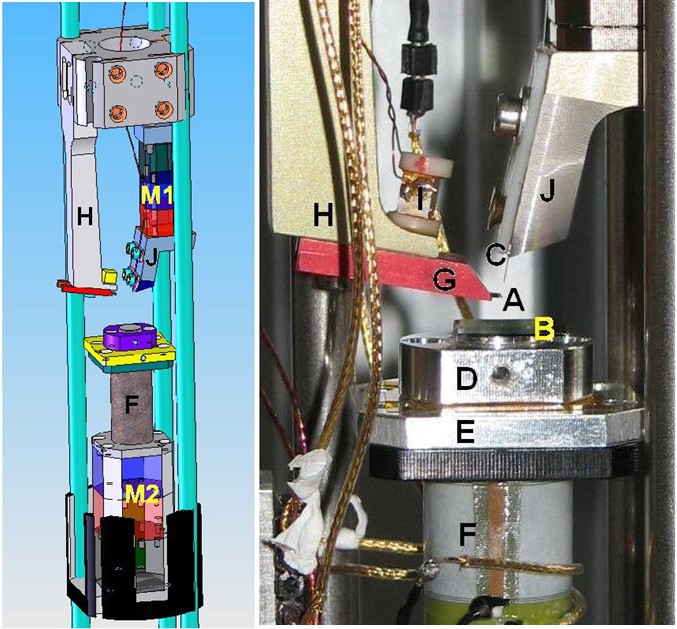
We developed a new force microscope working in a cryogenic environment at 4.2 K, as an evolution of the room-temperature instrument developed by Jourdan et al. jourdan-2009 The structure of the low-temperature instrument takes the shape of a 50-mm-diameter and 120-cm-long modular system based on a tubular cage. brun-2001 This cage structure links the top of the instrument (that bears all the electrical and optical connections) to the microscope head located at the very bottom. The main parts of the microscope (marked by capital letters in Fig. 1) are described below.
The force probe is based on an AFM cantilever with a 40-m-diameter polystyrene sphere fixed at the extremity with standard epoxy glue (A). The sphere and cantilever are coated with gold (more than 200 nm on the sphere side and 80 nm on the backside) to provide an electric contact to the sphere, which is one of the Casimir mirror. The root-mean-square roughness of the gold surfaces is around 3 nm, as measured by AFM. The probes have typically a resonance frequency about 40 kHz and a spring constant about 10 N/m. The cantilever chip is glued with silver paint on a holder (G) made of anodized aluminum and then fixed on a long holder (H). The cantilever is mechanically excited at resonance by a piezoelectric dither (I). The sample (B) is mounted with silver paint on a holder (D) that is separated from the piezoelectric -scanner (F) by a grounded aluminum plate (E) for electrostatic screening of the high voltages applied to the scanner. The cantilever motion is measured with a compact optical detection compatible with the severe space constraints of cryogenics, rugar-1989 using the interferometric cavity formed by the flexible cantilever and the extremity of a single-mode optical fiber (C) anchored to the holder (J). The fiber is positioned above the end of the lever with a set of XYZ cryogenic inertial motors (M1) and adjusted such as to obtain an interferometric cavity with good displacement sensitivity. The sample is approached below the force probe with another set of motors (M2) and the scanner (F) is used to finely tune the gap between the two surfaces. The scanner has been calibrated by interferometry and the hysteresis has been determined for defined scanner extensions. It could be, however, that this calibration slightly evolves in time after successive thermal cycles as discussed later in the analysis of the results.
The microscope and the entire cage structure are sealed into a 2-in.-diameter stainless steel tube evacuated to a secondary vacuum and flushed with helium gas. The tube is then filled with a low pressure of helium exchange gas (10 mbar at room temperature) and immersed in a liquid helium cryostat. During cooling down, it is necessary to continuously readjust the optical cavity with the M1 motors to compensate for thermal contractions.
Measurements at low temperature have the advantage to benefit from strongly reduced thermal drifts and thermomechanical noises that usually limit the room-temperature experiments. For instance, position drifts of about 1 nm/min at 300 K are found to be reduced to less than 1 nm/h at 4 K. This is of particular importance in the present study because the Casimir force strongly depends on distance. In the same way, the frequency drift of the cantilever resonance is strongly suppressed from 3 mHz/min at 300 K down to a negligible value at 4 K. Finally, another advantage of cryogenic temperature is to strongly suppress the cantilever Brownian motion induced by thermomechanical force fluctuations.
In such cryogenic conditions, the force detection sensitivity is essentially limited by the optical readout of the cantilever position. The intensity fluctuations of the laser beam are here the main source of noise, well above the noise of the photodiode and its amplifier. In particular, optomechanical couplings like radiation pressure and photothermal stress convert this intensity noise into cantilever displacement noise, called backaction noise. As a consequence, the low-temperature force sensitivity is found to be of the same order as the room-temperature sensitivity . This situation could be improved by a broadband stabilization of the laser beam intensity or by the coherent coupling of laser noise and backaction noise, as demonstrated recently in our interferometric setup. laurent-2011 Therefore the only, but very rewarding, advantage of the low temperature turns out to be the exceptional mechanical stability of the microscope.
These retarded optomechanical forces also modify the resonance frequency and damping rate of the microlever through an optical spring effect induced by the interferometric process. braginsky-1970 ; braginsky-2002 ; favero-2009 Depending on the optical cavity detuning, this effect can induce self-oscillations dorsel-1983 ; vogel-2003 or provide self-cooling of the thermal noise. metzger-2004 ; arcizet-2006 ; gigan-2006 The detection conditions have thus been optimized by choosing the cooling side of the detuning and by adjusting the laser power.
III Data acquisition and calibration
Instead of measuring directly the electrostatic or Casimir force in static mode, we measure its force gradient in dynamic mode, which is given by the frequency shift of the cantilever resonance. The lever is excited with a piezoelectric dither at its mechanical resonance and the lever vibration is measured by interferometry with the optical fiber. The oscillation amplitude and phase are recorded with a lock-in and a phase-locked loop tracks the resonance frequency when the probe is submitted to a force gradient. The resonance frequency shift is defined by , where is the free resonance frequency.
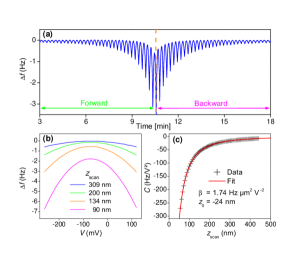
Since the zero sphere-plane distance cannot be determined by bringing the sample into contact with the sphere, which would irreversibly damage the gold coating of the surfaces, the absolute distance is determined by electrostatic calibration. During a sequence of force measurements, the sample is approached to the sphere by small steps, and for each scanner position , the resonance frequency shift is measured for different bias voltages applied to the sample with respect to the grounded sphere [Fig. 2(a)]. The voltage is varied typically over mV around the potential , which minimizes the electrostatic force between the probe and sample. We obtain a series of curves [Fig. 2(b)], which are fitted by the second-order polynomial:
| (1) |
where , , and are three adjustable parameters. The first term on the right-hand side corresponds to the capacitive force, and the second term is the frequency shift due to the remaining forces, including the Casimir force, obtained for at the summit of the parabola. The curvature coefficient is plotted as a function of the scanner position and fitted with
| (2) |
to obtain the sphere-sample contact position and the force probe calibration parameter [Fig. 2(c)]. The absolute distance between sphere and sample is then given by . We have additionally checked that the cantilever static deflection generated by the electrostatic force and the Casimir force is negligible in the studied separation range. footnote
The theoretical expression of the sphere-plane capacitive force gradient gives , where is the free resonance frequency, the sphere radius, the vacuum permittivity, and the cantilever stiffness. The experimental value of extracted from the fit can therefore be used to transform the measured frequency shift into a “reduced force gradient” without any other parameter: jourdan-2009
| (3) |
This electrostatic calibration of the force probe using the only parameter is more relevant than the precise measurement of and . The traditional determination of based on the thermal noise spectral density and the equipartition theorem is indeed not possible at 4 K because of the dominant detection and backaction noises. laurent-2011
The measurement of in sphere-plane geometry allows a direct comparison between experiment and theory within the so-called proximity force approximation (PFA): derjaguin-1956
| (4) |
where is the force per unit area in plane-plane configuration, which is the quantity usually calculated by theory.
The determination of the free resonance frequency is a difficult but important issue, since it defines the origin of the frequency shift. This determination cannot be done when the sample is further away from the probe than the scanner range (1.5 m), because using the step motor would cause slight changes of due to mechanical vibrations that modify the system. In practice, is determined just before starting the force measurements, at the maximum scanner distance, and subsequently, we slightly adjust this value during the post-experimental analysis to get a residual force going to zero at infinity. This small adjustment does not affect significantly the data below 300 nm.
IV Suppression of the long-range residual force
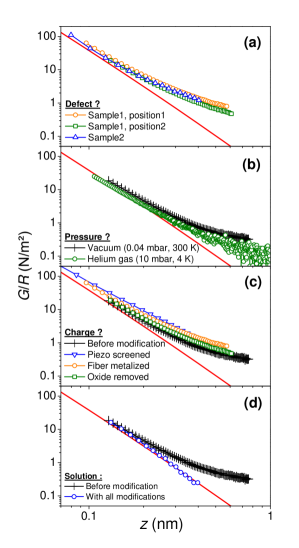
At the minimizing potential , the residual frequency shift should correspond a priori to the searched-for Casimir force. The reduced force gradient corresponding to (measured at 300 K) is plotted in Fig. 3 as a function of the sphere-sample distance for two gold surfaces. The data are compared with the theoretical prediction for Au-Au surfaces using the Drude model. lambrecht-2000 The force gradient in sphere-plane geometry is predicted to change from the short-range regime (van der Waals) to the long-range regime (Casimir) around the plasma wavelength of gold (136 nm). It is clearly seen in the figure that the power law of the experimental force gradient changes in a very different way, since the exponent is decreasing with distance instead of increasing. There is obviously an additional “parasitic” force, which overcomes the Casimir force at large distance. By fitting the difference between data and theory at large distance using a power law with the exponent as a free parameter, we obtain a dependence scaling like .
The origin of this parasitic force could be the inhomogeneity of the surface potential, which has been first identified by Speake and Tenkel speake-2003 as a source of residual electrostatic force, which is not compensated at the minimizing potential . This inhomogeneity originates from the random grain orientation of polycrystalline films, with different contact potential on different crystal faces, or from an inhomogeneous layer of native oxide, adsorbed contaminants, or chemical impurities. An experiment has reported such a long-range residual force that could be attributed to this patch potential effect. kim-2009 ; lamoreaux-2008 ; kim-2010 Another experiment, however, with two aluminum surfaces, could not explain the observed additional force by the spatial distribution of the contact potential that was measured directly by Kelvin-probe force microscopy. antonini-2009 In our case, the 1.8 power-law exponent is larger than the value 1.44 obtained in Ref. kim-2009, (0.72 for force gives 1.44 for force gradient), but is close to 2 as expected for a patch potential with small grains. In this regime, the root-mean-square fluctuations of the gold contact potential in a granular film ( mV) speake-2003 could be responsible for an electrostatic force gradient as large as N/m2 for m. This order of magnitude is compatible with the long-range force visible in Fig. 3 above 300 nm.
However, we discovered that this parasitic force could be suppressed after several modifications of the measurement setup and is more probably due to the electrostatic environment of the force probe. This conclusion is the result of a detailed analysis of many experiments carried out in different situations as reported in Fig. 4. First, we checked the reproducibility of this parasitic force by comparing the results obtained at two different locations on the same gold sample, and on a second gold sample [Fig. 4(a)]. Only small differences are visible between all three curves, with the same long-range residual force, therefore ruling out sample specific artifacts, like defects or inhomogeneities. Then, we tested the influence of temperature and exchange gas used for cooling the microscope head, because the gas confinement between the sphere and surface could have produced an additional distance-dependent dissipation. siria-2009 ; drezet-2010 ; laurent-2011b By comparing curves at 300 K in vacuum with curves at 4.2 K in helium gas [Fig. 4(b)], both showing the same additional long-range component, we can rule out any significant effect of temperature and surrounding gas. Note that the larger noise on the low-temperature data is the result of the optomechanical noise discussed above in the paper. Finally, we analyzed the influence of the electrostatic environment by testing separately a few changes to the setup, like covering the piezoelectric elements (scanner and dither) with grounded Faraday cages, coating the cladding of the optical fiber with gold, or removing the oxide layer of the anodized aluminum parts [Fig. 4(c)]. Each change has only a small impact on the parasitic force and none of them is able to cancel the parasitic force alone. After implementing all three changes simultaneously, the parasitic force has finally disappeared [Fig. 4(d)]. We therefore conclude that the origin of this force was probably not a patch potential effect, but more likely a force applied by residual charges in different parts of the microscope head. The Casimir force measurements described in the next section have been performed in these conditions with a clean electrostatic environment.
V Results for Gold-Gold and Gold-Silicon cavities
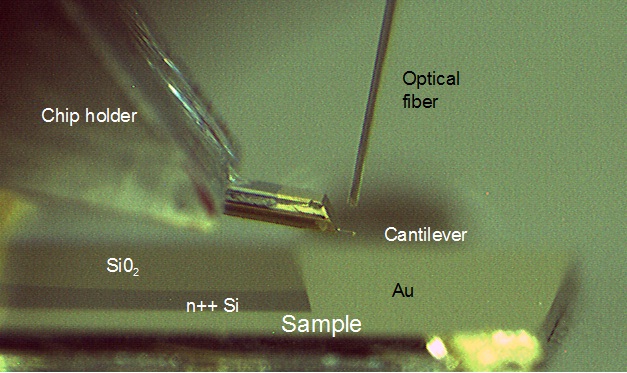
We now present our experimental results obtained at 4.2 K with a gold-coated force probe on a silicon substrate partly covered with 150 nm of gold. The objective is to compare the Casimir force gradient measured with the same sphere on two different materials. We compare a metal with a semiconductor because these materials have very different electronic properties. The sample is made of a heavily doped silicon substrate ( At/cm3 phosphorus doping and 4.2 m cm resistivity) in order to keep the surface conducting at low temperature. sze-2006 A region of the surface is then covered with 150 nm of gold (e-beam evaporation) with a sharp transition with the remaining part of the silicon substrate (Fig. 5). The translation stage (M2) is used to move the sample and place the selected region in front of the sphere. The Casimir force can therefore be measured in situ on the two materials, using a single force probe in a single environment (gas and temperature), in order to compare the data with better confidence than in separate experimental runs.
V.1 Minimizing potential
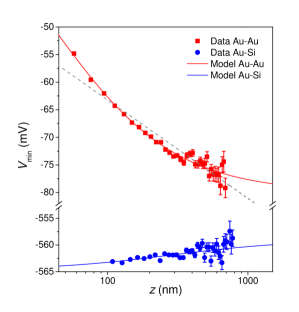
The potential applied on the sample to minimize the electrostatic force is plotted in Fig. 6 as a function of the sphere-plane separation. These values are stable in time and do not depend on the position along the surface. is almost independent of the distance for the silicon surface, around -560 mV, but varies strongly with distance for the gold surface, with an asymptote around -80 mV at large distance. Since the contact potential is expected to be zero for identical surfaces like in the Au-Au case, these results show that the interpretation of is more subtle.
Variations of the minimizing potential with distance have been observed previously in other Casimir force experiments. kim-2008 ; kim-2009 ; deman-2009 This effect can be explained by the inhomogeneous surface potential (called patch potential) induced by the random distribution of crystal orientations in gold films made of interconnected grains, several tens of nanometers in diameter, with work function fluctuations mV. speake-2003 When the probe is close to the surface, the interaction area is small and more sensitive to the local crystalline orientation, whereas at large distance, the interaction is averaged on a large number of grains. Another explanation can be the presence of a smooth gradient of material work function along the film. kim-2010 In this context, the relation was found to mimic the logarithm trend observed for two germanium surfaces kim-2009 ; lamoreaux-2008 and two gold surfaces. deman-2009b Here, the fit of our Au-Au data with this relation (dashed line on Fig. 6) is, however, not satisfactory and we propose another model.
Casimir force experiments are not the only ones to evidence a distance dependence of the minimizing potential. This effect is also observed in Kelvin-probe force microscopy and a model was developed in this context by Hadjadj et al., hadjadj-2002 which takes into account the interaction of the probe with its entire environment. By using a simple electrostatic model, these authors found that the presence of metallic objects in the surrounding influences the minimizing potential according to the relation
| (5) |
where and are related to the electrostatic potential and capacitance of the environment, and is the contact potential obtained when tends to zero. By fitting our Au-Au data with this model, as shown in Fig. 6, we obtain mV, mV, and nm. This simple electrostatic model reproduces very well our experimental data and the contact potential is found very close to zero (considering the error bar) as expected for two identical gold surfaces. This analysis demonstrates the influence played by the environment of the force probe on the minimizing potential and shows that can usually not be assimilated to the contact potential at finite distance.
The same analysis has been applied on the data obtained on the silicon surface and we obtain mV, mV, and nm. Although we could have expected a similar dependence on distance than for Au-Au because of the same environment, the minimizing potential is found to be almost constant for Au-Si. An explanation might be that the sample has been translated by a few millimeters to switch from gold to silicon, thereby slightly changing the environment. The constant for Au-Si confirms that the variations observed above for Au-Au are not due to contact potential fluctuations, because we should also observe such variations here, not due to the silicon surface, which is mono-crystalline, but due to the contact potential fluctuations over the gold-coated sphere. The microstructure of the gold films could be, however, different on the polystyrene sphere and on the silicon substrate, making a definite conclusion difficult.
V.2 Casimir force
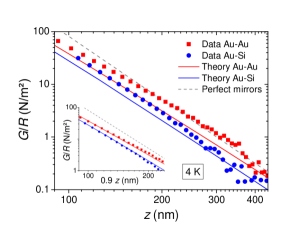
The Casimir force measured at 4.2 K on the gold and silicon regions is presented in Fig. 7 together with the theoretical predictions calculated for these specific sample-probe configurations using the Drude model (see the Appendix). lambrecht-2000 ; duraffourg-2006 ; lambrecht-2007 It is clearly seen that the measured Casimir force is weaker on doped silicon than on gold, as predicted by theory. The experimental data are, however, above the theoretical curves by 50%, i.e., much more than the error in the force calibration factor , which is better than 1%. Recently, computations of the Casimir force pirozhenko-2006 ; svetovoy-2008 have emphasized the sensitivity of the results to the choice of the materials optical data ordal-1985 ; rakic-1998 used in the calculations: for gold mirrors, the uncertainty is, however, only of about 5%. The validity of the PFA is another important assumption in the theory-experiment comparison: krause-2007 ; maianeto-2008 the error should be smaller than 1% here since . chen-2006 The large discrepancy between theory and experiment regarding the absolute value of the force gradient requires, therefore, another explanation.
A possible source of error being the calibration of the scanner extension, we found that multiplying the distance of each data point by a factor 0.9 translates the data points onto the theoretical curves as shown in the inset of Fig. 7. Since the force calibration is dependent on the scanner calibration, it is in fact a factor 0.85 that should be applied on the relative distance (before the determination of ) in order to shift the data onto the theoretical curves. The piezoelectric -scanner was calibrated by interferometry nine months before the force measurements reported here and it could be that the scanner extension has been progressively reduced after successive thermal cycles between 300 and 4.2 K. Since this hypothesis could not be checked at the time of the experiment, we stop here the discussion on the absolute comparison between experiment and theory, and now discuss the relative value obtained between gold and silicon surfaces.
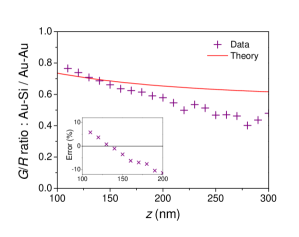
The ratio of the Au-Si over the Au-Au force gradient is plotted in Fig. 8 for a series of distances where the experimental force gradients have been determined by interpolation. The ratio is lower than unity as expected for a cavity with a semiconductor plate, which is optically less reflecting than gold. The ratio decreases progressively with distance as also expected from theory, lambrecht-2007 with a correction factor , which saturates at large distance to a lower value for Au-Si than for Au-Au. Quantitatively, the experimental ratio is of the same order as the theoretical value at short distance, with an error less than 10% in the 100–200 nm distance range, but the ratio decreases faster with distance than predicted by theory. These results show that, although the absolute comparison with theory is not possible here, the material dependence of the Casimir force is clearly evidenced when the surface is changed from gold to silicon.
To improve this experiment in the future, the scanner extension should be measured by interferometry in situ during the measurement to avoid the effect of thermal cycles on the scanner piezoelectric coefficient. The detection sensitivity could be also improved by stabilization of the laser intensity down to the shot noise level, in order to minimize the detection and backaction noises, and take advantage of the strongly suppressed thermomechanical noise at 4.2 K.
VI Conclusion
From an instrumental point of view, we have shown that the presence of a long-range parasitic force at the minimizing potential can be related to the electrostatic environment of the force probe. Precise measurements of the Casimir force therefore require an accurate control of the environment, like screening of every insulating part close to the probe: chip holder, optical fiber, and piezoelectric actuators. Regarding the minimizing potential, the variations with distance observed for the Au-Au cavity could be explained by a model taking into account the electrostatic potential of the environment, and the absence of variation for the Au-Si cavity indicates that there is no patch potential effect on the gold-coated sphere. Finally, we have shown that our in situ measurement of the Casimir force using a single spherical probe (gold) and two different surfaces (gold or doped silicon) gives qualitatively the correct value for the relative force gradient, although the absolute values are not correct due to a systematic error that might be attributed to the scanner calibration.
The sensitivity of the Casimir force to material properties, as demonstrated here, could be used for surface characterization in a new type of non-contact scanning force microscopy. Such a technique would be the extension of the near-field van der Waals force microscopy to the retarded Casimir regime at large separation. For a given force sensitivity, measuring at large distances implies the use of micron-size spherical probes with a lower spatial resolution than the sharp tips used in atomic force microscopy, but provides information on the optical properties of the materials. With the Casimir force being obtained at the minimizing electrostatic potential, this technique would be complementary to the measurement of the contact potential by Kelvin-probe force microscopy.
Acknowledgements.
The low-temperature AFM was designed and built by J-F. Motte. We thank T. Ouisse for an early contribution to this work and for helpful discussion. This work has benefited from fruitful discussions with P. Andreucci, L. Duraffourg, J-J. Greffet, G. Jourdan, and A. Lambrecht. The samples and probes were prepared in the Nanofab clean-room facility. This research was supported by the PNANO 2006 program of the Agence Nationale de la Recherche under the project name MONACO.Appendix
The Casimir force is computed for parallel plates of infinite thicknesses by taking into account the real material properties as explained in Refs. duraffourg-2006, ; lambrecht-2007, . The dielectric constant is modeled by a plasma frequency and a Drude relaxation parameter , plus a Lorentz function with resonance frequency , relaxation parameter , and susceptibility , describing interband transitions for gold and intrinsic response for silicon:
| (6) |
The parameters used in the computation are listed in Table 1. We checked that our computation algorithm gives the correct results for the well-known Au-Au cavity, before computing the force for our specific Au-Si cavity.
| ( rad/s) | ( rad/s) | ( rad/s) | ( rad/s) | ||
| Au | 13.7 | 0.05 | 20 | 25 | 5 |
| Si | 0.37 | 0.052 | 6.6 | 0 | 10.87 |
References
- (1) K.L. Ekinci and M.L. Roukes, Rev. Sci. Instrum. 76, 061101 (2005).
- (2) K.C. Schwab and M.L Roukes, Phys. Today 58 (7), 36 (2005).
- (3) H.B.G. Casimir, Proc. K. Ned. Akad. Wet. 51, 793 (1948).
- (4) I. Antoniadis, S. Baessler, M. Buchner, V.V. Fedorov, S. Hoedl, A. Lambrecht, V.V. Nesvizhevsky, G. Pignol, K.V. Protasov, S. Reynaud, Yu. Sobolev, C. R. Phys. 12, 755 (2011).
- (5) W.H. Lin and Y.P. Zhao, Microsyst. Technol. 11, 80 (2005).
- (6) M.J. Sparnaay, Physica 24, 751 (1958).
- (7) S.K. Lamoreaux, Phys. Rev. Lett. 78, 5 (1997).
- (8) U. Mohideen and A. Roy, Phys. Rev. Lett. 81, 4549 (1998).
- (9) H.B. Chan, V.A. Aksyuk, R.N. Kleiman, D.J. Bishop, and F. Capasso, Science 291, 1941 (2001).
- (10) R.S. Decca, D. Lopez, E. Fischbach, and D.E. Krause, Phys. Rev. Lett. 91, 050402 (2003).
- (11) G. Bressi, G. Carugno, R. Onofrio, and G. Ruoso, Phys. Rev. Lett. 88, 041804 (2002).
- (12) P. Antonini, G. Bressi, G. Carugno, G. Galeazzi, G. Messineo, and G. Ruoso, New J. Phys. 8, 239 (2006).
- (13) P. Ball, Nature 447, 772 (2007).
- (14) R.S. Decca, D. Lopez, E. Fischbach, G.L. Klimchitskaya, D.E. Krause, and V.M. Mostepanenko, Ann. Phys. (N.Y.) 318, 37 (2005).
- (15) R.S. Decca, D. Lopez, E. Fischbach, G.L. Klimchitskaya, D.E. Krause, and V.M. Mostepanenko, Phys. Rev. D 75, 077101 (2007).
- (16) W.J. Kim, M. Brown-Hayes, D.A.R. Dalvit, J.H. Brownell, and R. Onofrio, Phys. Rev. A 78, 020101 (R) (2008).
- (17) P.J. van Zwol, G. Palasantzas, and J.Th.M. De Hosson, Phys. Rev. B 77, 075412 (2008).
- (18) G. Jourdan, A. Lambrecht, F. Comin, and J. Chevrier, Europhys. Lett. 85, 31001 (2009).
- (19) A.O. Sushkov, W.J. Kim, D.A.R. Dalvit, and S.K. Lamoreaux, Nature Phys. 7, 230 (2011).
- (20) R.S. Decca, D. Lopez, H.B. Chan, E. Fischbach, D.E. Krause, and C.R. Jamell, Phys. Rev. Lett. 94, 240401 (2005).
- (21) F. Chen, U. Mohideen, G.L. Klimchitskaya, and V.M. Mostepanenko, Phys. Rev. A 72, 020101(R) (2005).
- (22) F. Chen, U. Mohideen, G.L. Klimchitskaya, and V.M. Mostepanenko, Phys. Rev. A 74, 022103 (2006).
- (23) F. Chen, G.L. Klimchitskaya, V.M. Mostepanenko, and U. Mohideen, Phys. Rev. Lett. 97, 170402 (2006).
- (24) H.B. Chan, Y. Bao, J. Zou, R.A. Cirelli, F. Klemens, W.M. Mansfield, and C.S. Pai, Phys. Rev. Lett. 101, 030401 (2008).
- (25) W.J. Kim, A.O. Sushkov, D.A.R. Dalvit, and S.K. Lamoreaux, Phys. Rev. Lett. 103, 060401 (2009).
- (26) S. de Man, K. Heeck, R.J. Wijngaarden, and D. Iannuzzi, Phys. Rev. Lett. 103, 040402 (2009).
- (27) A. Lambrecht and S. Reynaud, Eur. Phys. J. D 8, 309 (2000).
- (28) C. Genet, A. Lambrecht, and S. Reynaud, Phys. Rev. A 67, 043811 (2003).
- (29) G. Palasantzas and J.Th.M. De Hosson, Phys. Rev. B 72, 115426 (2005).
- (30) A. Lambrecht and V.N. Marachevsky, Phys. Rev. Lett. 101, 160403 (2008).
- (31) L. Duraffourg and Ph. Andreucci, Phys. Lett. A 359, 406 (2006).
- (32) A. Lambrecht, I. Pirozhenko, L. Duraffourg, and P. Andreucci, Europhys. Lett. 77, 44006 (2007).
- (33) D.A.R. Dalvit and S.K. Lamoreaux, Phys. Rev. Lett. 101, 163203 (2008).
- (34) R.S. Decca, D. Lopez, and E. Osquiguil, Int. J. Mod. Phys. A 25, 2223 (2010).
- (35) C. Genet, A. Lambrecht, and S. Reynaud, Phys. Rev. A, 62, 012110 (2000).
- (36) C.C. Speake and C. Trenkel, Phys. Rev. Lett. 90, 160403 (2003).
- (37) A. Hadjadj, B. Equer, A. Beorchia, and P. Roca i Cabarrocas, Philos. Mag. B 82, 1257 (2002).
- (38) M. Brun, S. Huant, J.C. Woehl, J.-F. Motte, L. Marsal, and H. Mariette, J. Microscopy 202, 202 (2001).
- (39) D. Rugar, H.J. Mamin, and P. Guethner, Appl. Phys. Lett. 55, 2588 (1989).
- (40) J. Laurent, A. Mosset, O. Arcizet, J. Chevrier, S. Huant, and H. Sellier, Phys. Rev. Lett. 107, 050801 (2011).
- (41) V.B. Braginsky, A.B. Manukin, and M.Yu. Tikhonov, Sov. Phys. JETP 31, 829 (1970).
- (42) V.B. Braginsky and S.P. Vyatchanin, Phys. Lett. A 293, 228 (2002).
- (43) I. Favero and K. Karrai, Nat. Photon. 3, 201 (2009).
- (44) A. Dorsel, J.D. McCullen, P. Meystre, E. Vignes, and H. Walther, Phys. Rev. Lett. 51, 1550 (1983).
- (45) M. Vogel, C. Mooser, K. Karrai, and R.J. Warburton, Appl. Phys. Lett. 83, 1337 (2003).
- (46) C. Metzger and K. Karrai, Nature (London) 432, 1002 (2004).
- (47) O. Arcizet, P.-F. Cohadon, T. Briant, M. Pinard, and A. Heidmann, Nature (London) 444, 71 (2006).
- (48) S. Gigan, H.R. Böhm, M. Paternostro, F. Blaser, G. Langer, J.B. Hertzberg, K.C. Schwab, D. Bäuerle, M. Aspelmeyer, and A. Zeilinger, Nature (London) 444, 67 (2006).
- (49) The electrostatic force at nm produces a static deflection of 2 Å for a cantilever stiffness N/m and a potential difference mV.
- (50) B.V. Derjaguin, I.I. Abrikosova, and E.M. Lifshitz, Q. Rev. Chem. Soc. 10, 295 (1956).
- (51) S.K. Lamoreaux, e-print arXiv:0808.0885v2.
- (52) W.J. Kim, A.O. Sushkov, D.A.R. Dalvit, and S.K. Lamoreaux, Phys. Rev. A 81, 022505 (2010).
- (53) P. Antonini, G. Bimonte, G. Bressi, G. Carugno, G. Galeazzi, G. Messineo, and G. Ruoso, J. Phys.: Conf. Ser. 161, 012006 (2009).
- (54) A. Siria, A. Drezet, F. Marchi, F. Comin, S. Huant, and J. Chevrier, Phys. Rev. Lett. 102, 254503 (2009).
- (55) A. Drezet, A. Siria, S. Huant, and J. Chevrier, Phys. Rev. E 81, 046315 (2010).
- (56) J. Laurent, A. Drezet, H. Sellier, J. Chevrier, and S. Huant, Phys. Rev. Lett. 107, 164501 (2011).
- (57) S.M. Sze and K.N. Kwok, Physics of Semiconductor Devices, 3rd ed. (Wiley, New York, 2006).
- (58) S. de Man, K. Heeck, and D. Iannuzzi, Phys. Rev. A 79, 024102 (2009).
- (59) I. Pirozhenko, A. Lambrecht, and V.B. Svetovoy, New J. Phys. 8, 238 (2006).
- (60) V.B. Svetovoy, P.J. van Zwol, G. Palasantzas, and J.T.M. De Hosson, Phys. Rev. B 77, 035439 (2008).
- (61) M.A. Ordal, R.J. Bel, R.W. Alexander, Jr, L.L. Long, and M.R. Querry, Appl. Opt. 24, 4493 (1985).
- (62) A.D. Rakic, A.B. Djurisic, J.M. Elazar, and M.L. Majewski, Appl. Opt. 37, 5271 (1998).
- (63) D.E. Krause, R.S. Decca, D. López, and E. Fischbach, Phys. Rev. Lett. 98, 050403 (2007).
- (64) P.A. Maia Neto, A. Lambrecht, and S. Reynaud, Phys. Rev. A 78, 012115 (2008).