CERN-PH-TH/2012-003
YITP-12-2
IFUP-TH/2012-01
Constraints on the two-flavor QCD phase diagram
from imaginary chemical potential
Abstract:
We review our knowledge of the phase diagram of QCD as a function of temperature, chemical potential and quark masses. The presence of tricritical lines at imaginary chemical potential , with known scaling behaviour in their vicinity, puts constraints on this phase diagram, especially in the case of two light flavors. We show first results in our project to determine the finite-temperature behaviour in the chiral limit.
1 Introduction
The phase diagram of QCD as a function of temperature and quark chemical potential is governed by the interplay of the chiral symmetry and the center symmetry [1]. These symmetries are exact for zero and infinite quark masses, respectively. Therefore, varying the quark masses away from their physical values towards these limits provides useful insight into the behaviour of QCD at the physical mass point.
Similarly, making the chemical potential complex provides enhanced information on the behaviour of QCD at real chemical potential. Since the sign problem which plagues simulations at non-zero [2] is absent when is pure imaginary, the regime of imaginary is actually the only direction in the complex plane where complete, reliable information on the behaviour of QCD can be obtained. It turns out that a rich phase diagram as a function of and of the quark masses emerges. The critical and tricritical features of this phase diagram, with their associated scaling laws, have consequences for the behaviour of QCD at real .
Here, we summarize what is known about this phase diagram and sketch (Fig. 2) a plausible scenario, consistent with current numerical simulations augmented with reasonable assumptions of continuity of the critical surfaces. We explore in particular the implications for the behaviour of QCD in the two-flavor chiral limit . In that limit, it is widely believed that QCD undergoes a finite-temperature, second-order chiral transition at , which turns first-order at a tricritical point for some real [3]. However, other possibilities exist. At in particular, the finite-temperature transition might be first-order. The present numerical evidence is inconclusive: using Wilson fermions, scaling is preferred [4], while with staggered fermions scaling has been elusive, and first-order behaviour has also been claimed [5]. Note that behaviour consistent with has been seen with improved staggered fermions, in an setup where the strange quark mass is fixed at its physical value [6]. Approaching the chiral limit from the imaginary direction offers a novel, independent method to help settle the issue.
2 Three-dimensional Columbia plot
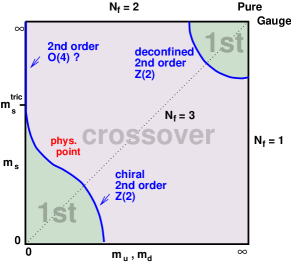
The thermal behaviour of QCD at , as a function of the quark masses and is summarized in the well-known Columbia plot Fig. 1 (left). The chiral symmetry and the center symmetry are achieved in the lower left and upper right corners, respectively. This gives rise to first-order transitions. For intermediate quark masses, numerical simulations indicate a smooth crossover as a function of temperature. Hence, the first-order regions must be bounded by second-order critical lines: the chiral critical line in the lower left corner, and the deconfinement critical line in the upper right corner. In the absence of further symmetry, the universality class is expected (and has been numerically verified) to be that of the Ising model. The chiral critical line joins with the axis at a tricritical point, for a strange quark mass which is larger than the physical strange quark mass on coarse lattices [7] or smaller when using improved actions [6]. The chiral limit is obtained in the upper left corner.
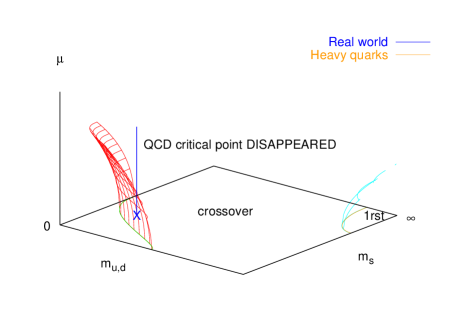
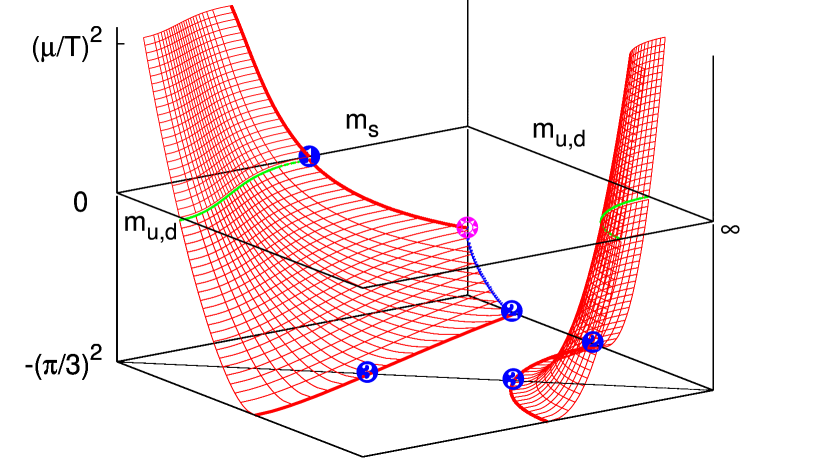
When the chemical potential is turned on, the two critical lines sweep critical surfaces as a function of . For both lines, it has been observed that the first-order region shrinks, as represented Fig. 1 (right) [7, 8, 9]. Here, we want to show real and imaginary in a single figure. Therefore, we adopt for the coordinate: real and imaginary appear above and below the plane, respectively. Of particular interest is the Roberge-Weiss plane . We now argue that the 3-dimensional phase diagram of QCD is likely to be described by Fig. 2.
3 Phase diagram in the Roberge-Weiss plane

The two symmetries of the partition function
| (1) |
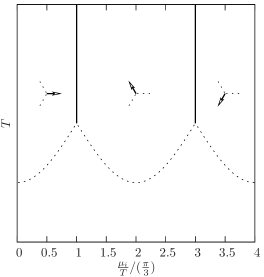
imply reflection symmetry in the imaginary direction about the “Roberge-Weiss” values which separate different sectors of the center symmetry [11]. Transitions between neighbouring sectors are of first order for high and analytic crossovers for low [11, 12, 13], as indicated Fig. 3 (left). The corresponding first-order transition lines may end with a second-order critical point, or with a triple point, branching off into two first-order lines. Which of these two possibilities occurs depends on the number of flavors and the quark masses.
Recent numerical studies have shown that a triple point is found for heavy and light quark masses, while for intermediate masses one finds a second-order endpoint. As a function of the quark mass, the phase diagram at is as sketched Fig. 3 (middle). This happens for both [14] and [15].
If one assumes that the and tricritical points are connected to each other in the quark mass plane, the resulting phase diagram is depicted Fig. 3 (right), with two tricritical lines separating regions of first-order and of second-order transitions. This phase diagram is the equivalent of the Columbia plot, now at imaginary chemical potential . Note that the assumption of continuity of the tricritical lines can be checked directly by numerical simulations, since there is no sign problem for imaginary .
Now, as is varied between zero and the Roberge-Weiss value , the Columbia plot must change from Fig. 1 (left) to Fig. 3 (right). Assuming continuity of the critical surfaces at imaginary , which again can be checked by numerical simulations, the resulting 3-dimensional phase diagram is that of Fig. 2. The two red surfaces (“chiral” and “deconfinement”) are critical. They are bounded by lines, among which the following are tricritical: (i) the two lines in the Roberge-Weiss plane; (ii) the line in the chiral plane. Note that the (i.e. ) “backplane” contains two tricritical points on the chiral critical surface: one in the Roberge-Weiss plane, the other on the vertical axis (see Fig. 2). The location of the latter is related to the value of the tricritical strange quark mass.
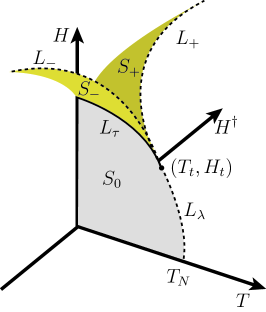
4 Tricritical scaling
In the vicinity of a tricritical point, scaling laws apply. The phase diagram is similar to that of a metamagnet, with two external fields: , which respects the symmetry, and which breaks it (like a staggered and an ordinary magnetic field), depicted Fig. 4 (left). The three surfaces indicate first-order transitions. They meet at a line of triple points , depicted by a solid line. They are bounded by second-order transition lines, depicted by dotted lines. All four lines meet at the tricritical point .
In our case, the scaling exponents governing the behaviour near the tricritical point are mean-field, because QCD becomes 3-dimensional as the correlation length diverges while the temperature is fixed to that of the tricritical point, and is the upper critical dimension for tricriticality. Of course, this implies the presence of potentially large logarithmic corrections to scaling.
Here, we are interested in the second-order lines , corresponding to a departure from the symmetry plane . Along these lines, the scaling law is , where the
reduced temperature is measured along the tangent to . For QCD, tricritical scaling
should be satisfied near the tricritical points:
: then , so that
| (2) |
: then , so that
| (3) |
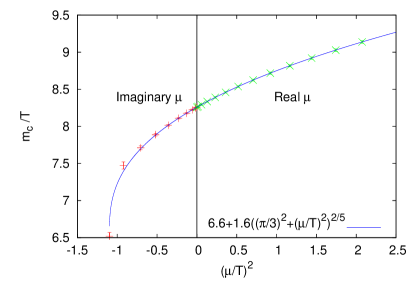
It is not clear how broad the scaling window is around each of these two tricritical points. The two scaling windows might overlap, leading to a very constrained system of equations, with 3 unknowns (the two constants of proportionality in eqs.(2,3) and — having been determined already in [14]) and one constraint (continuity of the derivative at the intersection of the two scaling curves), leading to a phase diagram as in Fig. 5 (left), which could be determined from only two points measured by Monte Carlo. Reason for such optimism can be found in Fig. 4 (right), where the scaling window around the third tricritical point, corresponding to heavy quarks, is shown to extend far into the region of real chemical potential [15, 16].
5 Preliminary results
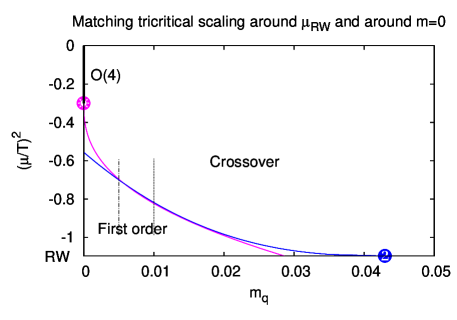
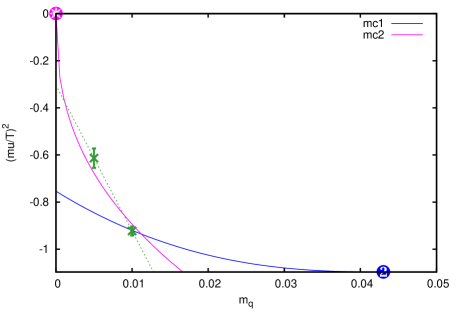
Following the above discussion, we performed simulations of QCD, with staggered quarks of masses and on lattices, scanning in to determine the value of imaginary corresponding to a second-order transition. Our observable is the Binder cumulant of the quark condensate. Consistent results are obtained from the finite-size scaling of the plaquette distribution. The two critical points are shown Fig. 5 (right). Disappointingly, it seems impossible to smoothly match two tricritical scaling curves passing through these points. Additional masses are needed to determine the critical curve. Nevertheless, assuming convexity of the critical curve already constrains the tricritical point to lie at . The figure illustrates the case where this point lies at . It might also lie at , so that the chiral transition would be first-order. Additional small-mass measurements are underway and will settle this issue. Note that we are simulating two-flavour QCD by taking the square root of the staggered determinant, and approaching the chiral limit at fixed, rather coarse lattice spacing. This is the wrong order of limits, and is the most likely approach to expose a failure of rooting.
Finally, our phase diagram Fig. 2 makes it clear that, if the transition in the massless theory is , turning on a real chemical potential (i.e. going up the vertical axis in the back) will not make it become first-order. Obtaining such behaviour requires that the chiral critical surface bend away from the chiral point, or that another, non-chiral critical surface appear at large .
Acknowledgements:
This work is partially supported by the German BMBF, project Hot Nuclear Matter from Heavy Ion Collisions and its Understanding from QCD, No. 06MS254. We thank the Minnesota Supercomputer Institute and HLRS Stuttgart for providing computer resources. Large scale simulations have been performed on two GPU clusters in Pisa and Genoa provided by INFN.
References
- [1] For a review, see e.g. E. Laermann and O. Philipsen, Ann. Rev. Nucl. Part. Sci. 53 (2003) 163 [hep-ph/0303042].
- [2] P. de Forcrand, PoS LAT2009 (2009) 010 [arXiv:1005.0539 [hep-lat]].
- [3] A. M. Halasz, A. D. Jackson, R. E. Shrock, M. A. Stephanov and J. J. M. Verbaarschot, Phys. Rev. D 58 (1998) 096007 [hep-ph/9804290].
- [4] Y. Iwasaki, K. Kanaya, S. Kaya and T. Yoshie, Phys. Rev. Lett. 78 (1997) 179 [hep-lat/9609022].
- [5] M. D’Elia, A. Di Giacomo and C. Pica, Phys. Rev. D 72, 114510 (2005) [hep-lat/0503030]; G. Cossu, M. D’Elia, A. Di Giacomo and C. Pica, arXiv:0706.4470 [hep-lat]; C. Bonati, G. Cossu, M. D’Elia, A. Di Giacomo and C. Pica, PoS LATTICE 2008 (2008) 204 [arXiv:0901.3231 [hep-lat]].
- [6] S. Ejiri, F. Karsch, E. Laermann, C. Miao, S. Mukherjee, P. Petreczky, C. Schmidt and W. Soeldner et al., Phys. Rev. D 80 (2009) 094505 [arXiv:0909.5122 [hep-lat]].
- [7] P. de Forcrand and O. Philipsen, JHEP 0701 (2007) 077 [arXiv:hep-lat/0607017].
- [8] P. de Forcrand and O. Philipsen, JHEP 0811 (2008) 012 [arXiv:0808.1096 [hep-lat]].
- [9] S. Kim et al., PoS LAT2005 (2006) 166 [arXiv:hep-lat/0510069].
- [10] P. de Forcrand and O. Philipsen, Nucl. Phys. B 673 (2003) 170 [arXiv:hep-lat/0307020].
- [11] A. Roberge and N. Weiss, Nucl. Phys. B 275 (1986) 734.
- [12] P. de Forcrand and O. Philipsen, Nucl. Phys. B 642, 290 (2002) [arXiv:hep-lat/0205016].
- [13] M. D’Elia and M. P. Lombardo, Phys. Rev. D 67, 014505 (2003) [arXiv:hep-lat/0209146].
- [14] M. D’Elia and F. Sanfilippo, Phys. Rev. D 80 (2009) 111501 [arXiv:0909.0254 [hep-lat]]; C. Bonati, G. Cossu, M. D’Elia and F. Sanfilippo, Phys. Rev. D 83, 054505 (2011) [arXiv:1011.4515 [hep-lat]].
- [15] P. de Forcrand and O. Philipsen, Phys. Rev. Lett. 105 (2010) 152001 [arXiv:1004.3144 [hep-lat]].
- [16] M. Fromm, J. Langelage, S. Lottini and O. Philipsen, arXiv:1111.4953 [hep-lat].