Detection of accretion X-rays from QS Vir: cataclysmic or a lot of hot air?
Abstract
An XMM-Newton observation of the nearby “pre-cataclysmic” short-period ( hr) binary QS Vir (EC 13471-1258) revealed regular narrow X-ray eclipses when the white dwarf passed behind its M2–4 dwarf companion. The X-ray emission provides a clear signature of mass transfer and accretion onto the white dwarf. The low-resolution XMM-Newton EPIC spectra are consistent with a cooling flow model and indicate an accretion rate of /yr. At 48 pc distant, QS Vir is then the second nearest accreting cataclysmic variable known, with one of the lowest accretion rates found to date for a non-magnetic system. To feed this accretion through a wind would require a wind mass loss rate of yr-1 if the accretion efficiency is of the order of 10%. Consideration of likely mass loss rates for M dwarfs suggests this is improbably high and pure wind accretion unlikely. A lack of accretion disk signatures also presents some difficulties for direct Roche lobe overflow. We speculate that QS Vir is on the verge of Roche lobe overflow, and that the observed mass transfer could be supplemented by upward chromospheric flows on the M dwarf, analogous to spicules and mottles on the Sun, that escape the Roche surface to be subsequently swept up into the white dwarf Roche lobe. If so, QS Vir would be in a rare evolutionary phase lasting only a million years. The X-ray luminosity of the M dwarf estimated during primary eclipse is erg s-1, which is consistent with that of rapidly rotating “saturated” K and M dwarfs.
1 Introduction
Short-period binaries composed of a white dwarf and late-type star are of fundamental importance to astrophysics as they are progenitors of cataclysmic variables (CVs) and novae, some of which likely evolve to form type 1a supernovae. Stellar evolution theory predicts that these systems are the outcome of a common envelope evolutionary phase in which frictions leads to a rapid spiraling down of the orbit of an initial wider binary (Paczynski, 1976). At the conclusion of the common envelope phase, the orbit of the system is expected to decay further as a result of angular momentum lost to gravitational radiation and to the magnetized wind of the unevolved component (Kraft et al., 1962; Paczyński, 1967; Verbunt & Zwaan, 1981). As their separation decreases, the Roche lobe of the secondary is reduced in size and is eventually completely filled, initiating the onset of mass transfer onto the white dwarf.
The timescale for initiation of mass transfer in a post-common envelope binary depends critically on the angular momentum loss rate. While angular momentum loss through gravitational radiation is theoretically well-understood for the stars in CVs, there is no comprehensive theory of spin-down through magnetized winds that is expected to dominate the evolution of systems with periods above the CV period gap of hr. It depends on the wind mass loss rate and the large scale stellar magnetic field (e.g. Weber & Davis, 1967; Mestel, 1968; Kawaler, 1988). Both are extremely difficult to measure for late-type stars and are especially uncertain at the very rapid rotation rates of close binaries where magnetic proxies such as X-ray emission show saturation and supersaturation effects that appear to affect spin-down rates (e.g. Ivanova & Taam, 2003; Barnes, 2003).
In this paper, we present XMM-Newton observations of the intriguing DA+M2-4 3.6hr eclipsing binary QS Vir (formerly more commonly known as EC 13471-1258) that was first discovered as a white dwarf–M dwarf binary in the Edinburgh-Cape blue object survey (Kilkenny et al., 1997). QS Vir has gained considerable recent attention as a valuable diagnostic of close binary evolution and angular momentum loss. Based on an extensive analysis of high-speed and multi-colour photometry, together with UV HST STIS and visible light spectroscopy, O’Donoghue et al. (2003, see also ) concluded that the system filled its Roche lobe and was probably undergoing very weak mass transfer and suggested the system might be a hibernating cataclysmic variable. It was detected in the ROSAT All Sky Survey (RASS) at count s-1 (Voges et al., 1999) implying an inconspicuous X-ray luminosity erg s-1—much too low for an accreting CV. More recently, Qian et al. (2010) inferred the presence of a giant planet with mass in a 7.86 yr orbit based on long term period variations, although Parsons et al. (2010) ruled this out from more complete eclipse monitoring. Instead they find a third body in a highly elliptical orbit best fits the more complete data, noting that this explanation for the secular orbit change is also not without problems. Ribeiro et al. (2010) found evidence for material possibly associated with wind accretion within the Roche lobe of the white dwarf, while Parsons et al. (2011) interpreted phase-specific absorption signatures as a stellar prominence originating from the M dwarf. The latter also found the white dwarf to be slowly rotating, indicating a pre-cataclysmic evolutionary status.
Here, we report the discovery of deep, narrow X-ray eclipses locating the dominant source of X-rays on the white dwarf rather than the corona of the late-type star and implying ongoing accretion. QS Vir has one of the lowest accretion rates of known non-magnetic systems. This, together with its eclipsing nature and proximity (48 pc; O’Donoghue et al. 2003), renders QS Vir an interesting object for the study of CV evolution.
2 Observations and Data Analysis
QS Vir is an eclipsing binary with an inclination of and an orbital period of days. The component spectral types are classified as DA and M2–4 with masses , and , , respectively (Kawka et al., 2002; O’Donoghue et al., 2003; Howell et al., 2010; Ribeiro et al., 2010; Qian et al., 2010).
QS Vir was observed using the instruments on board the XMM-Newton satellite (Jansen et al., 2001). Both RGS detectors (den Herder et al., 2001) operated in “Spectroscopy” mode, while the EPIC-pn (Strüder et al., 2001) and both MOS (Turner et al., 2001) cameras operated in “Small window” mode using a medium filter. The OM telescope (Mason et al., 2001) was used in “Fast Mode” with the filter, but a hardware glitch placed the source outside of the photometry window and severely compromised the data. A summary of the observations is reported in Table 1. Here we concentrate on the EPIC observations; RGS spectra were of low signal-to-noise ratio, although a number of weak emission lines attributed to O VIII, Fe XVII, Ne IX an Ne X could be discerned.
2.1 X-ray and Optical Photometry
Data were reduced with the XMM-Newton Science Analysis System software version 7.0.0, updated with the latest calibration files. The EPIC-pn background-subtracted light curve with a 100s bin size is showed in Fig. 1. Apart from the sizable flare 20 ks into the observation, which is likely due to coronal activity on the red dwarf, the most conspicuous feature of the light curve is the presence of deep eclipses of duration s and a period of about 13 ks. This eclipse period and duration matches that found by O’Donoghue et al. (2003) in their UV-optical study of QS Vir, and we attribute the eclipses to the UV-bright white dwarf passing behind the red dwarf. At mid-eclipse, the X-ray emission declines to about 15% of its uneclipsed intensity, indicating that % of the X-ray signal originates from the vicinity of the white dwarf and dominates the quiescent coronal X-ray intensity of the M dwarf.
OM frames were analyzed using custom software designed to extract the residual spill-over signal in the photometry window from point spread function wings. While not photometric, sufficient signal was recovered to verify that the X-ray and -band eclipses coincided with each other.
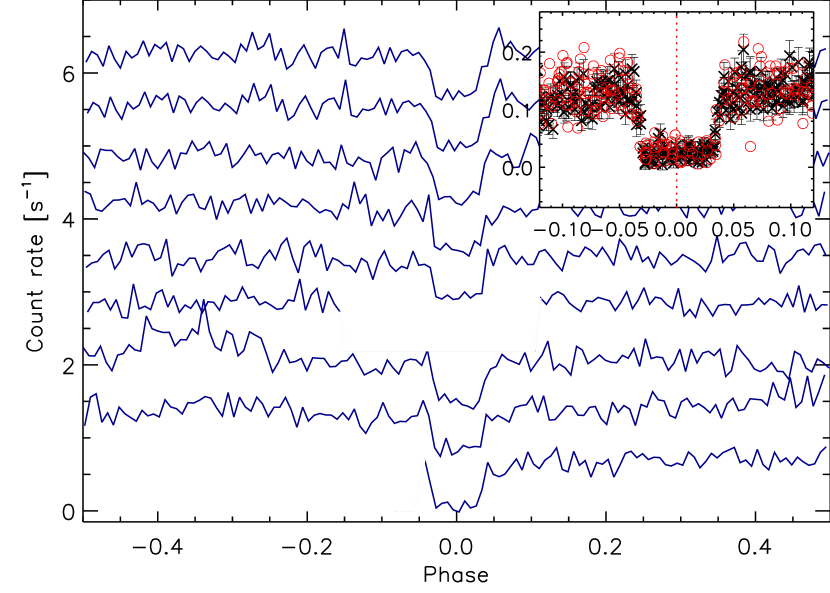
The EPIC-pn light curve phase-folded on the ephemeris for optical mid-eclipse derived from observations between 1992-2002 by O’Donoghue et al. (2003) succeeded in co-aligning eclipses in phase space. However, the X-ray eclipse preceded the optically-derived one by about 120s. This is a much larger offset than expected based on the period drift apparent in Figure 3c of O’Donoghue et al. (2003), indicating that the orbital period had shortened somewhat in the interval between the ephemeris epoch and our 2006 observations. This secular period shortening was confirmed recently by the later optical observations of Qian et al. (2010) and Parsons et al. (2010). The ephemerides of these works are similar for the epoch of our observations and adopting arbitrarily that of the former we find our X-ray and -band eclipses are centered on the expected primary eclipse. The phase-folded X-ray light curve based on this ephemeris is illustrated in Fig. 2.
Each cycle of the phase-folded X-ray light curve was fitted with a trapezoidal profile to locate the times of ingress and egress. No significant variability in the eclipse mid-time or duration are present, and the time of second to third contact is s, in reasonable agreement with the value of s obtained from optical photometry by O’Donoghue et al. (2003). This indicates that the eclipsed X-ray source is close to or coincident with the white dwarf photosphere.
2.2 EPIC Spectroscopy
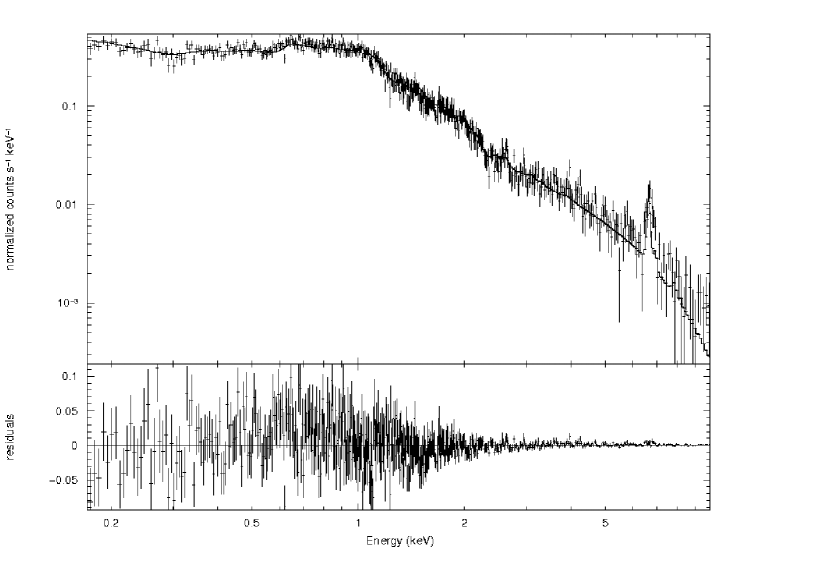
EPIC pn source photons were extracted from a circular region with a radius, while background was estimated from a surrounding annulus with an area of approximately ten times the source region. Intervals showing particularly high background were excluded from the analysis. The extracted EPIC pn spectrum, rebinned such that each channel contains at least 35 counts, is illustrated in Figure 3.
Mukai et al. (2003) and Pandel et al. (2005) have found that the X-ray spectra of CVs fall into two broad categories: optically-thin spectra resembling cooling flows; and spectra with a hard continuum exhibiting signatures of a photoionized plasma. Mukai et al. (2003) noted that the difference is likely to be associated with the accretion rate per unit area, with photoionization spectra belonging to magnetic systems with channeled accretion streams covering a small surface area, and optically-thin spectra coming from the accretion boundary layer of non-magnetic systems.
Cursory inspection of the EPIC spectrum of QS Vir reveals an optically-thin form not unlike that seen from active stellar coronae. This is reinforced by the few emission lines that could be discerned from the RGS spectra. We performed parameterized spectral modeling within the xspec program version 12 (Dorman & Arnaud, 2001), using multi-temperature optically-thin plasma radiative loss models and a cooling flow model. A fixed absorption of cm-2, corresponding to negligible interstellar X-ray absorption for this nearby object, was adopted for both models. For the multi-temperature plasma, we employed a two-temperature MEKAL model (a mélange of the models of Mewe et al. 1985 and Liedahl et al. 1995) in which the temperatures were allowed to vary freely but the metallicity parameter was forced to assume the same value for both components. The best-fit model had a minimum value of the reduced statistic of , with 520 degrees of freedom (dof). For the cooling flow, we employed the isobaric flow model with emission measure verses temperature scaled inversely to the cooling time at that temperature (Mushotzky & Szymkowiak, 1988) implemented as the MEKAL-based MKCFLOW model. No redshift was included, and with 520 dof was obtained with metallicity, minimum and maximum temperatures, and normalization as free parameters. The parameter estimation results are reported in Table 2 and the best-fit model is illustrated in Figure 3. At face value, the cooling flow model describes the data slightly better than the two-temperature one, though we caution that systematic uncertainties in the model and instrument response are not included in the analysis.
3 Discussion
3.1 Accretion
The detection of clear, sharp X-ray eclipses phased with the optical eclipses provides an unambiguous indication of ongoing accretion in the QS Vir system. From the EPIC spectrum, we find the total X-ray luminosity in the 0.5–10 keV range to be erg s-1. The source exhibits non-flaring variability at a level of about 20%. Based on the parameters of O’Donoghue et al. (2003), the bolometric luminosity of the M dwarf is erg s-1, and the ratio of X-ray to bolometric luminosity is —comparable with the canonical empirical “saturation” value of found for the most active stars (e.g. Pizzolato et al., 2003) and typical of the pre-cataclysmic binaries and rapidly rotating M dwarfs in the solar neighborhood studied by Briggs et al. (2007).
If QS Vir is a semi-detached system, the accretion rate obtained from the cooling flow model, yr-1, is among the lowest ever found for a CV. Lynden-Bell & Pringle (1974) showed that approximately half of the gravitational energy of the accreting gas is liberated through optical and UV radiation in a viscously-heated accretion disk and the other half is dissipated largely in the form of X-rays in a “boundary layer”, where the disk material is decelerated from its Keplerian velocity to the rotation velocity of the white dwarf. The expected X-ray luminosity from a disk boundary layer is then . Using and (O’Donoghue et al., 2003), the boundary layer luminosity is erg s-1, which is reasonably consistent with that observed. If the radiative dissipation of viscous heating amounts to a similar luminosity in the UV and optical, it would be inconspicuous in comparison to the white dwarf luminosity of erg s-1 ( K; O’Donoghue et al. 2003) as expected.
3.2 Roche lobe overflow or just a wind?
3.2.1 Difficulties with Roche lobe overflow
Accreting gas could originate either from the wind of the red dwarf, or from Roche Lobe overflow. O’Donoghue et al. (2003), Ribeiro et al. (2010), and Parsons et al. (2011) all found evidence for material within the Roche lobe of the white dwarf. O’Donoghue et al. (2003) suggest this might be associated with an accretion stream, while Ribeiro et al. (2010) favored wind accretion because photometric modeling suggested the M dwarf did not fill its Roche Lobe. Parsons et al. (2011) suggested the presence of significant prominence material.
An additional problem with Roche lobe overflow for QS Vir is that this should lead to formation of an accretion disk. At low accretion rates a disk can be more optically-thin and still render relatively strong disk emission lines, but no observable signatures of a disk have been detected. Since our observed mass accretion rate exceeds the total solar wind mass loss rate () by an order of magnitude, one crucial question to decide between accretion mechanisms is whether the mass loss rate of the M dwarf component of QS Vir is sufficient to supply this flow through a wind alone.
3.2.2 Insufficient wind supply?
QS Vir is in some respects similar to the “pre-polars”—magnetic (G) pre-CVs that do not appear to fill their Roche lobes yet show signs of accretion activity at low mass transfer rates. Accretion on these systems is thought to be through magnetic capture of the secondary wind with a wind accretion efficiency of the order of 100% (e.g., Schwope et al. 2002; Schmidt et al. 2005; see also, e.g., Li et al. 1994; Webbink & Wickramasinghe 2005). Accretion rates in the range –yr-1 with no apparent dependence on orbital period or secondary spectral type have been found for several systems (e.g. Schwope et al., 2002; Schmidt et al., 2005, 2007; Vogel et al., 2011). These rates are significantly higher than wind accretion on non-magnetic pre-CV systems where magnetic capture is not expected to operate. Total mass loss rates for M dwarfs in close non-contact binaries with non-magnetic white dwarfs of – yr-1 have been estimated based on the gravitational settling time of wind-accreted metals (e.g. Debes, 2006; Tappert et al., 2011). Schmidt et al. (2007) argue that the pre-polar accretion rates could provide the first realistic measurements of stellar mass loss at the cool end of the main sequence. Single M dwarf mass loss rates have otherwise been notoriously difficult to pin down; see, e.g., Wargelin & Drake (2002) for a detailed discussion. Wargelin & Drake (2002) used astrospheric change exchange X-ray emission to place an upper limit of yr-1 for the moderately active M5.5 dwarf Proxima, while Wood et al. (2002) found yr-1 from Ly observations. Both of these are reasonably consistent with the rates estimated for pre-polars.
The wind mass loss rate required to feed the observed yr-1 accretion rate on QS Vir depends on its accretion efficiency. In absence of detailed magnetohydrodynamic accretion simulations this efficiency must be considered unknown. Exploratory MHD wind models for detached pre-CV systems by Cohen et al. (2012) find accretion efficiencies depend quite sensitively on the WD and donor magnetic field strengths and on their orbital separation. We can rule out QS Vir being a pre-polar with a strongly magnetized WD based on the absence of any Zeeman broadening or splitting of the Balmer lines or cyclotron emission features in the spectra illustrated by O’Donoghue et al. (2003), Ribeiro et al. (2010) and Parsons et al. (2011). The cores of the Balmer lines in QS Vir are dominated by emission, which would obscure any small Zeeman splittings and defines an upper limit to the possible field strength. Based on the Å width of the emission cores in the spectra illustrated in Figure 1 of Parsons et al. (2011), and using Equation 11 from Wickramasinghe & Ferrario (2000) for a white dwarf temperature of 14200 K (O’Donoghue et al., 2003), we estimate kG. Adding some allowance for Stark broadening hiding a slightly higher field, we find a conservative limit of MG. Such a limit is also consistent with the absence of cyclotron emission features, which are prominent in pre-polars with even lower accretion rates than QS Vir (e.g. Schmidt et al., 2007). Cohen et al. (2012) did find one pre-CV configuration for a WD field G in which the accretion rate approached 100% of that of a single M star wind by an efficient “siphoning” of plasma from the hemisphere facing the WD, but this finding needs to be confirmed by more detailed simulations. The field would need to be of order G to capture all the wind of the M dwarf, and the accretion efficiency is then unlikely to be close to 100% for QS Vir.
An order of magnitude estimate of the pure hydrodynamic accretion efficiency can be made from the Bondi & Hoyle (1944) recipe
| (1) |
where the wind density, , as a function of radial distance in the vicinity of the white dwarf at orbital separation, , for a wind mass loss rate at velocity is
| (2) |
Combining Eqns. 1 and 2, and assuming the wind velocity is approximately the escape velocity, , (as is the case for the solar wind), the accretion rate is
| (3) |
where the first term on the right is the accretion efficiency. The orbital separation, , from the parameters in §2 is and the accretion efficiency is 0.09. Considering the accretion rate derived for QS Vir from the one-dimensional cooling flow model is likely a lower limit, the wind mass loss rate required to feed the accretion is then at least yr-1—an order of magnitude larger than implied for the M dwarfs of the pre-polars. For a typical velocity of 600 km s-1, this wind would require % of the stellar bolometric luminosity to drive which we consider uncomfortably high.
Qian et al. (2010) interpreted a residual period decrease of QS Vir with respect to their ephemeris solution that included a giant planet as angular momentum loss from a wind with an even higher mass loss rate of yr-1. Massive winds, up to yr-1, were argued earlier by Mullan et al. (1992) based on thermal escape arguments together with weak evidence of infrared wind free-free emission (see also Badalyan & Livshits 1992). More recently, Vidotto et al. (2011) predicted a similarly massive wind for the M4 dwarf V374 Peg from magnetohydrodynamic modeling, with a ram pressure 5 orders of magnitude larger than the solar wind. However, such massive winds can be readily dismissed on energetic grounds. For a terminal velocity of km s-1, the kinetic power of the wind suggested by Qian et al. (2010) is erg s-1—an implausibly large fraction (10%) of the M dwarf luminosity. Similarly, the wind of Vidotto et al. (2011) corresponds to an unphysical erg s-1 of kinetic energy when compared with the underlying stellar bolometric luminosity of erg s-1 (Morin et al., 2008). Lim & White (1996) had pointed out earlier that such massive winds would be opaque to radio emission which is commonly observed from active late-type stars, and deduced that mass loss rates can be no larger than 1-2 orders of magnitude above the solar rate. For QS Vir, the need for such a massive wind is obviated by the additional period measurements of Parsons et al. (2010), who instead invoked a third body with a minimum mass of in an elliptical orbit, together with the activity-related quadrupole coupling mechanism of Applegate (1992), to explain the period variations. Parsons et al. (2010) noted evolutionary difficulties for the presence of such a body, though it and the secular period evolution are not of any obvious relevance for understanding the pre-CV evolutionary status, parameters and accretion rate of QS Vir. A further unexplored connection cannot of course be ruled out.
The kinetic power of the solar wind, erg s-1, is similar to the mean observed radiative power of the corona (e.g. Peres et al., 2000). Schwadron et al. (2006) argued that the energy available to drive the solar wind scales with the basal open magnetic field strength. Combining this with an observed, almost linear, correlation between X-ray radiance and surface magnetic flux (Pevtsov et al., 2003), the expectation would be for stellar wind mass loss rate to scale with X-ray luminosity. Wood et al. (2002) estimated mass loss rates for a handful of different stars of different activity using astrospheric Ly absorption, and found , where is the surface X-ray flux. Scaling to the observed surface X-ray flux of QS Vir yields yr-1—consistent with our estimated accretion requirement. However, there also exist no measurements for stars at the saturated activity level of QS Vir and Wood et al. (2002) caution against extrapolating the relation. Proxima also does not support the relation, with a wind upper limit from Ly absorption lying an order of magnitude below the predicted value.
In summary, for an assumed wind accretion efficiency of the order of 10%, the preponderance of more direct assessments of the likely wind mass loss rates of active M dwarfs like the secondary of QS Vir, in particular those for the pre-polars, suggest it would not be sufficient to feed the observed accretion rate.
3.2.3 Chromospheric mass supply in a rare evolutionary phase?
An alternative to catastrophically energetic wind or accretion efficiency requirements is surface activity that does not lead to mass loss in single stars. Parsons et al. (2011) suggested prominence activity could be responsible for material within the Roche lobe of the white dwarf. Such activity is stochastic and might be expected to result in highly variable X-ray emission. The X-ray luminosity found here from XMM-Newton observations, erg s-1, is about a factor of two lower than that measured in the RASS ( erg s-1)—perhaps suggestive of moderate accretion variability though flaring on the M dwarf cannot be ruled out.
A more constant, lower lying, source is upward chromospheric spicule and mottle flow. In the solar chromosphere and transition region this flow corresponds to a mass flux two orders of magnitude larger than is launched in the solar wind (e.g. Campos, 1984; Tsiropoula & Tziotziou, 2004). The flow has a typical scale height of km and falls back to the solar surface, but might more easily succeed in escaping the Roche surface of a star on the verge of Roche lobe overflow to become readily unbound to the M dwarf and available to be swept up by the lobe of the white dwarf. Such a mass flow source would only become available for a near lobe-filling system. Following, e.g., King & Kolb (1995), the timescale for evolution through such a chromospherically-fed phase is
| (4) |
where is the chromospheric scale height, the system angular momentum and its time derivative. For a chromospheric temperature of K, the ratio , though for spicules this height is an order of magnitude greater. Adopting the Skumanich (1972)-based Verbunt & Zwaan (1981) spin-down prescription modified by Rappaport et al. (1983)
| (5) |
with and where
| (6) |
we find a timescale yr for the chromospheric scale height and yr for spicules. The implication of this short timescale is that chromospheric mass supply would occur only in a rare, fleeting episode of evolution.
4 Conclusions and the nature of QS Vir
X-ray spectrophotometry of QS Vir betrays ongoing accretion at a rate of yr-1. The slow rotation of the white dwarf diagnosed by Parsons et al. (2011) argues against a hibernating system, and QS Vir is most likely at the first onset of significant accretion. QS Vir then represents a valuable object to probe the very earliest stages of CV evolution. At face value, the observed accretion rate implies Roche lobe overflow and a semi-detached system. A pure wind accretion alternative would imply a wind mass loss rate of yr-1 for a Bondi-Hoyle accretion efficiency of 10%. For a typical velocity of 600 km s-1, this wind would require 1% of the stellar bolometric luminosity to drive. While plausible, we consider such a massive and energetic wind unlikely. If QS Vir is still detached, as the analysis of Ribeiro et al. (2010) implies, accreted mass could be supplied by prominence activity (Parsons et al., 2011), though such stochastic activity would likely lead to highly variable X-ray emission. The X-ray luminosity observed by XMM-Newton is a factor of two lower than that seen in the RASS and weakly supports this idea. We further speculate here that upward chromospheric mass flow analogous to solar spicules and mottles that escapes the Roche surface to be swept up by the white dwarf would present a more constant mass supply. Such a supply would become available for about million years or so prior to Roche lobe overflow and QS Vir would then be in a very interesting, fleeting evolutionary phase.
References
- Anders & Grevesse (1989) Anders, E., & Grevesse, N. 1989, Geochim. Cosmochim. Acta, 53, 197
- Applegate (1992) Applegate, J. H. 1992, ApJ, 385, 621
- Badalyan & Livshits (1992) Badalyan, O. G., & Livshits, M. A. 1992, Soviet Ast., 36, 70
- Barnes (2003) Barnes, S. A. 2003, ApJ, 586, 464, arXiv:astro-ph/0303631
- Bondi & Hoyle (1944) Bondi, H., & Hoyle, F. 1944, MNRAS, 104, 273
- Briggs et al. (2007) Briggs, K. R., Napiwotzki, R., Maxted, P. F. L., & Wheatley, P. J. 2007, in Astronomical Society of the Pacific Conference Series, Vol. 372, 15th European Workshop on White Dwarfs, ed. R. Napiwotzki & M. R. Burleigh, 497–+
- Campos (1984) Campos, L. M. B. C. 1984, MNRAS, 207, 547
- Cohen et al. (2012) Cohen, O., Drake, J. J., & Kashyap, V. L. 2012, ArXiv e-prints, 1201.0998
- Debes (2006) Debes, J. H. 2006, ApJ, 652, 636, arXiv:astro-ph/0608030
- den Herder et al. (2001) den Herder, J. W. et al. 2001, A&A, 365, L7
- Dorman & Arnaud (2001) Dorman, B., & Arnaud, K. A. 2001, in Astronomical Society of the Pacific Conference Series, Vol. 238, Astronomical Data Analysis Software and Systems X, ed. F. R. Harnden Jr., F. A. Primini, & H. E. Payne, 415–+
- Howell et al. (2010) Howell, S. B., Harrison, T. E., Szkody, P., & Silvestri, N. M. 2010, AJ, 139, 1771, 1002.3428
- Ivanova & Taam (2003) Ivanova, N., & Taam, R. E. 2003, ApJ, 599, 516, arXiv:astro-ph/0308361
- Jansen et al. (2001) Jansen, F. et al. 2001, A&A, 365, L1
- Kawaler (1988) Kawaler, S. D. 1988, ApJ, 333, 236
- Kawka et al. (2002) Kawka, A., Vennes, S., Koch, R., & Williams, A. 2002, AJ, 124, 2853
- Kilkenny et al. (1997) Kilkenny, D., Koen, C., O’Donoghue, D., & Stobie, R. S. 1997, MNRAS, 285, 640
- King & Kolb (1995) King, A. R., & Kolb, U. 1995, ApJ, 439, 330
- Kraft et al. (1962) Kraft, R. P., Mathews, J., & Greenstein, J. L. 1962, ApJ, 136, 312
- Li et al. (1994) Li, J. K., Wu, K. W., & Wickramasinghe, D. T. 1994, MNRAS, 268, 61
- Liedahl et al. (1995) Liedahl, D. A., Osterheld, A. L., & Goldstein, W. H. 1995, ApJ, 438, L115
- Lim & White (1996) Lim, J., & White, S. M. 1996, ApJ, 462, L91+
- Lynden-Bell & Pringle (1974) Lynden-Bell, D., & Pringle, J. E. 1974, MNRAS, 168, 603
- Mason et al. (2001) Mason, K. O. et al. 2001, A&A, 365, L36, arXiv:astro-ph/0011216
- Mestel (1968) Mestel, L. 1968, MNRAS, 138, 359
- Mewe et al. (1985) Mewe, R., Gronenschild, E. H. B. M., & van den Oord, G. H. J. 1985, A&AS, 62, 197
- Morin et al. (2008) Morin, J. et al. 2008, MNRAS, 384, 77, 0711.1418
- Mukai et al. (2003) Mukai, K., Kinkhabwala, A., Peterson, J. R., Kahn, S. M., & Paerels, F. 2003, ApJ, 586, L77, arXiv:astro-ph/0301557
- Mullan et al. (1992) Mullan, D. J., Doyle, J. G., Redman, R. O., & Mathioudakis, M. 1992, ApJ, 397, 225
- Mushotzky & Szymkowiak (1988) Mushotzky, R. F., & Szymkowiak, A. E. 1988, in NATO ASIC Proc. 229: Cooling Flows in Clusters and Galaxies, ed. A. C. Fabian, 53–62
- O’Donoghue et al. (2003) O’Donoghue, D., Koen, C., Kilkenny, D., Stobie, R. S., Koester, D., Bessell, M. S., Hambly, N., & MacGillivray, H. 2003, MNRAS, 345, 506, arXiv:astro-ph/0307144
- Paczyński (1967) Paczyński, B. 1967, Acta Astron., 17, 287
- Paczynski (1976) Paczynski, B. 1976, in IAU Symposium, Vol. 73, Structure and Evolution of Close Binary Systems, ed. P. Eggleton, S. Mitton, & J. Whelan, 75–+
- Pandel et al. (2005) Pandel, D., Córdova, F. A., Mason, K. O., & Priedhorsky, W. C. 2005, ApJ, 626, 396, arXiv:astro-ph/0503114
- Parsons et al. (2010) Parsons, S. G. et al. 2010, MNRAS, 407, 2362, 1005.3958
- Parsons et al. (2011) Parsons, S. G., Marsh, T. R., Gänsicke, B. T., & Tappert, C. 2011, MNRAS, 412, 2563, 1011.5235
- Peres et al. (2000) Peres, G., Orlando, S., Reale, F., Rosner, R., & Hudson, H. 2000, ApJ, 528, 537
- Pevtsov et al. (2003) Pevtsov, A. A., Fisher, G. H., Acton, L. W., Longcope, D. W., Johns-Krull, C. M., Kankelborg, C. C., & Metcalf, T. R. 2003, ApJ, 598, 1387
- Pizzolato et al. (2003) Pizzolato, N., Maggio, A., Micela, G., Sciortino, S., & Ventura, P. 2003, A&A, 397, 147
- Qian et al. (2010) Qian, S., Liao, W., Zhu, L., Dai, Z., Liu, L., He, J., Zhao, E., & Li, L. 2010, MNRAS, 401, L34
- Rappaport et al. (1983) Rappaport, S., Verbunt, F., & Joss, P. C. 1983, ApJ, 275, 713
- Ribeiro et al. (2010) Ribeiro, T., Kafka, S., Baptista, R., & Tappert, C. 2010, AJ, 139, 1106, 0912.0912
- Schmidt et al. (2007) Schmidt, G. D., Szkody, P., Henden, A., Anderson, S. F., Lamb, D. Q., Margon, B., & Schneider, D. P. 2007, ApJ, 654, 521, arXiv:astro-ph/0610818
- Schmidt et al. (2005) Schmidt, G. D. et al. 2005, ApJ, 630, 1037, arXiv:astro-ph/0505385
- Schwadron et al. (2006) Schwadron, N. A., McComas, D. J., & DeForest, C. 2006, ApJ, 642, 1173
- Schwope et al. (2002) Schwope, A. D., Brunner, H., Hambaryan, V., & Schwarz, R. 2002, in Astronomical Society of the Pacific Conference Series, Vol. 261, The Physics of Cataclysmic Variables and Related Objects, ed. B. T. Gänsicke, K. Beuermann, & K. Reinsch, 102
- Skumanich (1972) Skumanich, A. 1972, ApJ, 171, 565
- Strüder et al. (2001) Strüder, L. et al. 2001, A&A, 365, L18
- Tappert et al. (2011) Tappert, C., Gänsicke, B. T., Schmidtobreick, L., & Ribeiro, T. 2011, ArXiv e-prints, 1107.3586
- Tsiropoula & Tziotziou (2004) Tsiropoula, G., & Tziotziou, K. 2004, A&A, 424, 279
- Turner et al. (2001) Turner, M. J. L. et al. 2001, A&A, 365, L27, arXiv:astro-ph/0011498
- Verbunt & Zwaan (1981) Verbunt, F., & Zwaan, C. 1981, A&A, 100, L7
- Vidotto et al. (2011) Vidotto, A. A., Jardine, M., Opher, M., Donati, J. F., & Gombosi, T. I. 2011, MNRAS, 412, 351, 1010.4762
- Vogel et al. (2011) Vogel, J., Schwope, A. D., & Schwarz, R. 2011, A&A, 530, A117+
- Voges et al. (1999) Voges, W. et al. 1999, A&A, 349, 389, arXiv:astro-ph/9909315
- Wargelin & Drake (2002) Wargelin, B. J., & Drake, J. J. 2002, ApJ, 578, 503
- Webbink & Wickramasinghe (2005) Webbink, R. F., & Wickramasinghe, D. T. 2005, in Astronomical Society of the Pacific Conference Series, Vol. 330, The Astrophysics of Cataclysmic Variables and Related Objects, ed. J.-M. Hameury & J.-P. Lasota, 137
- Weber & Davis (1967) Weber, E. J., & Davis, Jr., L. 1967, ApJ, 148, 217
- Wickramasinghe & Ferrario (2000) Wickramasinghe, D. T., & Ferrario, L. 2000, PASP, 112, 873
- Wood et al. (2002) Wood, B. E., Müller, H., Zank, G. P., & Linsky, J. L. 2002, ApJ, 574, 412, arXiv:astro-ph/0203437
| Instrument | Exp. Time | Mode | Filter | Obs. Start Time |
|---|---|---|---|---|
| [ksec.] | ||||
| RGS1 | 109.5 | Spectroscopy | 2006-01-25@18:13:37 | |
| RGS2 | 109.5 | Spectroscopy | 2006-01-25@18:13:42 | |
| MOS1 | 109.0 | Small Window | medium | 2006-01-25@18:14:51 |
| MOS2 | 108.9 | Small Window | medium | 2006-01-25@18:14:51 |
| pn | 109.3 | Small Window | medium | 2006-01-25@18:20:24 |
| OM | 17.6 | Fast Mode | U | 2006-01-25@18:20:22 |
| ” | 17.6 | Fast Mode | U | 2006-01-26@00:53:50 |
| ” | 21.8 | Fast Mode | U | 2006-01-26@07:57:18 |
| ” | 21.7 | Fast Mode | U | 2006-01-26@14:28:41 |
| ” | 21.7 | Fast Mode | U | 2006-01-26@20:57:59 |
| COOLING FLOW | 2-TEMPERATURE | ||
|---|---|---|---|
| Parameter | Best-fit | Parameter | Best-fit |
| NH (cm-2)aaParameter held fixed. | 1018 | NH (cm-2)aaParameter held fixed. | 1018 |
| low T (keV) | kT1 (keV) | ||
| high T (keV) | kT2 (keV) | ||
| MetallicitybbExpressed as a fraction of the solar metal abundances listed by Anders & Grevesse (1989) | MetallicitybbExpressed as a fraction of the solar metal abundances listed by Anders & Grevesse (1989) | ||
| (/yr) | EM1 ( cm-3)ccAssuming a distance of 48 pc (O’Donoghue et al., 2003) | ||
| EM2 ( cm-3)ccAssuming a distance of 48 pc (O’Donoghue et al., 2003) | |||