Discovery of hard-spectrum -ray emission from the BL Lac object 1ES 0414009
Abstract
Context. 1ES 0414009 ( = 0.287) is a distant high-frequency-peaked BL Lac object, and has long been considered a likely emitter of very-high-energy (VHE, 100 GeV) -rays due to its high X-ray and radio flux.
Aims. Observations in the VHE -ray band and across the electromagnetic spectrum can provide insights into the origin of highly energetic particles present in the source and the radiation processes at work. Because of the distance of the source, the -ray spectrum might provide further limits on the level of the Extragalactic Background Light (EBL).
Methods. We report observations made between October 2005 and December 2009 with H.E.S.S., an array of four imaging atmospheric Cherenkov telescopes. Observations at high energies (HE, 100 MeV – 100 GeV) with the Fermi-LAT instrument in the first 20 months of its operation are also reported. To complete the multi-wavelength picture, archival UV and X-ray observations with the Swift satellite and optical observations with the ATOM telescope are also used.
Results. Based on the observations with H.E.S.S., 1ES 0414009 is detected for the first time in the VHE band. An excess of 224 events is measured, corresponding to a significance of 7.8. The photon spectrum of the source is well described by a power law, with photon index of = . The integral flux above 200 GeV is () cm-2 s-1. Observations with the Fermi-LAT in the first 20 months of operation show a flux between 200 MeV and 100 GeV of (2.3 0.2stat) 10-9 , and a spectrum well described by a power-law function with a photon index = 1.85 0.18. Swift/XRT observations show an X-ray flux between 2 and 10 keV of () 10-11 , and a steep spectrum . Combining X-ray with optical-UV data, a fit with a log-parabolic function locates the synchrotron peak around 0.1 keV.
Conclusions. Although the GeV-TeV observations do not provide better constraints on the EBL than previously obtained, they confirm a low density of the EBL, close to the lower limits from galaxy counts. The absorption-corrected HE and VHE -ray spectra are both hard and have similar spectral indices (), indicating no significant change of slope between the HE and VHE -ray bands, and locating the -ray peak in the SED above 1-2 TeV. As for other TeV BL Lac objects with the -ray peak at such high energies and a large separation between the two SED humps, this average broad-band SED represents a challenge for simple one-zone synchrotron self-Compton models, requiring a high Doppler factor and very low B-field.
Key Words.:
gamma rays: observations – Galaxies : active – Galaxies : jets – BL Lacertae objects: individual objects: 1ES 04140091 Introduction
The BL Lac object 1ES 0414009 was first detected with the HEAO 1 satellite (Gursky et al. 1978) in the energy range 0.2 keV–10 MeV, and identified in Einstein Observatory X-ray images (Giacconi et al. 1979). On the basis of the original X-ray, optical and radio observations, it was identified as a probable BL Lac object by Ulmer et al. (1983). Located at a redshift of = 0.287 (Halpern et al. 1991), 1ES 0414009 harbours a super-massive black hole of mass (Falomo et al. 2003). The host galaxy is classified as elliptical, with absolute magnitude (Falomo et al. 2003). Polarization measurements by Impey & Tapia (1988) confirmed the classifications of this source as a BL Lac object. According to the classification scheme of Padovani & Giommi (1995), 1ES 0414009 belongs to the class of high-frequency-peaked BL Lac (HBLs), objects with a synchrotron-emission peak located at UV/soft-X-ray frequencies, or equivalently, sources for which the X-ray emission is dominated by synchrotron radiation.
There are several archival measurements of the spectral properties of 1ES 0414009 in X-rays taken using ASCA (Kubo et al. 1998), ROSAT (Brinkmann et al. 1995), and BeppoSAX (Beckmann et al. 2002). Observations with EXOSAT (Giommi et al. 1990; Sambruna et al. 1994) showed evidence of temporal variability and strong spectral variations, at times having an X-ray photon index of . During these states 1ES 0414009 is characterized by a SED typical of “extreme” BL Lac objects (i.e. objects with the synchrotron peak above a few keV, Costamante et al. 2001). In the VHE -ray domain, the data from the HEGRA experiment were used to derive an upper limit on the flux for this source corresponding to 13.5 cm-2 s-1 above 910 GeV (Aharonian et al. 2000). 1ES 0414009 was considered a good candidate for VHE emission by Costamante & Ghisellini (2002), on the basis of a high X-ray and radio flux, and its detection was yet more likely after blazar -ray spectra indicated a low intensity of the diffuse EBL (Aharonian et al. 2006a).
Based on these VHE estimates, observations of 1ES 0414009 with H.E.S.S. began in 2005 and continued until 2009, and significant observing time was dedicated to its detection, because its high redshift made this source a potentially interesting candidate for EBL studies. In Sect. 2 the analysis of the 5-year data set on 1ES 0414009 collected by the H.E.S.S. collaboration is reported. In the high-energy -ray domain, emission from 1ES 0414009 was first detected by the Large Area Telescope (LAT) on the Fermi -ray space telescope (Atwood et al. 2009). 1ES 0414009 was detected with a significance of in the first 11 months of the Fermi-LAT operation and is listed in the first year (Abdo et al. 2010a) and second year (Abdo et al. 2011) Fermi catalogues. In Sect. 3 the 20 month Fermi-LAT observation of 1ES 0414009 is reported. The -ray observations have been complemented with measurements in X-ray and UV, carried out using the Swift/XRT and UVOT instruments (Burrows et al. 2005; Roming et al. 2005). These, together with the optical measurements from the ATOM telescope (Hauser et al. 2004) are presented. Constraints on the EBL are discussed in Sect. 4, and finally, the spectral energy distribution (SED) of 1ES 0414009 is presented in Sect. 5.
In this paper the luminosity distance of the source, located at a redshift = 0.287 is computed with the standard CDM cosmological model ( = 71 kmsMpc, = 0.73, = 0.27), yielding a luminosity distance = 1469.3 Mpc.
2 VHE -ray observations with H.E.S.S.
H.E.S.S. is an array of four imaging atmospheric Cherenkov telescopes situated in the Khomas highland of Namibia ( south, east), at an elevation of 1800 metres above sea level (see Aharonian et al. 2006b). The H.E.S.S. array is sensitive to -rays above 100 GeV, and commonly achieves an event-by-event angular resolution of 0.1∘ and a relative energy resolution of 15%.
The BL Lac 1ES 0414009 was observed every year between 2005 and 2009. After run-quality selection the data set comprises 73.7 hours (live time) of observations, of which 67.5 hours were taken with four telescopes. Observations have been carried out at zenith angles of 22∘ to 41∘ with a mean value of 26∘. The pointing offset from 1ES 0414009 was 0.5∘. The data were analysed with the Model Analysis (de Naurois & Rolland 2009), in which shower images of all triggered telescopes are compared to a precalculated model by means of a log-likelihood minimisation. The analysis has been cross-checked with a multivariate analysis (Ohm et al. 2009) using an independent calibration, which yielded consistent results.
Two sets of cuts were used. For the source-detection analysis standard cuts were used, including a minimum image charge of 60 photoelectrons (energy threshold Eth = 220 GeV, defined here as the energy at which the effective area falls to 10% of its maximum value). Loose cuts, with a smaller charge cut of 40 photoelectrons, result in a decreased signal-to-background ratio but have the advantage of higher photon statistics and a lower threshold of 150 GeV. Since 1ES 0414009 is a very faint and distant source, loose cuts were used for the spectral analysis and light curve generation 111In this case the loose cuts almost double the number of excess events resulting in a poorer background rejection.. Therefore, in this text all the fluxes and light curves shown are derived with loose cuts.
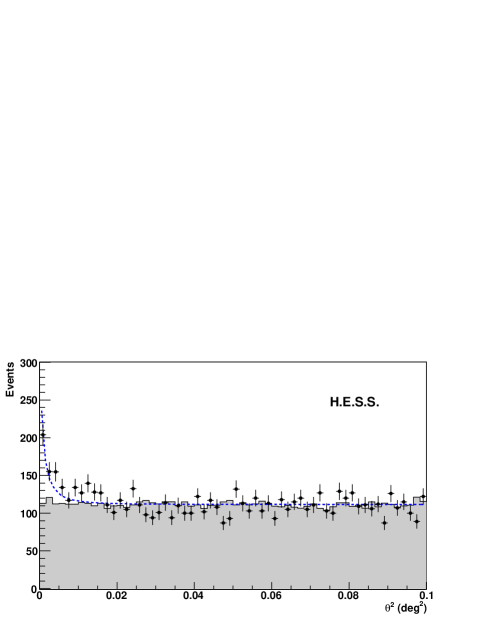
A significant excess of 224 events (7.8) from the direction of 1ES 0414009 was found in the total data set using standard cuts. A year-by-year summary of the observations and of the corresponding results is shown in Table 1. The background subtracted distribution of the square of the angular difference between the reconstructed shower position and the nominal source position () is shown in Fig. 1. The Reflected-Region method (Berge et al. 2007) was used for the definition of the ON-source and OFF-source data regions. The distribution is consistent with that of a point-like source, as shown in Fig. 1
| Epoch | MJDstart | MJDstop | Live-time[h] | ON | OFF | Excess | Sig[ | (200 GeV) (∗) | ndf (∗∗) | () (∗∗) |
|---|---|---|---|---|---|---|---|---|---|---|
| 10-12 cm-2 s-1 | ||||||||||
| 2005 | 53646.06 | 53706.97 | 15.2 | 162 | 1474 | 44.9 | 3.8 | 2.160.41 | 20.516 | 0.20 |
| 2006 | 54024.03 | 54120.82 | 11.4 | 189 | 1834 | 43.3 | 3.3 | 1.190.51 | 10.512 | 0.57 |
| 2007 | 54406.98 | 54475.84 | 12.9 | 150 | 1541 | 28.1 | 2.4 | 1.730.46 | 13.911 | 0.24 |
| 2008 | 54736.09 | 54750.10 | 9.1 | 117 | 1160 | 25.1 | 2.4 | 1.370.62 | 2.58 | 0.96 |
| 2009 | 55067.14 | 55158.97 | 25.2 | 289 | 2602 | 82.8 | 5.2 | 1.860.41 | 31.028 | 0.32 |
| Total | 73.7 | 907 | 8611 | 224.3 | 7.8 | 1.840.20 | 2.664 | 0.62 |
-
(∗)
Derived with loose cuts and with the spectral index fixed to the global value .
-
(∗∗)
Night-by-night and year-by-year light curves are derived with loose cuts.
The fit of the uncorrelated excess map with a two-dimensional point-like function convolved with the instrument point spread function PSF (68% containment radius of 0.064∘ for standard cuts) also indicates that the source is consistent with being point-like and is located at (=, =1). This position is consistent with the nominal position (=, ) reported by Ulmer et al. (1983).
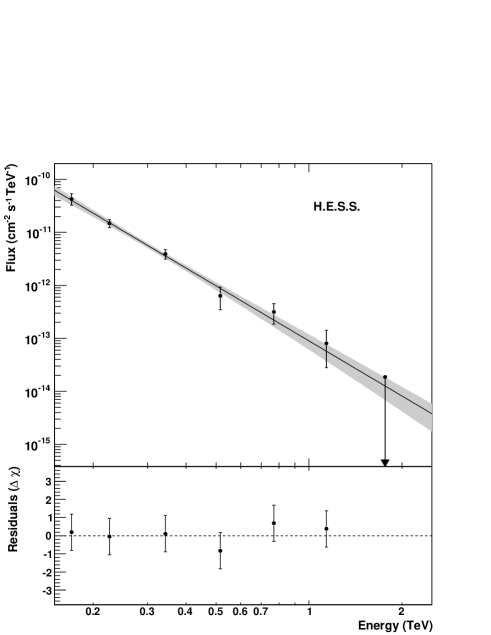
Fig. 2 shows the differential energy spectrum of the VHE -ray emission above the energy threshold of 150 GeV using the 530 excess events obtained with loose cuts. The spectrum is obtained using a forward-folding maximum-likelihood method, described by Piron et al. (2001). The spectrum is compatible with a power-law distribution (d/d) with a photon index of ; the differential flux at the decorrelation energy of 305 GeV is () cm-2 s-1 TeV-1. In Fig.2 the confidence band of the power-law fit for 1ES 0414009 is illustrated, clearly steep in appearance and affected by EBL absorption. The spectral points (with 1 statistical errors) in the upper panel in Fig. 2 are derived from the residuals in the different energy bins shown in the bottom panel in the same figure. The integral flux above 200 GeV is = () cm-2 s-1 and it corresponds to of the Crab Nebula flux above the same energy threshold (Aharonian et al. 2006b).
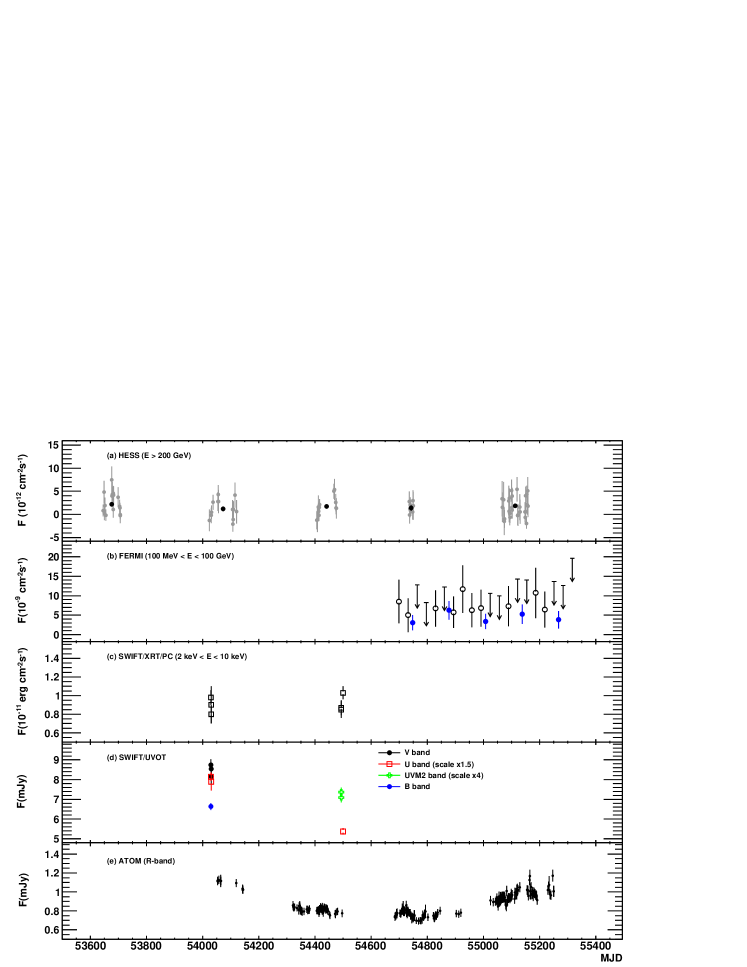
The light curves for 200 GeV with different time samplings have been derived with loose cuts, assuming the spectral index obtained by the maximum-likelihood fit (see the top panel in Fig. 3). No evidence of variability is found on different timescales. Accounting for both statistical and systematic (20%) uncertainties on the flux points, the fit of the night-by-night light curve with a constant value yields (for 79 degrees of freedom) with a corresponding probability P=0.41 and a 99% confidence level upper limit on the fractional variability 0.40 with defined as in Vaughan et al. (2003) (calculated with the method described in Feldman & Cousins 1998). The fit of the monthly light curve yields a for 12 degrees of freedom, with a corresponding probability of 0.1 and upper limit 0.76. The same conclusion is found on a yearly timescale, with a probability of a constant flux =0.62 and 99% confidence level upper limit 0.32.
Table 1 shows the measured integral flux for each year the source was observed. Also reported are the values for a fit of a constant when the flux is binned by nights within each year and by years within the total observation. As the probability for each fit is greater equal than 0.2 there is no evidence for variability in this data set.
3 Multi-wavelength observations
3.1 Gamma-ray observations with the Fermi LAT
The LAT is a pair-conversion telescope, and is the primary instrument of the Fermi satellite launched in June 2008. The Fermi-LAT instrument, described in detail in Atwood et al. (2009), detects rays with energies between 20 MeV and 300 GeV. The bulk of the Fermi observational program is dedicated to a survey, in which the full -ray sky is covered every 3 hours.
The spectrum of 1ES 0414009 in the 100 MeV to 100 GeV energy band222The analysis has been restricted to the energy range over which the response of the instrument is best understood. was derived from LAT data taken between August 4, 2008 and May 17, 2010 (651 days). To minimize background contamination, only events with a high probability of being rays, known as “DIFFUSE” events, having an angle of less than 105∘ to the Zenith, were retained. The spectrum was evaluated using an unbinned maximum likelihood approach (Mattox et al. 1996) in which the events originating within a region of interst (ROI) of 10∘ around 1ES 0414009 were modelled using diffuse Galactic and isotropic components and 17 point sources with power-law spectra. The diffuse components are tabulated in the standard files gll_iem_v02.fit and isotropic_iem_v02.txt, respectively; the overall normalization of each component was allowed to vary in the fit. The point sources include a test source at the location of 1ES 0414+009, all sources from the first Fermi catalogue (Abdo et al. 2010a) within 12∘ of 1ES 0414009 and three additional sources found in a dedicated search for additional -ray emission in the ROI. These additional sources are weak, with detection significances between and (approximately to 5.6), and all lie relatively far from 1ES 0414009 , the closest being separated by 333These additional sources are not associated with any point sources in 2FGL, however one is approximately two degrees from a 2FGL source marked as confused. It seems likely that they are the result of deficits in the galactic diffuse model that were eliminated in the improved model use in 2FGL.. For the brighter background sources the power-law spectral assumption was tested by evaluating a log parabolic model, which was found not to significantly improve the fit. In total the model had 30 free parameters444The spectral parameters for point sources formally outside the 10∘ ROI were fixed at their catalogue values (Abdo et al. 2010a). They were included in the model to account for the effects of the relatively large PSF at low energies.. The maximum likelihood optimization was performed using the standard Fermi ScienceTools package (v9r19p0), using the P6_V3_DIFFUSE instrument response functions (IRFs).
The null hypothesis, that no source is present at the location of 1ES 0414009, is rejected with for 2 degrees of freedom, or approximately . The best-fit power law has an integral flux of cm-2 s-1 (100 MeV to 100 GeV) and an index of . The differential flux at the decorrelation energy of 3.6 GeV is cm-2 s-1 MeV-1. The systematic errors on the index, estimated using the bracketing IRF method (Abdo et al. 2010b), in which the IRFs are modified to give the greatest change in the index of the best-fit power law, are .
The most energetic photon detected within a region of around the source was reconstructed with an energy of GeV. The energy resolution is less than for photons with GeV.
Variability in the flux of rays on monthly timescales was evaluated by producing a light curve with 32.5 day bins (second panel of Fig. 3, see Abdo et al. (2010a) for details of methodology). Comparing the likelihood of a model in which the flux in each time bin is free, to one where it is assumed constant gives a difference of for 19 extra degrees of freedom (DOF). The probability of getting a value of by chance is , assuming the theorem of Wilks (1938) is applicable, and we conclude that there is no evidence for variability on monthly timescales. Since there is a relatively large number of upper limits in the 32.5-day light curve, we rebinned the data to produce a 130-day light curve which is also shown in Fig. 3 (blue points). Applying the same variability test gives for 4 DOF, with a chance probability of , again consistent with no variability.
3.2 X-ray observations with the Swift/XRT
Archival Swift observations within the timespan of the overall H.E.S.S. observing campaign were analysed. Swift performed three snapshot observations in 2006, on October 21 (1138 ), 22 (226 ) and 23 (553 ), and three in 2008, two on January 29 (1008 and 993 ) and one on February 4 (2227 ).
The XRT data were processed with standard procedures using the FTOOLS task XRTPIPELINE (version 0.12.4). Only data taken in photon counting (PC) mode were considered, given the low rate of the source ( counts/s in the 0.3-10 keV range) and because the exposures in Window Timing mode were extremely short. Source events were extracted in the 0.310 keV range within a circle with a radius of 20 pixels (47″), while background events were extracted from both circular and annular regions around the source, free of other sources.
The spectra were fitted with a single power-law model with Galactic absorption fixed at cm-2, as obtained by dedicated 21 cm observations (Elvis et al. 1999). No significant flux or spectral variability was found within the 2006 or Jan 2008 data sets (the fit with a constant gives /ndf of 4.9/10 and 10.5/7, respectively, with a probability of 0.90 and 0.16). The corresponding exposures were thus summed, obtaining a total of three data sets for further analysis: the first covering the period October 21-23, 2006 (1916 ), the second for January 29 (2001 ), and the third for February 4, 2008 (2227 ).
To test the possible presence of spectral curvature, broken power-law and log-parabolic models were compared to the simple power-law hypothesis. The three spectra are well fitted by a single power law within the available statistics, with steep indices around 2.2–2.3 (see Table 2). Log-parabolic models do not significantly improve the (F-test85-95%). Variations among the different epochs are modest: both flux and spectra are similar between October 2006 and January 2008, while on Feb 4 the flux increases by 15%, but consistent within 1 sigma with other two epochs, with a slightly harder spectrum by . The light curve for the XRT observations is shown in Fig. 3.
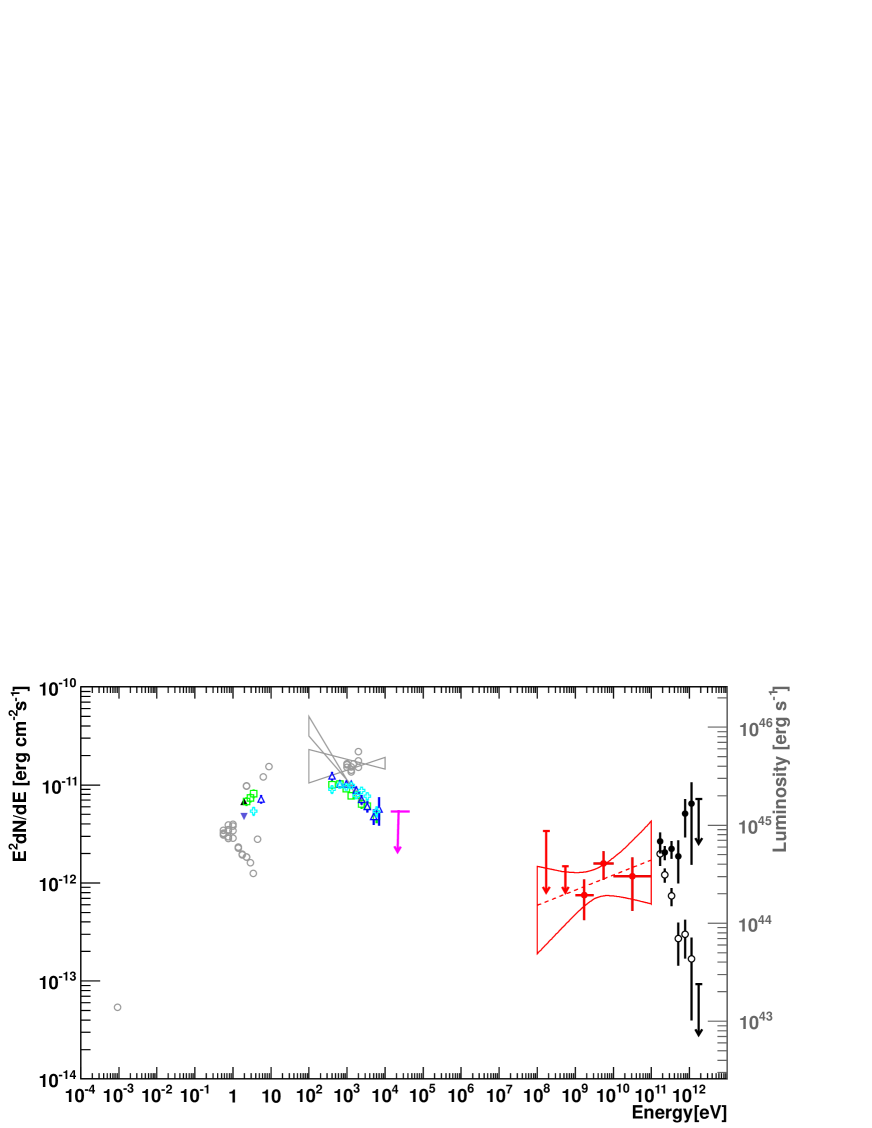
The Swift Burst Alert Telescope (BAT, Barthelmy et al. 2005) data from 2004 to 2010 were also analysed, following the procedure described in Ajello et al. (2008). The source presented only a marginal signal of 2.5 in the 14-30 keV band. The corresponding 99% upper limit on the flux is reported in the SED in Fig. 4, for reference.
| Quantity | 21-23 Oct 2006 | 29 Jan 2008 | 4 Feb 2008 | Units |
|---|---|---|---|---|
| 54029.04-54031.04 | 54494.23 | 54500.21 | MJD | |
| Single power-law fit, XRT data | ||||
| 1.0642 | 1.0022 | 0.8043 | ||
| UVOT filters, observed magnitudes(a) | ||||
| V | - | - | ||
| B | - | - | ||
| U | - | |||
| UVM2 | - | - | ||
| Log-parabola(b) fit, combined UVOT XRT data | ||||
| UVOT filters | B, U | UVM2 | U | |
| curvature | ||||
| keV | ||||
| 1.0143 | 0.8423 | 0.7944 | ||
-
Errors are reported at 90% confidence level for 1 parameter ().
-
(a)
Statistical errors from uvotsource analysis.
-
(b)
Log-parabola model is defined as: d/d
-
(c)
Value of the peak energy in the SED, obtained by fitting the same data with a different parameterization of the log-parabolic model, for which the free parameters are and (details in Tramacere et al. 2007).
3.3 Optical and UV observations with the Swift/UVOT
The UVOT instrument (Roming et al. 2005) took exposures in different filters during the XRT pointings, namely V (547 nm), B (439 nm), and U (347 nm) in October 2006, UVM2 (225 nm) in January 2008 and U in February 2008 (the observations are summarised in Table 2). Photometry of the source was performed using the UVOT software in the HEAsoft 6.9 package. Counts were extracted from the standard aperture of 5 radius for all single exposures and all filters, while the background was carefully estimated from different positions more than 27 away from the source. Count rates were then converted to fluxes using the standard photometric zero points (Poole et al. 2008).
The fluxes were de-reddened for Galactic absorption using the extinction curve from Cardelli et al. (1989) with the updates from O’Donnell (1994), assuming . This is the average value for the Galactic diffuse interstellar medium. For the line of sight of 1ES 0414009, a value of was used (Schlegel et al. 1998), with mag.
The host galaxy of 1ES 0414009 is elliptical, of total R magnitude 17.49 and half-light radius 4.7 (from HST snapshot observations, Scarpa et al. 2000). To isolate the flux of the active core the UVOT fluxes were corrected for the contribution of the host galaxy. The wavelength-dependent correction was determined using a template for elliptical galaxies (Silva et al. 1998), rescaled to the host-galaxy flux in the R band, and accounts for the given apertures.
As in the X-ray band, no significant variability was found in the UV band in October 2006, nor in January 2008 (see fourth panel in Fig. 3, where fluxes are reported without extinction correction). The individual frames were thus co-added, and the results are given in Table 2. A decrease by 0.5 mag can be noted between 2006 and February 2008, in the U filter (the only filter in common). This behaviour contradicts what observed in the X-ray band, where the corresponding XRT spectrum showed an increased flux and harder spectrum. This is indicative of a shift of the SED peak towards higher energies, which is confirmed by the simultaneous UVOT-XRT spectral fitting (see Sect. 4.1).
3.4 Optical observations with ATOM
The 75 cm optical telescope of the H.E.S.S. collaboration, ATOM, is located next to the Cherenkov telescopes at the H.E.S.S. site in Namibia. ATOM has been monitoring 1ES 0414009 since Nov 2006 with a sampling of 2 observations per week during its visibility from July to March.
During the H.E.S.S. observations of 1ES 0414009, the sampling was increased to obtain truly simultaneous data. The observations of this source were mostly carried out in B and R band (440 nm and 640 nm). On some of the nights, observations in V and I bands (550 nm and 790 nm) were also performed. The data analysis consists of debiassing, flat fielding and photometry using SExtractor (Bertin & Arnouts 1996) and was performed using the ATOM-specific pipeline processing (Hauser et al. 2004). The fluxes were determined using a 4 radius aperture and the flux scale was fixed on 7 nearby stars from the USNO catalogue (Fiorucci et al. 1998).
The night-by-night light curve of the ATOM observations with the R-filter is shown in the bottom panel of Fig. 3, where no Galactic extinction correction was considered. There is no strong variability in the light curve (the amplitude variations are less than 50% overall) but a long-term trend can be seen, with a minimum in 2008 with respect to the other years. No change in (B-R) colour was observed.
4 Combined spectral fits
4.1 UVOT and XRT spectral fits
To study the connection between the UV and X-ray components of the synchrotron emission, and to better estimate the position of its peak, a broad-band fit of the simultaneous UVOT and XRT data was performed in Xspec, using the UVOT response matrices in the calibration database. Only the B and UV filters were considered, to minimize the contamination from the host galaxy. In Xspec, Galactic reddening and X-ray absorption are taken into account using the models redden (updated with O’Donnell 1994) and wabs for the two bands, respectively.
The UV-to-X-ray broadband spectra in all three epochs are well represented by a single log-parabolic component (Table 2), with values of the curvature which are typical for HBLs: around 0.1–0.2 (Tramacere et al. 2007). The resulting estimate for the energy of the synchrotron peak is around 0.1 keV, overall, with a slight shift (at level) of the peak position from 0.07 to 0.17 keV between the 2006 and 2008 epochs. The corresponding flux at the synchrotron peak is steady around () 10-11 between 2006 and Jan 2008, decreasing slightly to ( 10-11 on Feb 4, 2008.
4.2 Fermi and H.E.S.S. spectral fits
By combining the Fermi and H.E.S.S. spectra it is possible to study the broadband properties of the -ray SED peak, once the effects of interactions with photons of the diffuse EBL are taken into account. At = 0.287, the intrinsic spectrum calculated from the VHE observations is strongly sensitive to the EBL density. Using the high EBL density given by direct estimates at 1-3 m (20 nWm2sr, see e.g. Aharonian et al. 2006a), the reconstructed spectrum is unrealistically hard (), but it softens to for lower EBL densities.
Considered independently of other spectral information, therefore, the H.E.S.S. spectrum of 1ES 0414009 further corroborates the upper limits on the EBL level previously derived from other HBLs (Aharonian et al. 2006a; Aharonian et al. 2007a, b), indicating a low density around 1-3 m close to the lower bound given by galaxy counts (Aharonian et al. 2006a). However, the measured spectrum of 1ES 0414009 does not improve those upper limits, nor their statistical uncertainty.
For example, comparing with 1ES 1101-232 () and performing the same analysis described in Aharonian et al. (2006a), where a scaled EBL spectral shape was used, a higher EBL scaling factor P is required in this case as compared to 1ES 1101-232 (P0.58 vs P0.55) in order to give the same estimated intrinsic spectral index. The higher redshift ( vs ) provides a longer path-length over which the effect of EBL absorption is integrated, thus giving a larger measurable effect of absorption of the intrinsic spectrum (i.e. a smaller difference in EBL flux is sufficient to yield the same observed ). This longer leverage, however, is not enough to compensate for the larger statistical error on the spectral slope (0.35 vs 0.15).
Therefore, the approach adopted here is to fix the EBL to the best current estimates (e.g. Franceschini et al. 2008; Dominguez et al. 2011), and to investigate the resulting SED properties. The EBL model assumed here (Franceschini et al. 2008) is close to the lower limits from galaxy counts and compatible with the limits from VHE observations (Aharonian et al. 2006a). With this model, both the Fermi and H.E.S.S. absorption-corrected spectra are harder than 2, indicating a high-energy peak above few TeV. Both spectra have the same index, within statistical errors ( vs ), indicating that the spectral properties do not change significantly between the HE and VHE bands. The typical uncertainty on the VHE spectral index due to the residual EBL uncertainty can be estimated to be in the range +0.15,0.3, scaling the Franceschini template between the level of galaxy counts and the current upper limits. A single power-law model provides a good representation of the combined Fermi and H.E.S.S. spectra from 1 GeV to 2 TeV, with index and = 4.7/7.
Because the H.E.S.S. observations overlap only partially in time with the Fermi data, variations in the flux could bias the combined spectral fitting of the average spectra towards harder or softer values. To quantify this, the Fermi average spectrum during the H.E.S.S. observing epochs (3.6 months) was compared to the total (20 months).
The differences are negligible with respect to the statistical errors (7%), and the confidence contours in the flux-index plane of the total data set are fully enclosed in the respective contours of the H.E.S.S. epoch. Thus, it is possible to conclude that no correction between the Fermi and H.E.S.S. spectra is necessary.
5 Discussion
The overall SED is shown in Fig. 4. Unfortunately, the X-ray pointings are not strictly simultaneous with the H.E.S.S. or Fermi observing epochs. (see Fig. 3). However, given the lack of strong variability in all the observed bands, it can be reasonably assumed that the ATOM, Swift, H.E.S.S. and Fermi data provide together a good representation of the average SED properties of the source over the time span of the observations,
These observations confirm 1ES 0414009 as a typical HBL, with a synchrotron peak around 0.1 keV and where the X-ray band is dominated by the synchrotron emission of high-energy electrons. The higher-energy component, which is commonly interpreted as inverse Compton (IC) emission from the same population of electrons responsible for the synchrotron emission, was largely unexplored before the observations reported here. The combined data indicate that a single, hard power law fits the intrinsic spectrum over the combined HE-VHE -ray ranges, constraining the peak of the IC emission to lie at energies greater than 1–2 TeV. Thus, 1ES 0414009 seems to belong to the subclass of HBLs characterized by Compton peak energies in the multi-TeV range, like 1ES 1101-232 (Aharonian et al. 2007b), 1ES 0347-121 (Aharonian et al. 2007a), 1ES 0229+200 (Aharonian et al. 2007c; Tavecchio et al. 2009), or 1ES 1218+304 (Acciari et al. 2009).
Such high energies for the IC peak are difficult to explain with a standard one-zone SSC model, due to the decrease in the scattering efficiency in the Klein-Nishina regime and the decrease in the energy density of the seed photons available for scatterings in the Thomson regime. Both these effects tend to steepen the emitted -ray spectrum at VHE. In principle it would be possible to avoid this steepening by assuming that the cooling of the electrons occurs only by IC scattering in the deep Klein-Nishina regime (for example, off a black-body-like spectrum of target photons, see Moderski et al. 2005). However, the resulting hardening of the electron distribution at high energies (because high-energy electrons would cool slower than those at lower energies) would necessarily imply a strong hardening of the synchrotron spectrum towards hard X-ray energies (Moderski et al. 2005). The Swift/XRT and BAT data do not seem to corroborate this hypothesis, though such an enhancement could in principle be located at even higher energies ( keV).
Therefore, to explain an SED such as that of 1ES 0414009 (Fig. 4) in the context of a one-zone SSC model, one is drawn to consider a set of parameters for which the IC peak is obtained in the Thomson regime () (see Aharonian et al. 2008; Boettcher et al. 2008, for alternative scenarios). The branch of the electron distribution corresponding to the GeV-TeV band would then correspond to the optical-UV band of the synchrotron spectrum (i.e. electron energies ).
Adopting keV and TeV as the energies of the synchrotron and IC peaks respectively, the Lorentz factor of the electrons at the peak would be . The luminosity at these two energies can be estimated as and ergs, respectively, from the log-parabolic fit to the synchrotron peak and the power-law fit to the -ray spectrum. Performing an analysis of the independent SSC constraints in the (log – log ) plane (see e.g. Tavecchio et al. 1998; Guy et al. 2000), with these parameters, a solution in the Thomson regime can be found for and G, but only with a rather large emitting region (R cm, vs R cm, the Schwartzschild radius of the putative Black Hole). If this is the case, no variability faster than 1 day is expected, though this is below the sensitivity of current experiments at this source’s flux level. Assuming instead a more typical size of the emitting region for HBLs, around R cm, rather extreme parameters would be required: and B G.
However, in both cases the synchrotron cooling is very slow, and the cooling time of the electrons at the synchrotron peak is much longer than the escape time (see e.g. Tavecchio et al. 1998, considering the electron escape velocity in the range 1-1/3). The break in the electron spectrum corresponding to the SED peak, therefore, cannot be explained simply by radiative cooling (a “cooling break”) or by an equilibrium between cooling and escape from the source, as typically assumed for BL Lac objects with much lower Compton-peak energies, like PKS 2155-304, Mkn 421 or Mkn 501 (e.g. Tavecchio et al. 1998; Guy et al. 2000; Krawczynski et al. 2002; Ghisellini et al. 2002). Furthermore, the slow cooling requires the kinetic energy of the jet to be increased significantly in order to compensate for the low efficiency of the radiative emission. It should be noted that the Fermi and H.E.S.S. spectra provide only a lower limit on the energy and luminosity of the IC peak; if the true source values are actually higher, even more extreme parameters would be required. The problems just described are a general issue for the class of TeV BL Lac objects characterized by a hard TeV spectrum, an IC peak at very high energies and a large separation between synchrotron and IC peak frequencies. It might indicate either a fundamental difference in the physical jet conditions with respect to the other HBLs, or the need for an emission mechanism different from that of homogeneous SSC models.
As a final caveat, however, it should be noted that the statistical uncertainty on the -ray spectra is rather large, especially at VHE (). If the true VHE spectrum were steeper than the H.E.S.S. measurement (i.e. ), the IC component would have a peak energy around 100–200 GeV, and a slightly lower luminosity. This would make the 1ES 0414009 SED more similar to a typical HBL and would be easier to explain with standard SSC parameters.
6 Conclusion
The H.E.S.S. array of Cherenkov telescopes has been used to detect significant VHE -ray emission in the direction of 1ES 0414009, a distant BL Lac objects of known redshift. The overall flux above 200 GeV from 2005 to 2009 shows no variability on any time-scale and is on average very low (around 0.6% Crab Nebula flux), making 1ES 0414009 one of the faintest extra-galactic sources detected in the TeV domain. This source was detected with the Fermi LAT in the first 20 months of its operation between 2008 and 2010 and was very faint in the HE domain too.
The VHE spectrum measured using H.E.S.S. is consistent with the current limit of the EBL and confirms the low level of EBL in the few m range as derived from galaxy counts. The HE and VHE spectra (absorption corrected with an EBL model close to the lower limits) show a best-fit power law with an index harder than 2, indicating that 1ES 0414009 can be classified as a hard-TeV BL Lac object. The overall SED of this source is averaged over five years with no strict simultaneity between the Swift and H.E.S.S. observations. With this caveat, the properties of the SED –in particular an IC peak energy above 1–2 TeV– are difficult to explain in the framework of a pure one-zone SSC model, unless using unusual values for the main parameters.
Future observations of 1ES 0414009 are strongly motivated, in particular with the next generation of Cherenkov telescope arrays such as the Cherenkov Telescope Array (CTA). With a tenfold increase in sensitivity with respect to the current Cherenkov experiments, CTA will allow better measurements of the VHE spectrum of faint sources, especially at high energies, provide better constraints of the IC peak, and will help to address the physics issues posed by the hard-TeV BL Lac objects.
Acknowledgements
The support of the Namibian authorities and of the University of Namibia
in facilitating the construction and operation of H.E.S.S. is gratefully
acknowledged, as is the support by the German Ministry for Education and
Research (BMBF), the Max Planck Society, the French Ministry for Research,
the CNRS-IN2P3 and the Astroparticle Interdisciplinary Programme of the
CNRS, the U.K. Science and Technology Facilities Council (STFC),
the IPNP of the Charles University, the Polish Ministry of Science and
Higher Education, the South African Department of
Science and Technology and National Research Foundation, and by the
University of Namibia. We appreciate the excellent work of the technical
support staff in Berlin, Durham, Hamburg, Heidelberg, Palaiseau, Paris,
Saclay, and in Namibia in the construction and operation of the
equipment.
The Fermi-LAT Collaboration acknowledges generous ongoing support
from a number of agencies and institutes that have supported both the
development and the operation of the LAT as well as scientific data analysis.
These include the National Aeronautics and Space Administration and the
Department of Energy in the United States, the Commissariat à
l’Energie Atomique
and the Centre National de la Recherche Scientifique / Institut
National de Physique
Nucléaire et de Physique des Particules in France, the Agenzia
Spaziale Italiana
and the Istituto Nazionale di Fisica Nucleare in Italy, the Ministry
of Education,
Culture, Sports, Science and Technology (MEXT), High Energy Accelerator Research
Organization (KEK) and Japan Aerospace Exploration Agency (JAXA) in Japan, and
the K. A. Wallenberg Foundation, the Swedish Research Council and the
Swedish National Space Board in Sweden. Additional support for science
analysis during the operations phase is gratefully acknowledged from
the Istituto Nazionale di Astrofisica in Italy and the Centre National
d’Études Spatiales in France.
This research has made use of data obtained from
the High Energy Astrophysics Science Archive Research Center
(HEASARC), provided by NASA’s Goddard Space Flight Center.
References
- Abdo et al. (2010a) Abdo, A. A. et al. (Fermi Collaboration) 2010a, ApJS, 188, 405
- Abdo et al. (2010b) Abdo, A. A. et al. (Fermi Collaboration) 2010b, ApJ, 708, 1254
- Abdo et al. (2011) Abdo, A. A. et al. (Fermi Collaboration) 2011, submitted to ApJ arXiv:1108.1435v1
- Acciari et al. (2009) Acciari, V. A. et al. (VERITAS Collaboration) 2009, ApJ 695, 1370
- Aharonian et al. (2000) Aharonian, F. A., Akhperjanian, A. G., Barrio, J. A., et al. 2000, A&A, 353, 847
- Aharonian et al. (2006a) Aharonian, F. et al. (H.E.S.S. Collaboration) 2006a, Nature, 440, 1018
- Aharonian et al. (2006b) Aharonian, F. et al. (H.E.S.S. Collaboration) 2006b, A&A, 457, 899
- Aharonian et al. (2007a) Aharonian, F. et al. (H.E.S.S. Collaboration) 2007a, A&A, 473, 25
- Aharonian et al. (2007b) Aharonian, F. et al. (H.E.S.S. Collaboration) 2007b, A&A, 470, 475
- Aharonian et al. (2007c) Aharonian, F. et al. (H.E.S.S. Collaboration) 2007c, A&A, 475L, 9
- Aharonian et al. (2008) Aharonian, F., Khangulyan, D., & Costamante, L. 2008, MNRAS, 387, 1206
- Ajello et al. (2008) Ajello, M., Rau, A., Greiner, J., et al. 2008, ApJ 673, 96
- Atwood et al. (2009) Atwood, W. B. et al. (Fermi Collaboration) 2009, ApJ 697, 1071
- Barthelmy et al. (2005) Barthelmy, S. D., Barbier, L. M., Cummings, J. R., et al. 2005, SSRv, 120, 143
- Beckmann et al. (2002) Beckmann, V., Wolter, A., Celotti, A., et al. 2002, A&A, 383, 410
- Berge et al. (2007) Berge, D., Funk, S., & Hinton, J. 2007, A&A, 466, 1219
- Bertin & Arnouts (1996) Bertin, E. & Arnouts, S. 1996, A&AS, 117, 393
- Boettcher et al. (2008) Boettcher, M., Dermer, C. D., & Finke, J. D. 2008, ApJ 679L, 9
- Brinkmann et al. (1995) Brinkmann, W., Siebert, J., Reich, W., et al. 1995, A&ASS, 109, 147
- Burrows et al. (2005) Burrows, D. N., Hill, J. E., Nousek, J. A., et al. 2005, SSRv, 120, 165
- Cardelli et al. (1989) Cardelli, J. A., Clayton, G. C., & Mathis, J. S. 1989, ApJ 345, 245
- Costamante et al. (2001) Costamante, L., Ghisellini, G., Giommi, P., et al. 2001, A&A, 371, 512
- Costamante & Ghisellini (2002) Costamante, L., & Ghisellini, G. 2002, A&A, 384, 56
- Dominguez et al. (2011) Dominguez, A., Primack, J. R., Rosario, D. J., et al. 2011, MNRAS, 410, 2556
- CTA Consortium (2010) The CTA Consortium 2010, arXiv:1008.3703v2
- Elvis et al. (1999) Elvis, L. et al. 1999, NCSA Astronomy Digital Image Library
- Falomo et al. (2003) Falomo, R., Carangelo, N., & Treves, A. 2003, MNRAS, 343, 505
- Franceschini et al. (2008) Franceschini, A., Rodighiero, G., & Vaccari, M. 2008, A&A, 487, 837
- Feldman & Cousins (1998) Feldman, G. J., & Cousins R. D. 1998, Phys. Rev. D, 57, 3873
- Fiorucci et al. (1998) Fiorucci, M., Tosti, G., & Rizzi, N. 1998, PASP, 110, 105
- Giacconi et al. (1979) Giacconi, H., Branduardi, G., Briel, U., et al. 1979, ApJ 230, 540
- Giommi et al. (1990) Giommi, P., Barr, P., Pollock, A. M. T., Garilli, B., & Maccagni, D. 1990, ApJ 356, 432
- Ghisellini et al. (2002) Ghisellini, G., Celotti, A., & Costamante, L. 2002, A&A, 386, 833
- Gursky et al. (1978) Gursky, H., Bradt, H., Doxsey, R., et al. 1978, ApJ, 223, 973
- Guy et al. (2000) Guy, J., Renault, C., Aharonian, F. A., Rivoal, M., & Tavernet, J.-P. 2000, A&A, 359, 419
- Halpern et al. (1991) Halpern, J. P., Chen, V. S., Madejski, G. M., & Chanan, G. A. 1991, Astron. Journal, 101, 818
- Hauser et al. (2004) Hauser, M., Möllenhof, C., Pühlhofer, G., et al. 2004, Astronomische Nachrichten. 325, 659
- Impey & Tapia (1988) Impey, C.D. & Tapia, S. 1988, ApJ 333, 666
- Krawczynski et al. (2002) Krawczynski, H., Coppi, P. S., & Aharonian, F. 2002, MNRAS, 336, 721
- Kubo et al. (1998) Kubo, H., Takahashi, T., Madejski, G., et al. 1998, ApJ 504, 693
- Mattox et al. (1996) Mattox, J. R., Bertsch, D. L., Chiang, J., et al. 1996, ApJ 461, 396
- Moderski et al. (2005) Moderski, R., Sikora, M., Coppi, P. S. & Aharonian, F. 2005, MNRAS 363, 954
- de Naurois & Rolland (2009) de Naurois, M. & Rolland, L. 2009, Astrop. Phys., 32, 231
- O’Donnell (1994) O’Donnel, J. E. 1994, ApJ 422, 158
- Ohm et al. (2009) Ohm, S., van Eldik, C., & Egberts, K. 2009, Astrop. Phys., 31, 383
- Padovani & Giommi (1995) Padovani, P. & Giommi, P. 1995, MNRAS 427, 1477
- Piron et al. (2001) Piron, F., Djannati-Ataï, A., Punch, M. et al. 2001, A&A, 374, 895
- Poole et al. (2008) Poole, T. S., Breeveld, A. A., Page, M. J., et al. 2008, MNRAS, 383, 627
- Roming et al. (2005) Roming, P. W. A., Kennedy, T. E., Mason, K. O, et al. 2005, Space Science Reviews, 120, 95
- Sambruna et al. (1994) Sambruna, R. M., Barr, P., Giommi, P., et al. 1994, ApJS 95, 371
- Silva et al. (1998) Silva, L., Granato, G. L., Bressan, A., & Danese, L. 1998, ApJ 509, 103
- Scarpa et al. (2000) Scarpa, R., Urry, C. M., Falomo, R., Pesce, J., & Treves, A. 2000, ApJ 532, 740
- Schlegel et al. (1998) Schlegel, D. J., Finkbeiner, D. P., & Davis, M. 1998, ApJ 500, 525
- Tavecchio et al. (1998) Tavecchio, F., Maraschi, L., & Ghisellini, G. 1998, ApJ, 509, 608
- Tavecchio et al. (2009) Tavecchio, F., Ghisellini, G., Ghirlanda, G., Costamante, L., & Franceschini, A. 2009, MNRAS, 399L, 59
- Tramacere et al. (2007) Tramacere, A., Giommi, P., Massaro, E., et al. 2007, A&A, 467, 501
- Ulmer et al. (1983) Ulmer, M. P., Brown, R. L., Schwartz, D. A., Patterson, J., & Cruddace, R. G. 1983, ApJ 270, L1
- Vaughan et al. (2003) Vaughan, S., Edelson, R., Warwick, R. S., & Uttley, P. 2003, MNRAS, 345, 1271
- Wilks (1938) Wilks, S. S. 1938, Ann. Math. Statist., 9, 1, 60