Enhancement of mechanical Q-factors by optical trapping
Abstract
The quality factor of a mechanical resonator is an important figure of merit for various sensing applications and for observing quantum behavior. Here, we demonstrate a technique to push the quality factor of a micro-mechanical resonator beyond conventional material and fabrication limits by using an optical field to stiffen or “trap” a particular motional mode. Optical forces increase the oscillation frequency by storing most of the mechanical energy in a lossless optical potential, thereby strongly diluting the effect of material dissipation. By using a 130 nm thick SiO2 disk as a suspended pendulum, we achieve an increase in the pendulum center-of-mass frequency from 6.2 kHz to 145 kHz. The corresponding quality factor increases 50-fold from its intrinsic value to a final value of , representing more than an order of magnitude improvement over the conventional limits of SiO2 for this geometry. Our technique may enable new opportunities for mechanical sensing and facilitate observations of quantum behavior in this class of mechanical systems.
Mechanical resonators are widely used as exquisite sensors of weak perturbations such as small forces Hoyle et al. (2001); Mamin and Rugar (2001), displacements Abramovici et al. (1992); Teufel et al. (2009), and changes in mass Lavrik and Datskos (2003); Ono et al. (2003). In fact, a number of systems have advanced to the point that it is possible to detect quantum effects in their motion Teufel et al. (2009); Rocheleau et al. (2010); O’Connell et al. (2010); Chan et al. (2011), raising the exciting possibility that such systems might eventually lead to applications in quantum information processing Stannigel et al. (2010); Chang et al. (2011); Regal and Lehnert (2011) and the observation of quantum effects at macroscopic scales Genes et al. (2008); Müller-Ebhardt et al. (2008).
The performance of a mechanical resonator depends critically on its quality factor, which characterizes both the maximum response of an oscillator to a disturbance at its resonance frequency and the coupling rate to its surrounding dissipative environment. Improving quality factors beyond state-of-the-art parameters is a challenging task since a number of systems are now limited by fundamental dissipation mechanisms, e.g. thermoelastic damping Lifshitz and Roukes (2000) and internal friction Pohl et al. (2002).
In this Letter, we experimentally demonstrate a technique that enables the quality factor of a mechanical system to be enhanced beyond conventional material limits. Our technique involves optically trapping a thin, dielectric membrane whose geometry is designed so that the natural material forces are extremely weak Chang et al. (2011). In this limit, almost all mechanical energy is stored in an ultralow loss potential provided by strong optical restoring forces, which dilute the effects of internal material dissipation Chang et al. (2011); Cagnoli et al. (2000). Our general scheme is implemented for a particular example of an SiO2 dielectric disk supported by a single thin tether, trapped in an optical standing wave. We observe an increase in the “pendulum” mode frequency from kHz to kHz as the optical power is increased, leading to a final quality factor of . represents greater than fifty-fold increase over the intrinsic of our device in the absence of optical trapping forces, and significantly, more than an order of magnitude improvement over estimates of the conventional dissipative rate of our SiO2 disk Yasumura et al. (2000); Penn et al. (2006). These results substantiate the potential of our technique to facilitate mechanical sensors with enhanced sensitivity and quantum devices based upon mechanical systems.
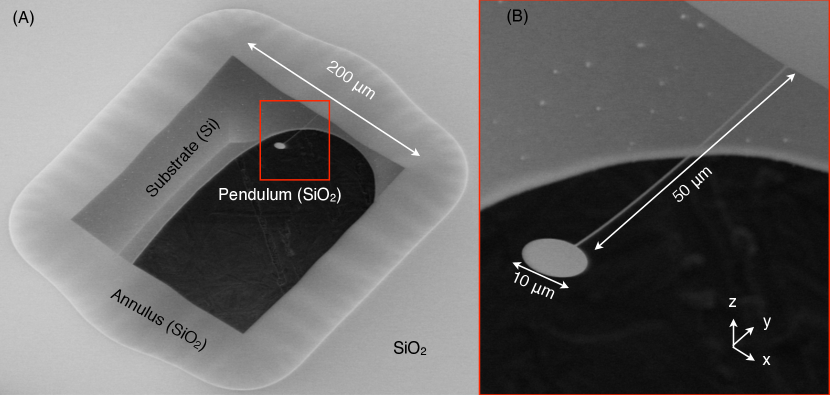
Optical forces are generally feeble as compared to mechanical forces, which makes optical manipulation of mechanical oscillators challenging. To implement optical trapping of membranes, we begin by fabricating a nearly free-standing dielectric film in a pendulum geometry. We chose SiO2 as the membrane material mainly for its low optical absorption Armani et al. (2003). The pendulum (Fig. 1) consists of a 10 m diameter disk held by a 50 m 0.43 m tether, which is attached to a large, square annulus of SiO2 that has a width of 60 m. The thickness of all the suspended parts (i.e. the disk, the tether, and the annulus) is 130 nm.
The pendulum mechanical resonators are fabricated from a 200 m thick Si wafer in which a 130 nm surface SiO2 layer has been formed using dry oxidation. Electron beam lithography, followed by a C4F8:SF6 plasma etch, are used to transfer the disk and tether pattern into the surface SiO2 layer of 11 cm chips diced from the wafer. A XeF2 plasma etch is used to selectively remove the underlying Si, releasing the SiO2 pendulum and opening a through-hole in the Si substrate. Due to the isotropic nature of the XeF2 etch, a narrow annulus of undercut SiO2 is formed at the periphery of the transferred pattern (see Fig. 1). To reduce the width of the SiO2 annulus, the Si substrate below the pendulum pattern is pre-thinned from the backside.
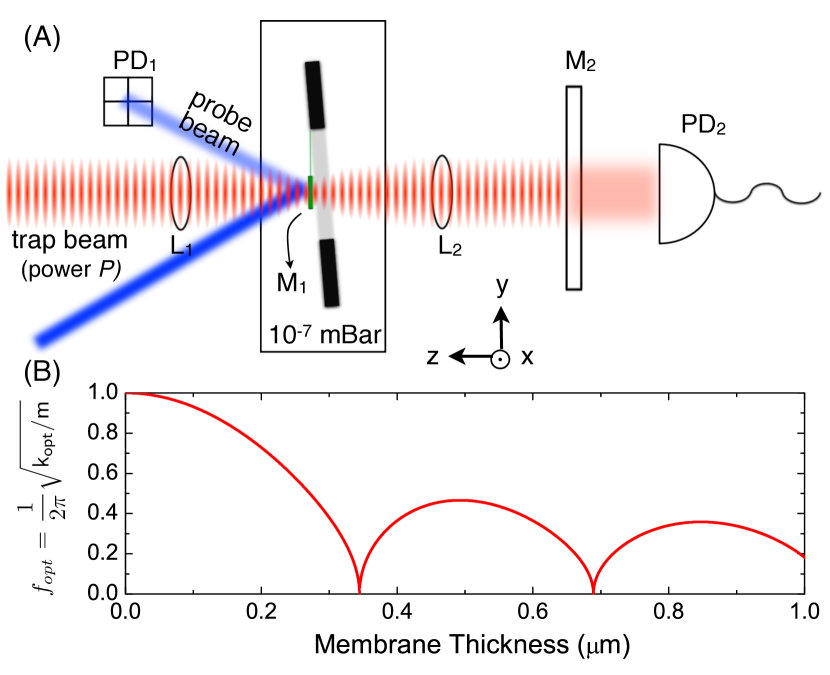
To investigate properties related to a trapped pendulum, we load the 11 cm pendulum chip, which typically contains a dozen devices, into a vacuum chamber traversed by an optical standing wave. A schematic of the experimental setup is shown in Fig. 2(A). The pendulums hang vertically inside the chamber, which is evacuated to a pressure below mbar to make gas damping negligible. The optical standing wave is formed by a retro-reflected Gaussian beam, which has been focused to a waist m at the position of the disk. The trap beam is derived from a high power Nd:YAG laser operating at a wavelength of 1.064 m. We vary the incident laser power between 3 mW to 17 W using a waveplate and a polarizing cube. The centering of the trap beam on the pendulum disk is critical for achieving large trapping potentials without mixing “center-of-mass” (CM) motion of the pendulum with vibrational modes of the tether. This degree of freedom is carefully aligned by monitoring transmission of the forward and retro-reflected beams through the disk. In addition, to ensure that the disk is perpendicular to the optical standing wave, we implement a pair of actuators to tip and tilt the chip to prevent the pendulum from settling into a configuration in which the disk extends over multiple periods of the standing wave.
For the optical standing wave configuration shown schematically in Fig. 2(A), we estimate the trapping potential by balancing expressions for the radiation pressure force on either side of the membrane. To simplify the problem, we assume that the disk is infinitely stiff, that it is free to move along the axis of the trap, and that the incident optical beam is smaller than the disk so that diffraction from the edges may be ignored. We solve for the electric-field of a single beam in the presence of two reflectors, M1 and M2 (where M1 represents the disk), as a function of the membrane thickness, . Stable equilibria occur at the positions where the force between the incoming beam and the finite electric field built up between M1 and M2 are balanced, which are neither at nodes nor anti-nodes of the standing wave. At each equilibrium position, the optical spring constant of the trap is , where is the incoming power, and are the reflectance and the transmittance of the membrane determined by and the index of refraction of the film Hecht (1987), and is the speed of light. In Fig. 2(B), we plot the calculated optical trapping frequency, , normalized to the prediction for a membrane with . For our membrane with thickness m, the trapping frequency is 88% of the value predicted for a membrane with . It is interesting to note that the optical spring constant for a membrane in the middle of a high finesse Fabry-Perot cavity is also , where is now the circulating power. In this case, however, the membrane center would be trapped specifically at either an anti-node or a node of the standing wave depending on the membrane thickness.
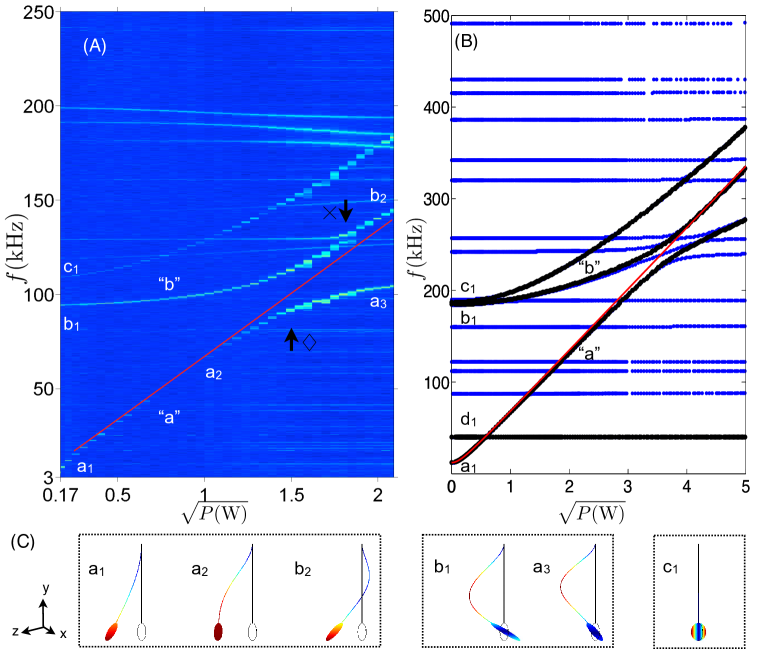
Intrinsic vibrational modes and frequencies of the pendulum structure are probed by reflecting an independent “probe” beam ( m) from the disk at an oblique angle (50∘) with respect to the trap. The reflected beam is directed to a quadrant photodiode (PD1) Usami et al. (2010) which is calibrated using the membrane tip/tilt actuators. The quadrant photodiode can be split into two horizontal pairs of sensors (“top” and “bottom”) and two vertical pairs of sensors (“left” and “right”). Analysis is performed on the difference between the “top” and “bottom” combined photosignals (expressed as a transimpedance-amplified photocurrent, ) and the difference between the “left” and “right” combined signals (). Fourier transforms of and reveal the frequencies and tip/tilt orientation of the vibrational modes (Fig. 3(A)). We identify low-order vibrational modes by comparison of the observed frequency spectrum and their characteristic mode shapes to a finite-element simulation (Fig. 3(B), COMSOL 3.5a) based on the membrane material properties and its geometry measured using a scanning electron microscope. We see approximately a factor of two discrepancy in the simulated frequencies versus measurements in the absence of optical forces. This is most likely due to an overestimate of the Young’s modulus for the very thin SiO2 layer where surface effects can be important. The mode shapes in the absence of optical forces calculated from simulation are illustrated in Fig. 3(C) as (a1) the “pendulum” mode, also called the “CM” mode, where the pendulum disk swings along the axis of the trapping beam ( kHz), (b1) the “violin” mode ( kHz), and (c1) the “torsional” mode ( kHz). One additional mode that is not shown in the figure is (d1) the transverse pendulum mode swinging orthogonal to the axis of the trapping beam (25 kHz). The mode that we are most interested is the CM mode because it exhibits the least mechanical deformation which leads to energy dissipation Chang et al. (2011).
In the presence of an optical trap, the frequency of the membrane is determined by the sum of the optical restoring force and the intrinsic mechanical restoring force. The contribution from gravity is small ( 100 Hz) and is generally neglected. The trap is first aligned at a low trapping power (3 mW). To ensure that the tether does not provide a significant initial restoring force, we also fine tune the trapping laser wavelength so that the equilibrium position of the trap coincides with the natural axial position of the membrane. We diagnose their coincidence by minimizing the vertical deflection of the probe beam (evident in the mean value of ) when the trap is turned on. Figure 3(A) shows the power spectrum of , which reflects the vertical angular displacement of the pendulum, as a function of trap power, . For comparison, we show a spectrum generated by a finite element model (Fig. 3(B)) that treats the optical trap as a restoring force with a Gaussian transverse profile. Close comparison of the observed and model spectra adds to our understanding of several distinct features. As the optical trap power is increased, the frequencies of the three lowest visible modes increase as , where represents their natural frequency and is the trapping slope coefficient for each mode. As the CM mode frequency increases, the mode shape also changes via the bending of the tether. This change is first evident in the reduction of the CM mode signal near 50 - 75 kHz. The reduction occurs as the mode shape changes from Fig. 3(C, a1) to (C, a2), which to first order does not deflect vertically. In addition, as expected, we do not see such a reduction for corresponding trapping beam transmission on PD2 (not displayed) that probes pure axial disk displacement. The mode shape again changes as the CM mode and the violin mode (Fig. 3(C, b1)) form an avoided crossing near 93 kHz. At higher power, the CM mode is a hybrid of pendulum and violin modes (Fig. 3(C, b2)). As the frequency continues to increase, the CM mode crosses an annulus mode. Overall, the CM mode frequency shifts from 6.2 kHz to 145 kHz when 4.3 W of optical power is applied, corresponding to a trapping slope coefficient of , in good agreement with the finite-element simulated value of (the inferred value from measurement being overestimated due to the mode anti-crossing). At trapping powers greater than 4.3 W, we find that the CM frequency (145 kHz) is near yet another vibrational mode of the annulus. With further increases in power, the large thermal displacements of the annulus mode greatly dominates the motion of the CM pendulum mode, making it difficult to identify.
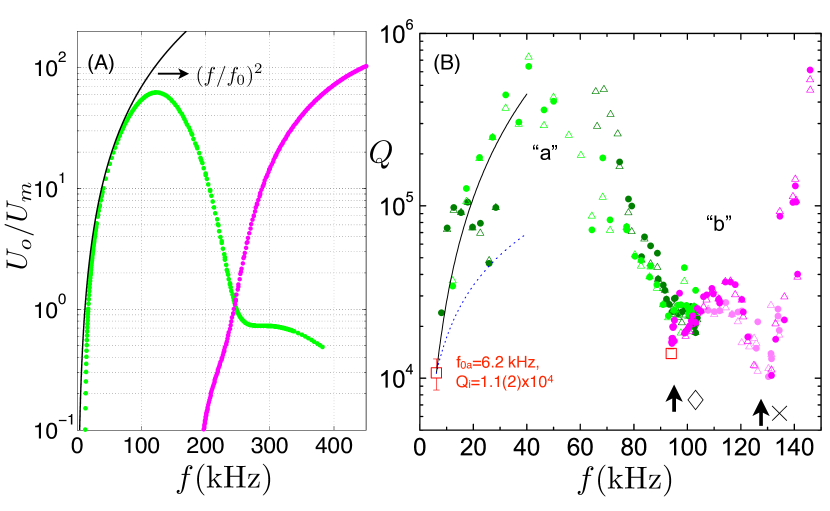
One of the most important consequences of optical trapping is an increase of the mechanical Chang et al. (2011). The large increase in frequency of the CM mode through optical trapping implies that the amount of mechanical energy stored in the optical fields dominates over that stored in internal stresses, . Because the optical potential is nearly lossless, the effects of material dissipation are diluted by a factor . Therefore, we would expect the mechanical of the system to increase as the inverse of the dilution factor for a frequency-independent damping mechanism. For an ideal system, one would find an indefinite increase in the ratio with increasing trap power. In practice, this ratio saturates due to factors such as an inhomogeneous trapping beam profile and mode mixing with the modes of the support structure (tether and SiO2 annulus in our case). Accounting for these effects, our finite-element simulation predicts a maximum of (see Fig. 4(A)) in our experimentally achievable frequency range.
To infer the of the trapped pendulum, we record the thermal motion at each laser power for a few minutes and numerically compute the energy auto-correlation, , over a Fourier frequency range encompassing the mechanical frequency Stipe et al. (2001). For a high oscillator driven by Gaussian thermal noise, is characterized by an exponential decay with time constant , in correspondence to our measurements. The time constant relates to the mechanical quality factor by . From shot to shot, we observe a 20% standard deviation in the inferred value of . The pendulum in the absence of trapping forces has an initial value .
A summary of our -measurement results is presented in Fig. 4(B). Two datasets corresponding to slightly different optical alignments are compared. In addition, we compare the result of monitoring vertical angular displacement of the pendulum on PD1 (data in circles) with the result of monitoring axial displacement of the pendulum via the trap beam transmission through M2 on PD2 (triangles). The results are consistent in both cases. We observe that the initial increase to a maximum value is consistent with the scaling and which is in contrast with the stress induced -increase studied in SiN nano-strings Verbridge et al. (2007). After the initial increase, then drops as the CM mode crosses the violin mode, which is a consequence of an increase of the strain energy in the bending of the tether Chang et al. (2011). Beyond the avoided crossing with the violin mode and a subsequent annulus mode (arrow ), the of the CM mode increases again by a factor of 50 relative to to a final value . The dependence of on frequency is in qualitative agreement with the calculated in Fig. 4(A). Overall, we demonstrate that by adding optical energy but not dissipation into the system, we can increase the mechanical by more than an order of magnitude.
We expect that further significant advances can be made with refined fabrication techniques and a shift to materials with better mechanical characteristics. For instance, the mechanical frequency and the corresponding -factor of our trapped pendulum is limited in part by the large suspended annulus to which the tether is attached (Fig. 1). Using wet chemical anisotropic etching of Si to release the pendulum, it should be possible to fabricate a device with an annulus less than 10 m wide. Furthermore, while SiO2 proved to be convenient to work with initially, it suffers a relatively low intrinsic quality factor of that is likely to be limited by surface-related damping mechanisms Yasumura et al. (2000); Penn et al. (2006). Although the nature of surface damping is still an open question and not necessarily a fundamental limitation, we can still compare our observed to other SiO2 devices. From the extensive phenomenological study of SiO2 loss angle Penn et al. (2006) and the surface-to-volume ratio of our pendulum, we would expect , which is consistent with our observation of . Switching platforms to stressed silicon nitride or crystalline silicon should enable material quality factors of - Yang et al. (2000); Verbridge et al. (2006); Wilson et al. (2009). In initial experiments with Si3N4, for example, we have fabricated stressed, tethered structures (similar to Kleckner et al. (2011)) with bare frequencies of kHz and . We expect that by applying optical trapping to such structures, final quality factors of might be possible for oscillator frequency 1 MHz. Such values would be unprecedented for any fabricated nano- or micro-mechanical system, and remarkably, would be competitive with the prediction for untethered levitated nano-particles Ashkin and Dziedzic (1976); Libbrecht and Black (2004); Chang et al. (2010); Romero-Isart et al. (2010); Li et al. (2010).
Our technique holds promise as a tool to reduce the role of mechanical dissipation in a wide variety of sensing applications as well as in the emerging field of quantum opto-mechanics Aspelmeyer et al. (2010). Our device can be integrated into a high-finesse cavity employing the “membrane-in-the-middle” geometry Thompson et al. (2008); Wilson et al. (2009), for example, and could provide the long coherence times necessary to observe quantum behaviors (i.e., macroscopic entanglement) in a room temperature environment Genes et al. (2008); Müller-Ebhardt et al. (2008). This work reveals a fascinating new aspect of the interplay between motion and light Braginsky et al. (1999) and should stimulate further exploration.
We thank T. Rosenband for insightful discussions. KN acknowledges support from Caltech’s Center for the Physics of Information (CPI). DEC acknowledges support from CPI and the Fundacio Cellex Barcelona. This work is supported by DARPA ORCHID program, the NSF, DoD NSSEFF, and the Institute of Quantum Information and Matter, an NSF Physics Frontier Center with support of the Gordon and Betty Moore Foundation.
References
- Hoyle et al. (2001) C. D. Hoyle, U. Schmidt, B. R. Heckel, E. G. Adelberger, J. H. Gundlach, D. J. Kapner, and H. E. Swanson, Phys. Rev. Lett. 86, 1418 (2001).
- Mamin and Rugar (2001) H. J. Mamin and D. Rugar, Appl. Phys. Lett. 79, 3358 (2001).
- Abramovici et al. (1992) A. Abramovici, W. E. Althouse, R. W. P. Drever, Y. G rsel, S. Kawamura, F. J. Raab, D. Shoemaker, L. Sievers, R. E. Spero, K. S. Thorne, et al., Science 256, 325 (1992).
- Teufel et al. (2009) J. D. Teufel, T. Donner, M. A. Castellanos-Beltran, J. W. Harlow, and K. W. Lehnert, Nature Nanotechnol. 4, 820 (2009).
- Lavrik and Datskos (2003) N. V. Lavrik and P. G. Datskos, Appl. Phys. Lett. 82, 2697 (2003).
- Ono et al. (2003) T. Ono, X. Li, H. Miyashita, and M. Esashi, Rev. Sci. Instr. 74, 1240 (2003).
- Rocheleau et al. (2010) T. Rocheleau, T. Ndukum, C. Macklin, J. B. Hertzberg, A. A. Clerk, and K. C. Schwab, Nature 463, 72 (2010).
- O’Connell et al. (2010) A. D. O’Connell, M. Hofheinz, M. Ansmann, R. C. Bialczak, M. Lenander, E. Lucero, M. Neeley, D. Sank, H. Wang, M. Weides, et al., Nature 464, 697 (2010).
- Chan et al. (2011) J. Chan, T. P. M. Alegre, A. H. Safavi-Naeini, J. T. Hill, A. Krause, S. Gröblacher, M. Aspelmeyer, and O. Painter, Nature 478, 89 (2011).
- Stannigel et al. (2010) K. Stannigel, P. Rabl, A. S. Sørensen, P. Zoller, and M. D. Lukin, Phys. Rev. Lett. 105, 220501 (2010).
- Chang et al. (2011) D. E. Chang, A. H. Safavi-Naeini, M. Hafezi, and O. Painter, New Journal of Physics 13, 023003 (2011).
- Regal and Lehnert (2011) C. A. Regal and K. W. Lehnert, Journal of Physics: Conference Series 264, 012025 (2011).
- Genes et al. (2008) C. Genes, D. Vitali, and P. Tombesi, New J. Phys. 10, 095009 (2008).
- Müller-Ebhardt et al. (2008) H. Müller-Ebhardt, H. Rehbein, R. Schnabel, K. Danzmann, and Y. Chen, Phys. Rev. Lett. 100, 013601 (2008).
- Lifshitz and Roukes (2000) R. Lifshitz and M. L. Roukes, Phys. Rev. B 61, 5600 (2000).
- Pohl et al. (2002) R. O. Pohl, X. Liu, and E. Thompson, Rev. Mod. Phys. 74, 991 (2002).
- Chang et al. (2011) D. E. Chang, K.-K. Ni, O. Painter, and H. J. Kimble, ArXiv e-prints (2011), eprint 1101.0146.
- Cagnoli et al. (2000) G. Cagnoli, J. Hough, D. DeBra, M. Fejer, E. Gustafson, S. Rowan, and V. Mitrofanov, Phys. Lett. A 272, 39 (2000).
- Yasumura et al. (2000) K. Yasumura, T. Stowe, E. Chow, T. Pfafman, T. Kenny, B. Stipe, and D. Rugar, Journal of Microelectromechanical Systems 9, 117 (2000).
- Penn et al. (2006) S. D. Penn, A. Ageev, D. Busby, G. M. Harry, A. M. Gretarsson, K. Numata, and P. Willems, Phys. Lett. A 352, 3 (2006).
- Armani et al. (2003) D. K. Armani, T. J. Kippenberg, S. M. Spillane, and K. J. Vahala, Nature 421, 925 (2003).
- Hecht (1987) E. Hecht, Optics (Addison-Wesley, 1987), p. 375.
- Usami et al. (2010) K. Usami, A. Naesby, T. Bagci, B. Nielsen, J. Liu, S. Stobbe, P. Lodahl, and E. Polzik, ArXiv e-prints (2010), eprint 1011.3974.
- Stipe et al. (2001) B. C. Stipe, H. J. Mamin, T. D. Stowe, T. W. Kenny, and D. Rugar, Phys. Rev. Lett. 87, 096801 (2001).
- Verbridge et al. (2007) S. S. Verbridge, D. F. Shapiro, H. G. Craighead, and J. M. Parpia, Nano Letters 7, 1728 (2007).
- Yang et al. (2000) J. Yang, T. Ono, and M. Esashi, Appl. Phys. Lett. 77, 3860 (2000).
- Verbridge et al. (2006) S. S. Verbridge, J. M. Parpia, R. B. Reichenbach, L. M. Bellan, and H. G. Craighead, J. Appl. Phys. 99, 124304 (2006).
- Wilson et al. (2009) D. J. Wilson, C. A. Regal, S. B. Papp, and H. J. Kimble, Phys. Rev. Lett. 103, 207204 (2009).
- Kleckner et al. (2011) D. Kleckner, B. Pepper, E. Jeffrey, P. Sonin, S. M. Thon, and D. Bouwmeester, Opt. Express 19, 19708 (2011).
- Ashkin and Dziedzic (1976) A. Ashkin and J. M. Dziedzic, Appl. Phys. Lett. 28, 333 (1976).
- Libbrecht and Black (2004) K. G. Libbrecht and E. D. Black, Phys. Lett. A 321, 99 (2004).
- Chang et al. (2010) D. E. Chang, C. A. Regal, S. B. Papp, D. J. Wilson, J. Ye, O. Painter, H. J. Kimble, and P. Zoller, Proc. Natl. Acad. Sci. USA 107, 1005 (2010).
- Romero-Isart et al. (2010) O. Romero-Isart, M. L. Juan, R. Quidant, and J. I. Cirac, New J. Phys. 12, 033015 (2010).
- Li et al. (2010) T. Li, S. Kheifets, D. Medellin, and M. G. Raizen, Science 328, 1673 (2010).
- Aspelmeyer et al. (2010) M. Aspelmeyer, S. Gröblacher, K. Hammerer, and N. Kiesel, J. Opt. Soc. Am. B 27, A189 (2010).
- Thompson et al. (2008) J. D. Thompson, B. M. Zwickl, A. M. Jayich, F. Marquardt, S. M. Girvin, and J. G. E. Harris, Nature 452, 72 (2008).
- Braginsky et al. (1999) V. B. Braginsky, F. Y. Khalili, and K. S. Thorne, Quantum measurement (Cambridge Univ. Press., 1999).