GRB 090618: different pulse temporal and spectral characteristics within a burst
Abstract
GRB 090618 was simultaneously detected by Swift-BAT and Fermi-GBM. Its light curve shows two emission episodes consisting of four prominent pulses. The pulse in the first episode (episode A) has a smoother morphology than the three pulses in the second episode (episode B). Using the pulse peak-fit method, we have performed a detailed analysis of the temporal and spectral characteristics of these four pulses and found out that the first pulse (pulse A) exhibits distinctly different properties than the others in episode B (pulses B1, B2 and B3) in the following aspects. (i) Both the pulse width () and the rise-to-decay ratio of pulse (, pulse asymmetry) in GRB 090618 are found to be energy-dependent. The indices of the power-law correlation between and for the pulses in episode B however are larger than that in episode A. Moreover the pulses B1, B2 and B3 tend to be more symmetric at the higher energy bands while the pulse A displays a reverse trend. (ii) Pulse A shows a hard-to-soft spectral evolution pattern, while the three pulses in the episode B follow the light curve trend. (iii) Pulse A has a longer lag than the pulses B1, B2 and B3. The mechanism which causes the different pulse characteristics within one single GRB is unclear.
1 Introduction
Gamma-ray bursts (GRB) have remained enigmatic since their discovery in the late 1960s (for reviews, see Piran 2004; Zhang 2007). Although in the last ten years our understanding of GRBs has been advanced significantly, due mainly to the study of GRB afterglows (e.g., Sari et al. 1998; Fan & Wei 2005; Zhang et al. 2006), the exact mechanism which produces the prompt gamma-ray emission has not been definitively established (e.g., Fan 2010; Ghisellini 2010). The temporal structures of the prompt emission are very complicated, consisting of many overlapping pulses. Pulses are the basic, central building blocks of the prompt emission, and their correlative properties imply that the pulses are responsible for many luminosity-related characteristics. Recent studies showed that the lag vs. luminosity relation (Norris et al. 2000), the variability vs. luminosity relation (Reichart et al. 2001), the vs. relation (Amati et al. 2002) and the vs. relation (Wei & Gao 2003; Yonetoku et al. 2004) all seem to be better explained by pulse rather than bulk emission properties (see, Hakkila et al. 2008; Hakkila & Cumbee 2009; Krimm et al. 2009; Firmani et al. 2009; Ohno et al. 2009; Ghirlanda, Nava & Ghisellini 2010; Arimoto et al. 2010). In principle, the bulk characteristics of the prompt emission can be derived from our knowledge of the decomposition of the burst in pulses and their individual properties. Therefore, it is essential to our understanding of the physics of the bulk prompt emission of GRBs, that we properly measure and understand the properties of the individual pulses.
Hakkila et al. (2008) isolated and delineated pulse spectral properties of GRBs detected by BATSE with known redshifts, and found that pulse lag, pulse luminosity, and pulse duration are strongly correlated. They also found that pulse peak lag, pulse asymmetry, and pulse hardness are correlated for a large number of pulses of long GRBs (Hakkila & Cumbee 2009). These results indicate that most pulses of long GRBs within a given burst as well as when comparing different bursts might have similar physical origins.
However, in some cases, which show two or more separated distinct emission episodes, and each emission episode consists of one or more pulses, their pulse properties and origins are likely complicated. For example, Hakkila & Giblin (2004) identified two cases (GRBs 960530 and 980125), consisting of two separated emission episodes, and found that the pulses in the second emission episodes of these two GRBs have longer lags, smoother morphologies, and softer spectral evolution than those in the first episodes. It has been suggested that internal- and external-shock emission might overlap in these two cases (Hakkila & Giblin 2004).
Recently, the Swift Burst Alert Telescope (BAT) detected a burst, GRB 090618, which shows two emission episodes with four prominent pulses (Baumgartner et al. 2009). It is obvious that the pulse in the first episode has a smoother morphology than the three pulses in the second episode. We wonder whether the pulses in the two emission episodes within this burst have different properties and/or origins. To this end, we have performed a detailed analysis of the pulse temporal and spectral characteristics of GRB 090618 (preliminary results are reported in Zhang 2011).
2 Observations
GRB 090618 was detected by Swift-BAT at 08:28:29 UT on 2009 June 18 (this time is used as throughout the paper, Schady et al. 2009). The burst was also observed by Fermi-GBM (McBreen et al. 2009), AGILE (Longo et al. 2009), Suzaku WAM (Kono et al. 2009), KONUS-WIND and KONUS-RF (Golenetskii et al. 2009). The Swift X-ray telescope (XRT) began follow up observations of its X-ray light curve 124 s after the BAT trigger and its UVO telescope detected its optical afterglow 129 s after the trigger (Schady et al. 2009). Absorption features which were detected in its bright optical afterglow with the 3m Shane telescope at Lick observatory yielded a redshift of (Cenko et al. 2009).
The BAT burst light curve shows a smooth multipeak structure with 4 prominent pulses. Significant spectral evolution was observed during the burst. The spectrum at the maximum count rate, measured from +62.720 to s, was well fitted (Golenetskii et al. 2009) in the 20 keV2 MeV range by the Band function (Band et al. 1993) with a low-energy photon index , a high energy photon index , and peak energy keV, while the time integrated spectrum had a low-energy photon index , a high energy photon index , and a peak energy keV (Golenetskii et al. 2009). The isotropic equivalent energy in the 81000 keV band was erg (standard cosmology, McBreen et al. 2009).
3 Pulse Temporal Properties
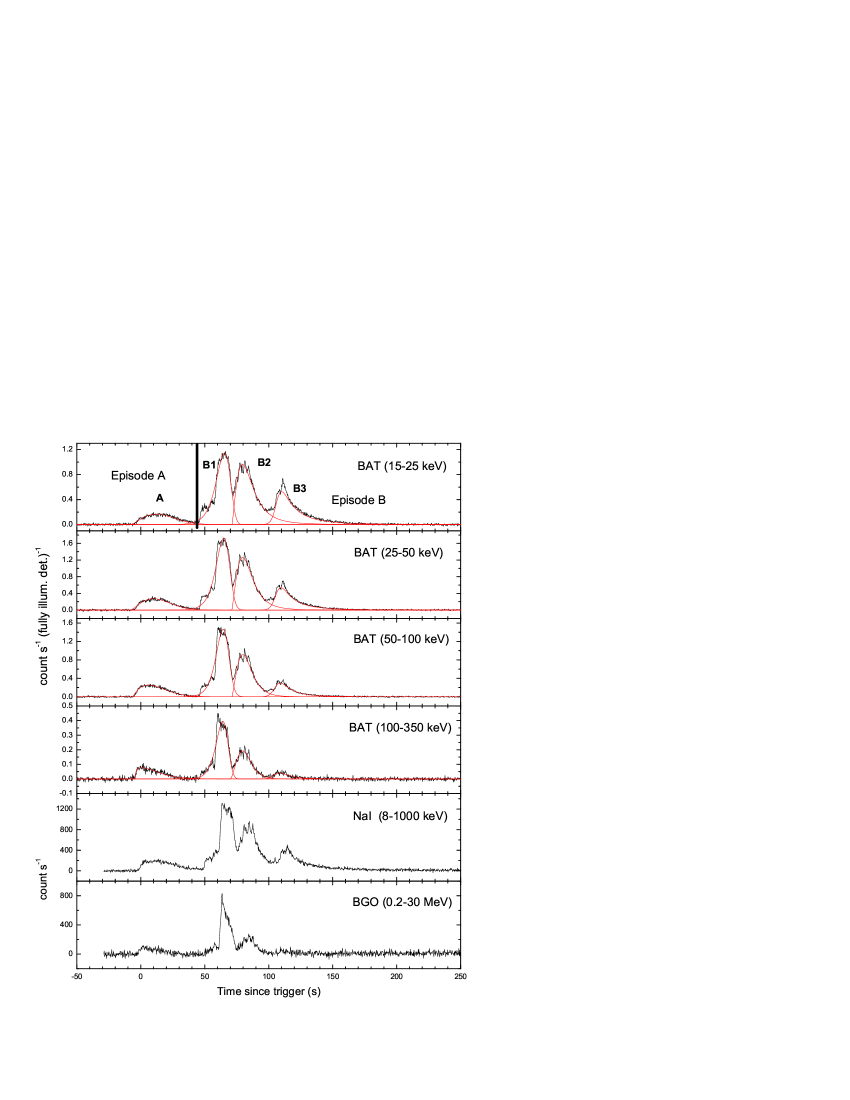
Figure 1 shows the BAT and GBM light curves over the standard energy bins (BAT: 1525, 2550, 50100 and 100350 keV; GBM: 81000 keV (NaI) and 0.230 MeV (BGO)). The first episode (episode A) is a smooth 50 s pulse starting at s, and ends at s (pulse A). The second episode (episode B) starts at s and is about 275 s long, consisting of three overlapping pulses. The first pulse peak at s (pulse B1), the second peak is at s (pulse B2), and the third peak is at s, finally ending at s (pulse B3). (15350 keV) is s (estimated error including systematics, Baumgartner et al. 2009). We focus attention on how the pulse width and pulse width ratio depend on energy in the two emission episodes, while checking if that dependence is maintained during this burst.
Kocevski et al. (2003) developed an empirical expression, which can be used to fit the pulses of GRBs. This function can be written as,
| (1) |
where is the time of the maximum flux () of the pulse, is the offset time, and are the rising and decaying power-law indices, respectively. Because the prompt emission of GRB 090618 is concentrated mainly in the Swift-BAT energy range, only the BAT light curves are considered. We fit all the light curves (see Figure 1) of the burst in the different BAT energy bands with equation (1) and then measure the values of pulse-width () and the rise-to-decay ratio of pulse (, pulse asymmetry). The errors of and are derived from simulations by assuming a normal distribution of the errors of the fitting parameters. The reported errors are at confidence level. The results are listed in Table 1.
| Pulse A | Pulse B1 | Pulse B2 | Pulse B3 | |||||
|---|---|---|---|---|---|---|---|---|
| Band | ||||||||
| (keV) | (s) | (s) | (s) | (s) | ||||
| (1) 15-25 | 32.34.6 | 0.68 | 13.2 | 1.44 | 16.1 | 0.55 | 15.5 | 0.48 |
| (2) 25-50 | 28.43.2 | 0.63 | 12.6 | 1.36 | 15.1 | 0.59 | 15.0 | 0.52 |
| (3) 50-100 | 24.92.4 | 0.57 | 11.9 | 1.29 | 14.1 | 0.65 | 14.3 | 0.59 |
| (4) 100-350 | 20.35.1 | 0.37 | 11.1 | 1.31 | 13.3 | 0.71 | 13.4 | 0.62 |
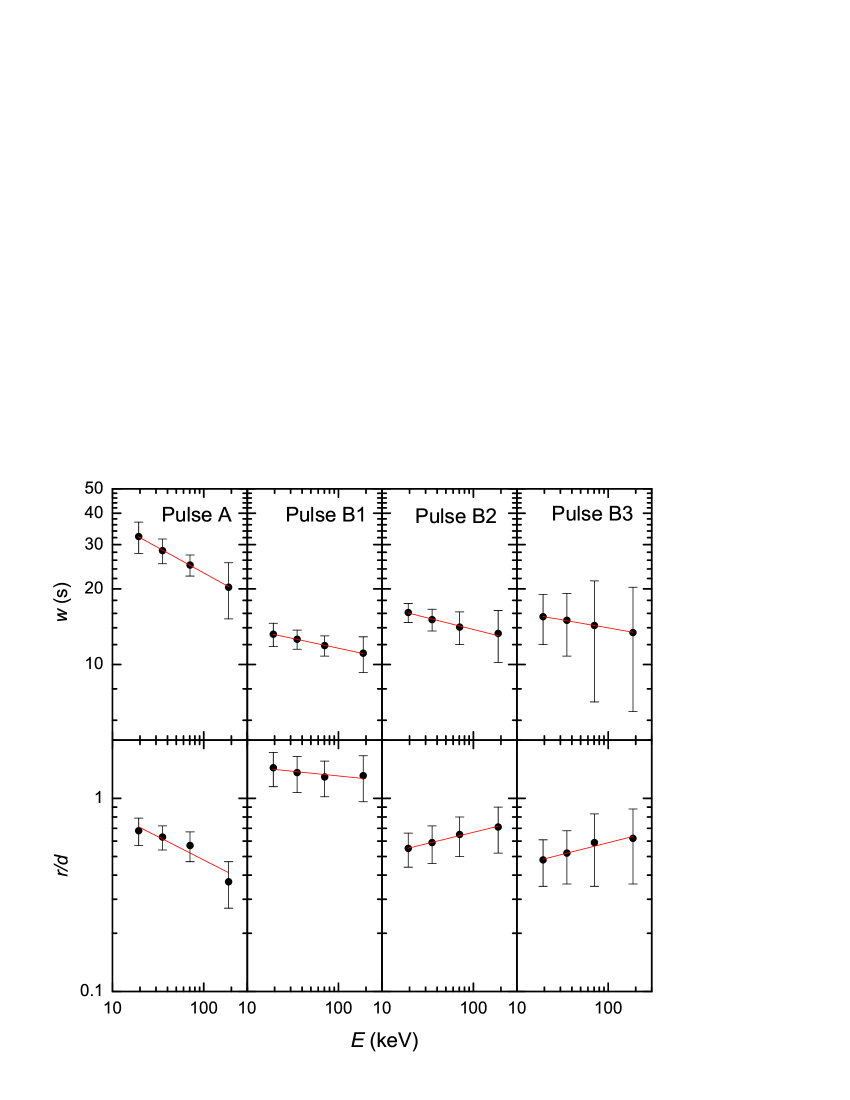
From Table 1, we find a significant trend: all the pulses tend to be narrower at higher energies. However, the pulse asymmetry dependence on the energy are different for the two emission episodes. The pulses B2 and B3 tend to be more symmetric at higher energies while the pulse A follows a reverse trend. To further study how the pulse width depends on energy in detail, we show and as functions of energy () in Figure 2, where is the geometric mean of the lower and upper boundaries of the corresponding energy band (this is adopted throughout this paper unless otherwise noted). Apparently both and are correlated with . The correlation analysis yields and for the pulse A, and for the pulse B1, and for the pulse B2, and and for the pulse B3. It is found that the relations of GRB 090618 are well consistent with those observed in the majority of long GRBs (e.g., Norris et al. 1996; 2005; Peng et al. 2006), but the power-law indices of the relations within this event are larger than those previously observed in typical GRBs (e.g., Fenimore et al. 1995; Norris et al. 1996; 2005), and the indices in the episode B are larger than that in the episode A. The large power-law indices of the relations in GRB 090618 can be explained from the fact that the distribution of power-law index of the relation has a large dispersion (see, Jia & Qin 2005; Peng et al. 2006; Zhang et al. 2007, Zhang & Qin 2008; Zhang 2008). In addition, we also find that the energy dependence of is different for the 4 pulses in the burst. The power-law indices of relation for the pulses A and B1 are negative111For the pulse B1, the power-law anti-correlation between and is not very robust, this is so because the pulse rising phase is likely affected by overlapping mini-pulses (see Figure 1)., while the power-law indices of the relation for the pulses B2 and B3 are positive. The two different energy dependence correlations of were observed previously within different bursts for a large set of GRBs in the BATSE database (see, Peng et al. 2006). The power-law correlation between and has been predicted theoretically by Qin et al (2004; 2005), who suggested that the emission associated with the shocks occurs on a relativistically expanding fireball surface, where the curvature effect must be important. However, it is unclear which mechanism is responsible of the power-law anti-correlation between and . As proposed by Peng et al. (2006), a varying synchrotron or comptonized radiation or a different pattern of the spectral evolution should be considered. Furthermore, the different dependence on energy of pulse asymmetries in one single GRB is reported firstly, this indicates that the evolution and/or nature of pulses might different in some GRBs and the different emission episodes are likely to originate from different physical mechanisms (e.g., Hakkila & Giblin 2004).
4 Pulse Spectral characteristics
To further check if the pulses in the two emission episodes of GRB 090618 have different properties and/or different physical origins, we have performed a detailed pulse spectral analysis.
4.1 Pulse spectral evolution
Pulse spectral evolution is very important to understand the physics of GRB pulses (and thus of GRB prompt emission). Page et al. (2011) performed 14 time-slices spectra for GRB 090618, and found that the peak energy initially decreases with time, then moves to higher energies during flaring activity. In general, there is a positive trend between peak energy and flux. In order to perform a more detailed study of the individual pulse spectral evolution in GRB 090618, 23 time-sliced spectra from both the Swift-BAT and Fermi-GBM (NaI and BGO) detectors, covering 150 s after the trigger, were extracted with single power-law (BAT) and cutoff power-law (CPL, joint BAT-GBM) models222The BAT and GBM data are publicly available at http://swift.gsfc.nasa.gov/ and http://fermi.gsfc.nasa.gov/.. In general, 5 s time interval is selected to perform time-resolved spectral analysis. For the weak emission in the begin and end stage of pulses, 10 s or 30 s time interval is adopted (see Table 2). The standard data analysis methods according to the BAT Analysis Threads333http://heasarc.gsfc.nasa.gov/docs/swift/analysis/threads/ bat_threads.html and the GBM Analysis Threads444http://fermi.gsfc.nasa.gov/ssc/data/analysis/scitools/ gbm_grb_analysis.html are used. The useful energy ranges for the BAT, NaI and BGO spectral fitting are 15150, 81000 and 20030 000 keV, respectively. Spectra were analyzed with Xspec(v12) software. Note that the Band model (Band et al. 1993) is extensively used to fit the GRB spectra. For GRB 090618, the high energy index in the Band model cannot be well constrained in most of the time slices (also see Page et al. 2011). For the purpose of comparing the spectral evolution of the different pulses of GRB 090618 under one spectral model, we choose the minimal simplest model, i.e. the CPL. The power-law index () from the BAT fit with the single PL model, and the peak energy and low-energy index () from the joint BAT-GBM fits with the CPL model are shown in Figure 3 and Table 2.
| PL (BAT) | CPL (BAT+GBM) | |||||
| t1 | t2 | /dof | Epeak | /dof | ||
| s | s | keV | ||||
| -5 | 5 | 1.01 0.02 | 38/56 | 0.71 0.03 | 235 15 | 432/410 |
| 5 | 10 | 1.26 0.03 | 62/56 | 0.89 0.04 | 193 18 | 381/410 |
| 10 | 15 | 1.38 0.03 | 63/56 | 0.97 0.06 | 156 19 | 418/410 |
| 15 | 20 | 1.51 0.03 | 64/56 | 1.11 0.07 | 155 24 | 467/410 |
| 20 | 25 | 1.66 0.03 | 77/56 | 1.3 0.09 | 162 39 | 472/410 |
| 25 | 35 | 1.87 0.04 | 77/56 | 1.05 0.16 | 64 13 | 454/410 |
| 35 | 45 | 2.16 0.08 | 61/56 | 1.53 0.22 | 98 55 | 434/410 |
| 45 | 50 | 1.69 0.03 | 43/56 | 1.37 0.04 | 317 50 | 463/410 |
| 50 | 55 | 1.52 0.02 | 38/56 | 1.2 0.03 | 313 28 | 524/410 |
| 55 | 60 | 1.41 0.02 | 39/56 | 1.06 0.1 | 500 26 | 922/410 |
| 60 | 65 | 1.38 0.01 | 44/56 | 1.14 0.1 | 389 13 | 721/410 |
| 65 | 70 | 1.51 0.01 | 53/56 | 1.23 0.02 | 234 12 | 508/410 |
| 70 | 75 | 1.74 0.02 | 56/56 | 1.37 0.02 | 245 17 | 604/410 |
| 75 | 80 | 1.66 0.02 | 50/56 | 1.31 0.02 | 278 14 | 642/410 |
| 80 | 85 | 1.6 0.02 | 57/56 | 1.3 0.02 | 250 14 | 577/410 |
| 85 | 90 | 1.71 0.02 | 60/56 | 1.33 0.04 | 153 14 | 455/410 |
| 90 | 95 | 1.83 0.02 | 63/56 | 1.39 0.07 | 116 15 | 421/410 |
| 95 | 100 | 1.99 0.03 | 60/56 | 1.39 0.09 | 81 12 | 415/410 |
| 100 | 105 | 1.97 0.03 | 78/56 | 1.4 0.07 | 103 13 | 449/410 |
| 105 | 110 | 1.97 0.02 | 73/56 | 1.48 0.05 | 111 10 | 409/410 |
| 110 | 115 | 2.13 0.02 | 63/56 | 1.6 0.06 | 97 11 | 437/410 |
| 115 | 120 | 2.22 0.03 | 70/56 | 1.56 0.07 | 74 10 | 395/410 |
| 120 | 150 | 2.39 0.03 | 61/56 | 1.81 0.1 | 80 14 | 447/410 |

From Figure 3, we conclude that GRB 090618 exhibits significant spectral evolution and the pulses in the different episodes have different spectral evolution trends555Here we only show the whole spectral evolution of GRB 090618 to depict individual pulse spectral evolution. It is known that the individual pulse spectrum cannot be divided from a GRB which have several overlapping pulses. The three pulses in the episode B of GRB 090618 are overlapping, but they can be identified well (see Figure 1). Therefore, the individual pulse spectral evolution trend in the episode B cannot be significantly affected by the overlapping effect.. of the pulse A shows a hard-to-soft evolutionary pattern, decreasing monotonically while the flux rises and falls, shows an opposite trend. In the three pulses of the episode B, there is a positive trend between and flux, while follows an opposite trend. The two types of spectral evolution patterns have been previously observed in pulses from different GRBs (e.g., Golenetskii et al.1983; Norris et al. 1986; Preece et al. 1998; Kaneko et al. 2006), but the phenomenon that the two types of spectral evolution patterns exist simultaneously in one single GRB is very infrequent. GRB 921207 is another case following such spectral evolution trend (see, Figure 4 of Ford et al. 1995 and Figure 2 of Lu et al. 2010). It is difficult to accommodate the two different spectral evolution trends under one mechanism. Lu et al. (2010) argued that it could be explained in terms of the viewing angle and jet structure effects.
4.2 Pulse spectral lag
| Pulse | Lag 21 | Lag 31 | Lag 41 | Lag 32 | Lag 42 | Lag 43 |
|---|---|---|---|---|---|---|
| (s) | (s) | (s) | (s) | (s) | (s) | |
| Pulse A | 2.19 | 6.01 | 10.88 | 3.82 | 8.69 | 4.87 |
| Pulse B1 | 0.53 | 0.98 | 1.34 | 0.45 | 0.81 | 0.36 |
| Pulse B2 | 0.32 | -0.20 | 0.38 | -0.52 | 0.06 | 0.58 |
| Pulse B3 | 0.49 | 1.06 | 1.70 | 0.57 | 1.21 | 0.64 |
Another observed effect of the spectral evolution in GRB data is spectral lag. Spectral lags are energy-dependent delays in the GRB temporal structure. Pulse peak lags are defined as the differences between the pulse peak times in different energy channels, which can be obtained for any pulse between two energy channels (e.g., Norris et al. 2005; Liang et al. 2006; Hakkila et al. 2008; Zhang et al. 2007; Zhang 2008). In general, soft pulses lag behind hard pulses. The pulse peak-fit method gives a simple straightforward way for extracting lags ( Norris et al. 2005; Hakkila et al. 2008). The pulse spectral lags between the four standard BAT energy bands (see Table 1) are displayed in Table 3. We find that the pulse A of GRB 090618 has a very longer lag (in all energy channel combinations) than all three pulses in the episode B. Using the cross-correlation function (CCF) analysis method, Page et al. (2011) analyzed the whole spectral lags in the two episodes of GRB 090618 and found that the episode A have a lag about a factor of 6 longer than for the episode B. Their result is consistent with our finding, although the episode B of GRB 090618 comprises three pulses. A similar phenomenon was also obtained by Hakkila & Giblin (2004). The early studies of burst spectral lags show that they vary within a given burst as well as from burst to burst (e.g., Norris 2002; Ryde et al. 2005; Chen et al. 2005). Multi-lag GRBs are ubiquitous. Therefore, we can not differentiate between their physical origins by only taking into account the spectral lags.
5 Conclusions and Discussion
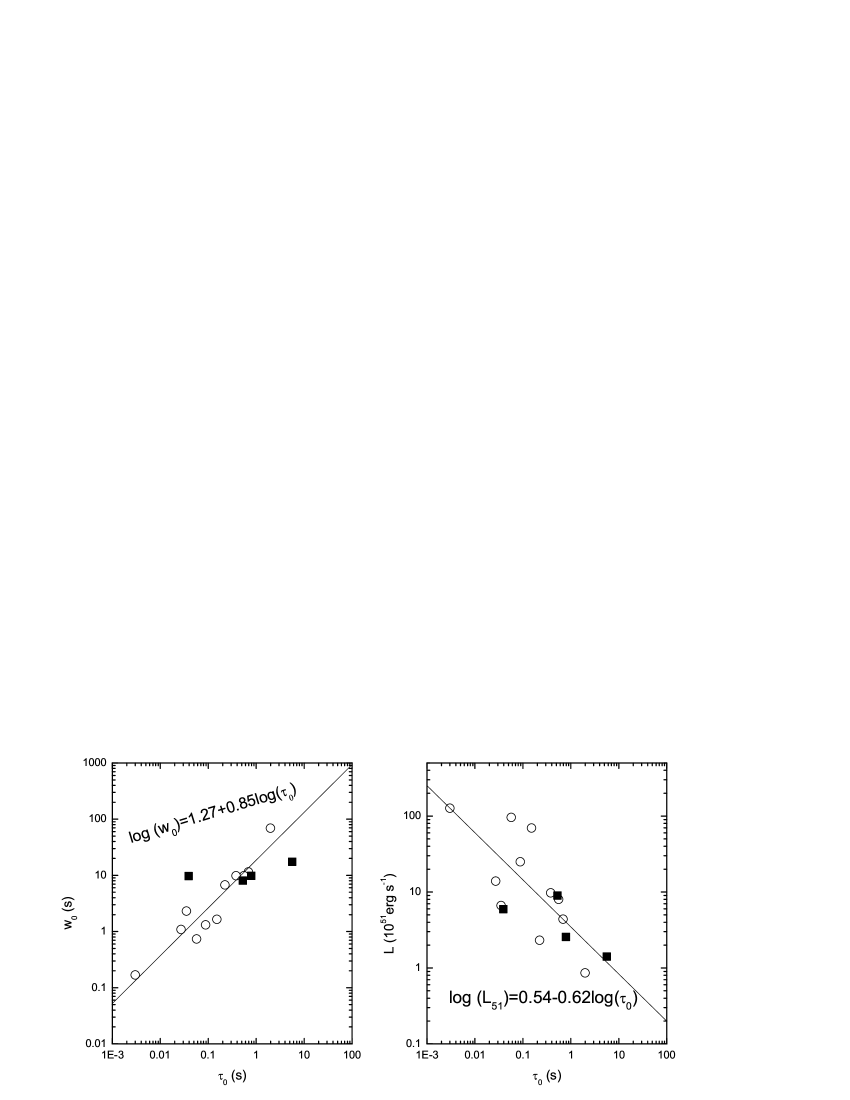
In this work we have used the pulse peak-fit method to analyze the pulse temporal and spectral characteristics of GRB 090618. We find that the pulses in the two emission episodes have different properties, including the energy dependence of pulse widths and the pulse asymmetries, the pulse spectral evolution patterns as well as the pulse lags. The different pulse temporal and spectral characteristics exhibit simultaneously in one single GRB, indicating there might be different origins in the different emission episodes of some GRBs. None of the mechanisms proposed so far can be used to account for this fact. Recently, Hakkila et al. (2008) and Hakkila and Cumbee (2009) found that isotropic pulse peak luminosity (), rest frame pulse peak lag (), and pulse duration () are correlated intrinsic properties of most GRB pulses, and argued that most pulses might result from variations on a single pulse type. To further understand the different pulse properties, we also calculated the values of , and for all pulses in GRB 090618 and compare their relations with the Hakkila et al. (2008) result (Figure 4). We find that the distributions of , and for the four pulses basically comply with the relations found by Hakkila et al. (2008). Such a result renders the interpretation of the different pulse temporal and spectral properties found in our earlier analysis much more challenging. The first episode is dimmer than the second episode and may be identified as a precursor of the burst. A precursor could either have the same origin as the main emission episode or it could be due to a different mechanism (see, Koshut et al. 1995; Lazzati 2005; Burlon et al. 2008, 2009). Recently, Penacchioni et al. (2011) proposed that GRB 090618 might be a members of a specific new family of GRBs presenting a double astrophysical component. A first one, related to the proto-black hole, prior to the process of gravitational collapse (episode A) and a second one which is the canonical GRB (episode B) emitted during the formation of the black-hole.
Better measurements are needed in order to improve our understanding of GRB pulse properties. Description and analysis of pulse properties can help to constrain physical models. The similar time evolution of pulse structures, combined with the fact that their measurable properties correlate strongly, suggests that one physical mechanism produces the observed array of pulse characteristics (see Hakkila et al. 2008; Hakkila & Cumbee 2009). There is strong evidence that the majority of GRB pulses results from internal shocks in relativistic winds (e.g. Sari & Piran 1997; Kobayashi et al. 1997; Daigne & Mochkovitch 1998; Ramirez-Ruiz & Fenimore 2000; Nakar & Piran 2002). Katz (1994) suggested that GRB pulse shapes originate from time delays inherent in the geometry of spherically expanding emission fronts. Liang et al. (1997) argued that saturated Compton up-scattering of softer photons may be the dominant physical mechanism that creates the shape of GRB pulses. According to Ryde and Petrosian (2002), the simplest scenario accounting for the observed GRB pulses is to assume an impulsive heating of the leptons and their subsequent cooling and emission. In addition, in the impulsive external shock model, a single relativistic wave of plasma interacts with inhomogeneities in the surrounding medium and form external shocks that accelerate particles which can also contribute to the formation of GRB pulses (Dermer et al. 1999). Although many studies have been performed to interpret the pulse characteristics, their nature is still unclear.
Acknowledgments We acknowledge the use of the public data from the Swift and Fermi data archive. We thank the anonymous referee for very detailed comments which helps in improving the quality of the paper. We also thank Yi-Zhong Fan for insightful comments. This work was supported by the National Natural Science Foundation of China (grants 11163003) and Guangxi Natural Science Foundation (2010GXNSFB013050).
References
- Amati (2002) Amati, L., et al. 2002, A&A, 390, 81
- Arimoto et al. (2010) Arimoto, M., et al. 2010, PASJ, 62, 487
- Band (1993) Band, D., et al. 1993, ApJ, 413, 281
- Baumgartner et al. (2009) Baumgartner, W. H., et al. 2009, GCN Circ. 9530
- Burlon et al. (2008) Burlon, D., Ghirlanda, G., Ghisellini, G., Lazzati, D., Nava, L., Nardini, M., & Celotti, A. 2008, ApJ, 685, L19
- Burlon et al. (2009) Burlon, D., Ghirlanda, G., Ghisellini, G., Greiner, J., & Celotti, A. 2009, A&A, 505, 569
- Cenko et al. (2009) Cenko, S. B., et al. 2009, GCN Circ. 9518
- Chen et al. (2005) Chen, L., Lou, Y.-Q., Wu, M., Qu, J.-L., Jia, S.-M., & Yang, X.-J. 2005, ApJ, 619, 983
- Daigne & Mochkovitch (1998) Daigne, F., & Mochkovitch, R. 1998, MNRAS, 296, 275
- Dermer et al. (1999) Dermer, C. D., Böttcher, M., & Chiang, J. 1999, ApJ, 515, L49
- Fan (2010) Fan, Y. Z. 2010, MNRAS, 403, 483
- Fan & Wei (2005) Fan, Y. Z., & Wei, D. M. 2005, MNRAS, 364, L42
- Fenimore et al. (1995) Fenimore, E. E., in’t Zand, J. J. M., Norris, J. P., Bonnell, J. T., & Nemiroff, R. J. 1995, ApJ, 448, L101
- Firmani et al. (2009) Firmani, C., Cabrera, J. I., Avila-Reese, V., Ghisellini, G., Ghirlanda, G., Nava, L., & Bosnjak, Z. 2009, MNRAS, 393, 1209
- Ford et al. (1995) Ford, L. A., et al. 1995, ApJ, 439, 307
- Ghirlanda et al. (2010) Ghirlanda, G., Nava, L., & Ghisellini, G. 2010, A&A, 511, A43
- Ghisellini (2010) Ghisellini, G. 2010, X-ray Astronomy 2009; Present Status, Multi-Wavelength Approach and Future Perspectives, in AIP Proc. 1248, 45
- Golenetskii et al. (1983) Golenetskii, S. V., Mazets, E. P., Aptekar, R. L., & Ilinskii, V. N. 1983, Nature, 306, 451
- Golenetskii et al. (2009) Golenetskii, S., et al. 2009, GCN Circ. 9553
- Hakkila & Giblin (2004) Hakkila, J., & Giblin, T. W. 2004, ApJ, 610, 361
- Hakkila et al. (2008) Hakkila, J., Giblin, T. W., Norris, J. P., Fragile, P. C., & Bonnell, J. T. 2008, ApJ, 677, L85
- Hakkila & Cumbee (2009) Hakkila, J., & Cumbee, R. S. 2009, in AIP Proc. 1133 (ed. Meegan, Gehrels, & Kouveliotou), 379
- Jia & Qin (2005) Jia, L.-W., & Qin, Y.-P. 2005, ApJ, 631, L25
- Kaneko et al. (2006) Kaneko, Y., Preece, R. D., Briggs, M. S., Paciesas, W. S., Meegan, C. A., & Band, D. L. 2006, ApJS, 166, 298
- Katz (1994) Katz, J. I. 1994, ApJ, 432, L107
- Kobayashi et al. (1997) Kobayashi, S., Piran, T., & Sari, R. 1997, ApJ, 490, 92
- Kocevski et al. (2003) Kocevski, D., Ryde, F., & Liang, E. 2003, ApJ, 596, 389
- Kono et al. (2009) Kono, K., et al. 2009, GCN Circ. 9568
- Koshut et al. (1995) Koshut, T. M., Kouveliotou, C., Paciesas, W. S., van Paradijs, J., Pendleton, G. N., Briggs, M. S., Fishman, G. J., & Meegan, C. A. 1995, ApJ, 452, 145
- Krimm et al. (2009) Krimm, H. A., et al. 2009, ApJ, 704, 1405
- Lazzati (2005) Lazzati, D. 2005, MNRAS, 357, 722
- Liang et al. (1997) Liang, E., Kusunose, M., Smith, I. A., & Crider, A. 1997, ApJ, 479, L35
- liang et al. (2006) Liang, E. W., Zhang, B.-B., Zhang, J., Zhang B., & Dai, Z. G. 2006, ApJ, 653, L81
- Longo et al. (2009) Longo, F., et al. 2009, GCN Circ. 9524
- Lu et al. (2010) Lu, R.-J., Hou, S.-J., & Liang, E.-W. 2010, ApJ, 720, 1146
- McBreen et al. (2009) McBreen, S., et al. 2009, GCN Circ. 9535
- Nakar & Piran (2002) Nakar, E., & Piran, T. 2002, MNRAS, 331, 40
- Norris et al. (1986) Norris, J. P., Share, G. H., Messina, D. C., Dennis, B. R., Desai, U. D., Cline, T. L., Matz, S. M., & Chupp, E. L. 1986, ApJ, 301, 213
- Norris et al. (1996) Norris, J. P., Nemiroff, R. J., Bonnell, J. T., Scargle, J. D., Kouveliotou, C., Paciesas, W. S., Meegan, C. A., & Fishman, G. J. 1996, ApJ, 459, 393
- Norris et al. (2000) Norris, J. P., Marani, G. F., & Bonnell, J. T. 2000, ApJ, 534, 248
- Norris (2002) Norris, J. P. 2002, ApJ, 579, 386
- Norris et al. (2005) Norris, J. P., Bonnell, J. T., Kazanas, D., Scargle, J. D., Hakkila, J., & Giblin, T. W. 2005, ApJ, 627, 324 (N05)
- Ohno et al. (2009) Ohno, M., Ioka, K., Yamaoka, K., Tashiro, M., Fukazawa, Y., & Nakagawa, Y. E. 2009, PASJ, 61, 201
- Page et al. (2011) Page, K. L., Starling, R. L. C., Fitzpatrick, G., et al. 2011, MNRAS, 416, 2078
- Penacchioni et al. (2011) Penacchioni, A. V., Ruffini, R., Izzo, L., et al. 2011, arXiv:1112.2970
- Peng et al. (2006) Peng, Z.-Y., Qin, Y.-P., Zhang, B.-B., Lu, R.-J., Jia, L.-W., & Zhang, Z.-B. 2006, MNRAS, 368, 1351
- Piran (2004) Piran, T. 2004, Reviews of Modern Physics, 76, 1143
- Preece et al. (1998) Preece, R. D., Pendleton, G. N., Briggs, M. S., et al. 1998, ApJ, 496, 849
- Qin et al. (2004) Qin, Y.-P., Zhang, Z.-B., Zhang, F.-W., & Cui, X.-H. 2004, ApJ, 617, 439
- Qin et al. (2005) Qin, Y.-P., Dong, Y.-M., Lu, R.-J., Zhang, B.-B., & Jia, L.-W. 2005, ApJ, 632, 1008
- Ramirez-Ruiz & Fenimore (2000) Ramirez-Ruiz, E., & Fenimore, E. E. 2000, ApJ, 539, 712
- Reichart et al. (2001) Reichart, D. E., Lamb, D. Q., Fenimore, E. E., et al. 2001, ApJ, 552, 57
- Ryde, F., & Petrosian (2002) Ryde, F., & Petrosian, V. 2002, ApJ, 578, 290
- Ryde et al. (2005) Ryde, F., Kocevski, D., Bagoly, Z., Ryde, N., & Mészáros, A. 2005, A&A, 432, 105
- Sari & Piran (1997) Sari, R., & Piran, T. 1997, MNRAS, 287, 110
- Sari et al. (1998) Sari, R., Piran, T. & Narayan, R. 1998, ApJ, 497, L17
- Schad et al. (2009) Schady, P., et al. 2009a, GCN Circ. 9512
- Wei & Gao (2003) Wei, D. M., & Gao, W. H. 2003, MNRAS, 345, 743
- Yonetoku et al. (2004) Yonetoku, D., et al. 2004, ApJ, 609, 935
- Zhang et al. (2006) Zhang, B., et al. 2006, ApJ, 642, 354
- Zhang (2007) Zhang, B. 2007, Chinese Journal of Astronomy and Astrophysics, 7, 1
- zhang et al. (2007) Zhang, F.-W., Qin, Y.-P., & Zhang, B.-B. 2007, PASJ, 59, 857
- Zhang (2008) Zhang, F.-W. 2008, ApJ, 685, 1052
- zhang & Qin (2008) Zhang, F.-W., & Qin, Y.-P. 2008, NewA, 13, 485
- Zhang (2011) Zhang, F. W. 2011, Galaxy Evolution: Infrared to Millimeter Wavelength Perspective. Proceedings of a conference held at Guilin, China 25-29 October 2010. San Francisco: Astronomical Society of the Pacific, 446, 149