The influence of transition metal solutes on dislocation core structure and values of Peierls stress and barrier in tungsten.
Abstract
Several transition metals were examined to evaluate their potential for improving the ductility of tungsten. The dislocation core structure and Peierls stress and barrier of screw dislocations in binary tungsten-transition metal alloys (W1-xTMx) were investigated using first principles electronic structure calculations. The periodic quadrupole approach was applied to model the structure of dislocation. Alloying with transition metals was modeled using the virtual crystal approximation and the applicability of this approach was assessed by calculating the equilibrium lattice parameter and elastic constants of the tungsten alloys. Reasonable agreement was obtained with experimental data and with results obtained from the conventional supercell approach. Increasing the concentration of a transition metal from the VIIIA group, i.e. the elements in columns headed by Fe, Co and Ni, leads to reduction of the elastic constant and increase of elastic anisotropy A=. Alloying W with a group VIIIA transition metal changes the structure of the dislocation core from symmetric to asymmetric, similar to results obtained for W1-xRex alloys in the earlier work of Romaner et al (Phys. Rev. Lett. 104, 195503 (2010)). In addition to a change in the core symmetry, the values of the Peierls stress and barrier are reduced. The latter effect could lead to increased ductility in a tungsten-based alloy. Our results demonstrate that alloying with any of the transition metals from the VIIIA group should have similar effect as alloying with Re.
pacs:
74.70.Dd,72.15.-v,74.25.-qI Introduction
Tungsten is the prime candidate for use in the divertor of future fusion reactors because of its high melting temperature and resistance to sputtering El-Guebaly et al. (2011); Nygren et al. (2011). However, its lack of ductility is an impediment to its use. The low-temperature brittleness is a common problem for all metals from the VIA group, such as chromium, molybdenum and tungsten Klopp (1969). The ductility of these metals can be improved by alloying with rhenium, leading to the so-called ”Re effect” Geach and Hughes (1956); Klopp (1969); Savitskii et al. (1965). However, Re, is a very rare and expensive element. It is therefore desirable to find alternate elements which provide a similar increase in ductility at lower cost. An experimental investigation of the range of candidates in the periodic table would be rather expensive, but computational materials science methods based on accurate first-principles calculations provide a very promising way to narrow the range of possible candidates.
Several possible mechanisms for the Re-effect have been discussed Edington et al. (1966); Klopp (1969); Raffo (1969); Luo et al. (1991); Gornostyrev et al. (1991); Trefilov et al. (1975); Kurdyumova et al. (1980), and the following two mechanisms are selected as most promising in application to monocrystals, i) solid solution softening in which an impurity improves mobility of 1/2(111) screw dislocation and ii) enhancement of cross-slip in which an impurity modifies the dislocation core structure making it easier to cross-slip and increasing the number of possible slip planes. Both of these are related to the effect of impurities on the dislocation core and may be amenable to investigation by first-principles computational methods even though such calculations cannot be used to directly estimate the mechanical properties. Therefore, it should be possible to define one or more calculable figures of merit that are related to a material’s elastic properties and potentially to ductility. Among the potential figures of merit are the material’s individual elastic constants, Poisson’s ratio Gao et al. (2008), and Peierls stress; and there is strong evidence that these parameters are also directly related to the electronic structure of particular impurities.
The experimentally observed strong correlation between the number of valence electrons on the solute atom and the degree of softening Hiraoka et al. (2004); Klopp (1975); Stephens and Witzke (1975) points to the importance of electronic factors in solution softening Medvedeva et al. (2005, 2007). First principles calculation Romaner et al. (2010); Li et al. (2012) indicate that the ductilizing effect of Re could originate from ”direct” improvement of the mobility of screw dislocations Raffo (1969); Trinkle and Woodward (2005); Medvedeva et al. (2005, 2007), either by decreasing the Peierls stress, or enhancing cross-slip by changing the slip plane from to which would increase the number of available slip planes from 6 to 12 Edington et al. (1966); Garfinkle (1966). First principles density functional (DFT) calculations demonstrated that alloying with Re in a W1-xRex alloy leads to a transition of the screw dislocation structure from the symmetric core to asymmetric core, and to a reduction in Peierls stress Romaner et al. (2010). Closely related results were obtained from first-principles calculation for Mo alloys with 5 transition metals Trinkle and Woodward (2005). The authors Trinkle and Woodward (2005) placed solutes in a row along the dislocation core and calculated the change of stiffness associated with moving the row along the direction. According to the results, solutes having fewer electrons (Hf and Ta) increase the stiffness, which authors infer strengthens the Mo alloy, whereas those having more electrons (Re, Os and Ir) decrease stiffness, leading to softening.
The goal of the present investigation is to study possible substitutes for Re in alloys that will result in a similar ductilizing effect as Re. The properties of W-transition metal (TM) alloys, were modeled using the virtual crystal approximation Faulkner (1982) (VCA). The applicability of this approach to modeling elastic properties, structural stability and phonon properties of a W-Re alloy has been demonstrated Gornostyrev et al. (1991); Persson et al. (1999); Ekman et al. (2000). The approach we use can be described as follows. First, a dislocation is placed in the effective media representing the W-TM alloy. The properties of the dislocation in this medium are calculated exactly but for a W-TM alloy described by a pseudopotentail which is the weights average of the actual pseudopotentials of the impurity and host atoms and the averaged number of electrons. A periodic lattice is used with the lattice parameter chosen by obtain zero pressure condition. This approach corresponds to a zero order contribution to the electronic system energy expansion with respect to the difference between real atomic potentials and the virtual atom. Such an approach allows separating the so-called ”band structure effects”, in this particular case filling of -states, from the effect of local modification of the lattice due to W substitution. The latter is not possible in a direct super cell calculation. It was demonstrated Romaner et al. (2010) that dislocation properties are sensitive to modifications of this effective media and alloying with Re leads to a sizable reduction of Peierls stress and barrier. Within this approach, a comparison of elastic constants calculated using the VCA and super-cell methods provides a verification of the VCA accuracy as we demonstrate below.
We show that alloying with transition metals with a higher number of electrons (VIIIA group) reduces the Peierls stress and barrier for a screw dislocation. Similar to W-Re alloys, the dislocation core symmetry is reduced by alloying with TM from group VIIIA. It is demonstrated that the scale of Peierls barrier reductions are similar for all W1-xTMx alloys with the same ratio of electrons per atom (). Although, the VCA approach describes an influence of band-structure on the properties of screw dislocations, it does not describe the discrete nature of alloy structure. However, this approach permits an assessment that can significantly reduce the range of possible solute candidates suitable for Re substitution. This paper is organized as follows. In section II we briefly review computational details used in the calculations. Section III.1 describes the electronic structure of tungsten and its alloys with transition metals from IVA, VA and VIIA groups. This is an almost complete list of possible binary solid solutions Lassner and Schubert (1999). The results of modifications to the elastic constants with alloying are discussed in section III.2. Section III.3 presents our prediction of core structure, Peierls barrier and Peierls stress for W1-xTMx alloys. Finally, the conclusions are given in section IV.
II Computational approaches
The electronic structure within the generalized gradient approximation (GGA) of density functional theory (DFT) was calculated using the QUANTUM ESPRESSO (QE) package Giannozzi et al. (2009). The calculation was done using a plane-wave basis set and ultrasoft pseudo-potentials optimized in the RRKJ scheme Rappe et al. (1990). We used the Perdew-Wang Perdew and Wang (1992) exchange-correlation functional. The Brillouin zone (BZ) summations were carried out over a BZ grid for the system with one unit cell and grid for the supercell containing unit cells, with electronic smearing with a width of 0.02 Ry applied according to the Methfessel-Paxton method. The plane wave energy cut off of 42 Ry allows reaching an accuracy of 0.2 mRy/atom. As a realization of VCA for the pseudo potential method, we used the scheme proposed by Ramer and Rappe Ramer and Rappe (2000). The elastic constants were calculated from the total energies obtained for the set of unit cell deformations Mehl et al. (1990).
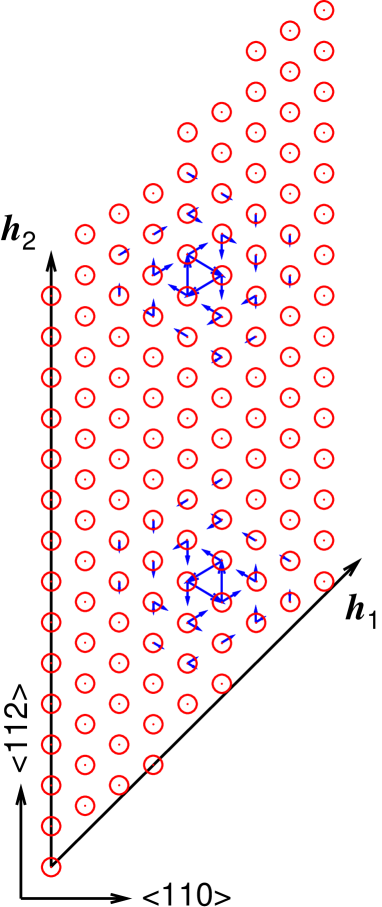
We use a periodic quadrupolar arrangement for a screw dislocation Bigger et al. (1992) in the cell with basis vectors , and , where , and . An appropriate choice of lattice vectors Bigger et al. (1992) reduces the quadrupole cell to half the size, and we therefore use a cell with basis vectors equal , and and 135 atoms. This unit cell contains only two dislocations with opposite Burgers vectors (Fig. 1). It was demonstrated earlier that this cell size is large enough to reproduce such characteristics of the dislocations as Peierls stress and barrier Segall et al. (2001a); Ismail-Beigi and Arias (2000); Segall et al. (2003); Frederiksena and Jacobsena (2003); Li et al. (2004); Ventelon and Willaime (2007); Odbadrakh et al. (2011) reasonably well if the elastic interaction correction is included. We are interested in how the barriers change with solute concentration and therefore the above correction is not included since it’s the same for all concentrations. For the dislocation calculation, the BZ summation was carried out over a BZ grid Romaner et al. (2010) and the initial structure was relaxed until the forces were smaller than 0.0005 Ry/Å.
III Results
III.1 Electronic structure
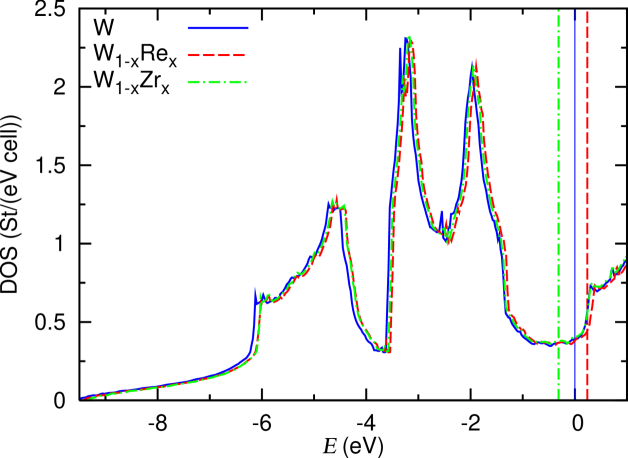
The electronic density of states (DOS) calculated using the VCA are presented in Figure 2 (colored online) for pure tungsten (blue solid line) and two tungsten alloys, one with 6.25 % Re (red dashed line) and the second one with 6.25 % Zr (green dash-dot line). Zero energy on this plot corresponds to occupation of electronic bands by six electrons. Thus, for pure tungsten, zero energy corresponds to the Fermi level. The Fermi energy is placed in the pseudo gap between bonding and antibonding -states. As can be seen from Fig. 2, alloying with Re or Zr doesn’t produce sizable changes in the DOS, at least in VCA approach. The substitution of tungsten with 6.25 % Re leads to an upwards shift of the Fermi energy, shown by a red vertical line. The area under DOS between zero energy and the W0.9375Re0.0625 Fermi energy corresponds to 0.0625 additional electrons, i.e., occupation of each virtual atom by an additional 0.0625 electrons. Correspondingly, alloying with atoms that have a lower number of electrons, such as Zr, leads to a downward shift of the Fermi energy, shown by vertical green line, and each virtual atom is occupied by 0.0625 fewer electrons.
Such a modification of electronic structure in tungsten alloys can be described using the rigid band approximation Faulkner (1982). This approach assumes that alloying does not change the DOS but shifts the Fermi level, so the occupation of each virtual atom corresponds to the average number of electrons per atom in the alloy. Thus, within this approximation, all alloys with the same value have the same properties. The concentration of different alloying elements which have the same value can be calculated through the simple expression
| (1) |
, where is the number of valence electrons of the alloying atom and is the number for tungsten. Although this approach has limited accuracy, it can be very useful for qualitatively estimating the change in such properties as elastic constants or Peierls barrier. It should be mentioned that alloying of tungsten with TM from VIIA and VIIIA groups, within their solubility limits, fills bonding states with additional electrons and increases strength of the bonds. It reflects in the increase of cohesive energy and reduction of Wigner-Seitz radius for 4 TM with filling of bonding states and reduction of cohesive energy and increase of Wigner-Seitz radius with filling of antibonding states Moruzzi et al. (1977).
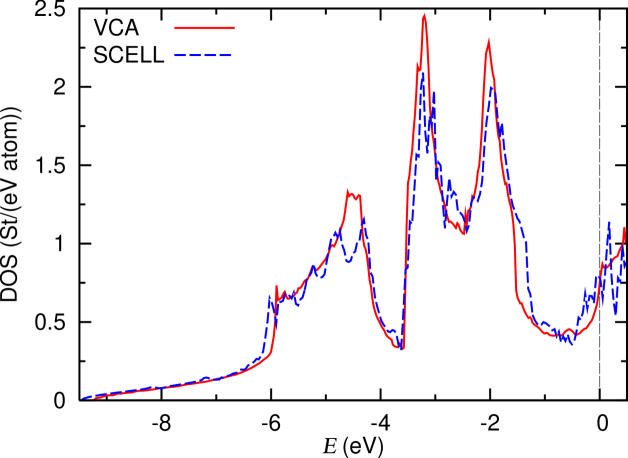
The VCA approach could be quite inaccurate for describing the properties of disordered substitutional metallic alloys, especially for transition metals Faulkner (1982) and therefore the accuracy of this approach should be analyzed in each particular case. In order to verify the accuracy of VCA we compared its results with those obtained using a supercell approach. The supercell contained cubic unit cells with one tungsten atom substituted by a solute atom. Thus, the solute concentration corresponds to 6.25 %. In Figure 3, the DOS calculated using the supercell (blue line) and VCA models (red line) are presented for W15Fe. The DOS calculated using the VCA approach is very close to the supercell result. Comparisons of elastic properties calculated using the two approaches will be discussed below.
III.2 Elastic constants
The modification of elastic properties in W-Re alloys has been widely investigated both experimentally Ayres et al. (1974) and theoretically Persson et al. (1999); Ekman et al. (2000). Here we expand these investigations to a wide set of tungsten-based alloys. The results of equilibrium lattice constant, , bulk modulus, , and elastic constants, , , and , calculated by both VCA and supercell methods, are presented in Table LABEL:elst_cnst_vca_vs_sc. For the elastic constants, the largest difference between calculated and experimental values was obtained for and is about 13 % for the VCA calculations and slightly larger for super cell calculations (SC). The agreement between VCA and SC results W alloys with Zr, Ta, and Re is very good and differences for elastic constants do not exceed 2 %. Hoever this difference increases for alloys with solute atoms with a larger number of valence electron. For example, for the Fe-family (Fe, Ru and Os) the difference is about 5 %, while for the Co- (Co, Rh and Ir) and for Ni-families (Ni, Pd and Pt) the difference increases to 12-15 %. Since we investigate the reduction of Peierls stress and barrier for alloys in which the number of valence electrons per atom corresponds to 10 % of Re or smaller the elastic properties of the alloys should be described with an accuracy similar to Re of 5 % or less. As discussed above, alloying of tungsten with transition metals with a higher number of electrons, metals from the VIIA and VIIIA groups, fills bonding states. According to the general results obtained for transition metals Moruzzi et al. (1977); Faulkner (1982), this filling leads to a decrease of the lattice parameter. The calculated results for W1-xRex alloys reproduce this general tendency (see Table LABEL:elst_cnst) and agrees with experiment Ayres et al. (1974). The same tendency was obtained in tungsten alloyed with other TM except Pd and Pt. For these two elements, the lattice parameter calculated in SC slightly increases. Another general trend for all tungsten alloys with solute atoms having a higher number of electrons is reduction of the elastic constant. The calculated results in Table LABEL:elst_cnst are also in good agreement with experimental values for the W-Re alloy Ayres et al. (1974) and reflect a reduction in the stability of bcc structure. At concentrations higher than x=0.25% the bcc W1-xRex transforms to the -phase Massalski et al. (1986). Similar to previous results Persson et al. (1999), the modulus decreases with Re concentration until it becomes negative at 85 % Re. This change in the sign of corresponds to the dynamic loss of stability of the bcc structure. The elastic constant corresponds to the long-wave transversal phonon branch in directions (T ) and softening of this phonon mode provides a transition path from the bcc to dhcp structure (see discussion in Persson et al. (1999)).
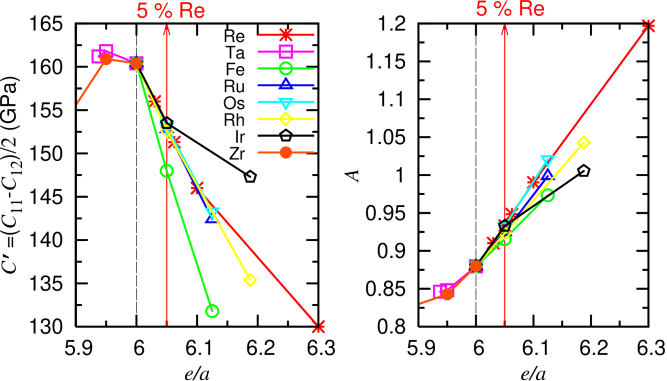
According to the rigid band model discussed in the previous section, the parameter which determines the elastic properties of W1-xTMx alloys is the number of electrons per atom (see explanation of Eq.1). In Fig. 4 the elastic constant and elastic anisotropy are presented as a function of . The and values are very similar for all TM from group VIIA and VIIIA except for Fe and Ir. However, even for these two elements the deviation from the average values is around 7 %. Additional evidence for the importance of the parameter follows from the correlation between the width of the stable bcc solid solution region of W1-xTMx and the number of valence electrons for TM elements from groups VIIA and VIIIA Massalski et al. (1986). Alloys with solute atoms having a higher number of valence electrons have a narrower solid solution region.
III.3 Dislocation core structure, Peierls stress and Peierls barrier.
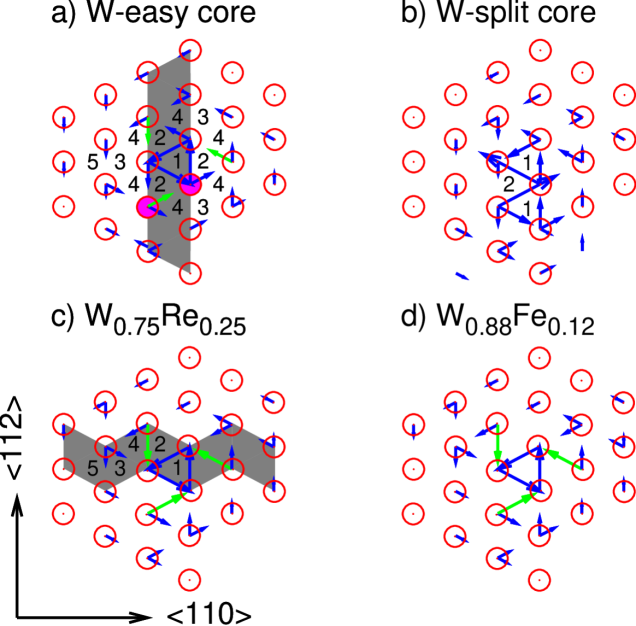
In bcc structures screw dislocations have three nonequivalent core configurations, that are referred to as ”easy”, ”hard” and ”split” Vitek (1974); Xu and Moriarty (1996); Ismail-Beigi and Arias (2000); Takeuchi (1979) - stable and two metastable, respectively. These configurations can be obtained for a given Burgers vector by placing the core origin in specific positions. Recently, it was demonstrated that in bcc Fe the lowest energy is the symmetric ”easy” core configuration, then symmetric ”hard” core and the highest energy is the ”split” core configuration Itakura et al. (2012). In a contrast to Fe, for the case of W we determined that the symmetric ”hard” core configuration decays into the ”split” core. Thus, in the present publication we assume that the dislocation migrates between the ”easy” and the ”split” core configurations.
Following, Xu and Moriarty Xu and Moriarty (1998) we marked these sites as 1, 4 or 5 for ”easy” cores and site 2 or 3 for ”split” cores in Figure 5. The calculated structure of the ”easy” core configuration for a dislocation is shown in Fig. 5 for pure W, W0.75Re0.25 and W0.88Fe0.12, where the concentrations of transition metals were chosen to give the same value. The circles in Fig. 5 represent W atoms looking in the direction and the dislocation structure is illustrated by differential displacement (DD) maps Vitek (1974). On a DD map the displacement of atoms in the [111] direction relative to a neighbor is plotted as an arrow connecting the atom with its neighbors. The length of an arrow is normalized so that arrows connecting two atoms corresponds to displacement by . Thus, summing arrows in the circuit around a dislocation gives the Burgers vector. For tungsten alloys with VIIIA group TM having the same value, the core configurations looks exactly the same as for the Re and Fe alloys. On the contrary, alloying with Ta or Zr produces the same core symmetry as pure tungsten. The same result was obtained for W-Ta by Li et al Li et al. (2012). The core structure of pure W is symmetric, as shown in Figure 5a, i.e., the dislocation expands equally along the six directions, similar to results obtained earlier Romaner et al. (2010).
Alloying with Re or any other TM with a higher number of valence electrons leads to a change in dislocation core structure from symmetric to asymmetric. The core is spread out in three directions on planes Xu and Moriarty (1998). There are a six possible orientations and the core is thus double degenerate. The transition from symmetric to asymmetric core can change the dislocation slip plane Romaner et al. (2010). The symmetric core dislocations glide uniformly on planes; asymmetric ones glide in a zigzag manner Hirth and Lothe (1982) and the slip plane changes to . Using the core site notation in Figure 5, the symmetric core glide path , which is shown by the gray band in Figure 5a, will be changed to glide path , shown by the gray band in Figure 5c Gröger (2007) . In the present work, the transition from symmetric to asymmetric core was obtained in the VCA calculations and this result was confirmed for the W-Re alloy in a super cell model calculation reported earlier Romaner et al. (2010); Li et al. (2012).
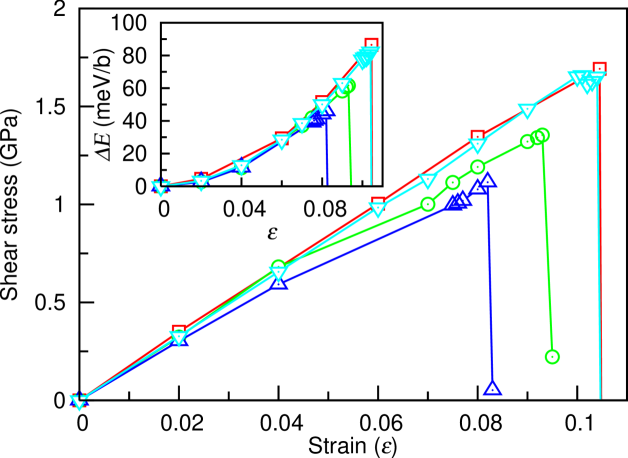
Addition of Re or any TM from group VIIIA leads to the change of dislocation slip plane and decrease in the value of Peierls stress Romaner et al. (2010). Following a widely used technique Segall et al. (2001b), we apply pure shear strain in the direction which results in a stress that has as its main component, the influence of can be neglected since for pure W. The corresponding strain is produced by modification of the basis vector along direction . Figure 6 shows the dependence of total energy (see inset) per dislocation per Burgers vector and shear stress as a function of strain, .
For small strains, i. e. in the elastic regime, the energy increases as . At larger the energy dependence deviates from square dependence and abruptly drops. This drop in energy is caused by a jump of the dislocation core to the next stable ”easy” core neighboring position (). The corresponding stress and strain are considered to be the Peierls stress and strain . Earlier it was demonstrated Romaner et al. (2010) that the cell size of 135 atoms as used in the present work is enough to reach convergence in values. Alloying with both Re and Fe reduces values of and . For Fe this reduction is even larger than for Re although the solute concentrations corresponds to the same value in both cases. The absolute value of equal to 1.71 GPa for pure tungsten (Table LABEL:PS)) is somewhat lower than those obtained earlier Romaner et al. (2010), which were 2.09 GPa using QE and 2.37 GPa using VASP. The difference is attributed to the use of different types of pseudo-potentials, ultra-soft in our case and norm-conserving (QE) and PAW (VASP) in Romaner et al. Romaner et al. (2010), and the higher accuracy obtained using our larger plane wave energy cut-off of 42 Ry compared to 30 Ry (QE calculations) and 16.4 Ry (VASP calculations) Romaner et al. (2010). Moreover, the norm-conserving pseudopotential would require an even larger cut-off energy than the ultra-soft one. The relative reduction of is 20 % for Re and 36 % for Fe. A larger reduction of in tungsten-iron alloys correlates with the larger reduction of modulus caused by alloying with Fe (Figure 4 and Table LABEL:elst_cnst). These results demonstrate that even if the reduction of Peierls stress and values can be qualitatively understood as arising from a filling of -states in tungsten by additional electrons from group VII and VIII solutes, some other element-specific mechanism exists. It should be mentioned that the solubility limit of Fe in W is around 2% and in the concentration of Fe in limited to this value the reduction of Peierls barrier is about one half of that of the alloy with 5% Fe. For the W-Ru alloy with a solubility limit of 3 %, is reduced by 6 %. This result is consistent with the experimentally observed reduction of ductile-brittle transition temperature in W-Ru alloy O’Dell et al. (2012).
The second method used in present work to estimate Peierls stress was originally proposed by Nabarro Nabarro (1947), and has been discussed in publications by Gröger et al. Gröger (2007); Gröger and Vitek (2012). Following Nabarro, we measure the system energy as a function of the dislocation location as it moves from position 1 to position 2 in Figure 5. It is easy to see that both ( slip plane) and ( slip plane) paths contain a set of dislocation core jumps between ”easy” and ”split” core configurations with the same barrier. The energy dependence obtained is associated with the Peierls barrier and the Peierls stress is given by the maximum gradient of this function
| (2) |
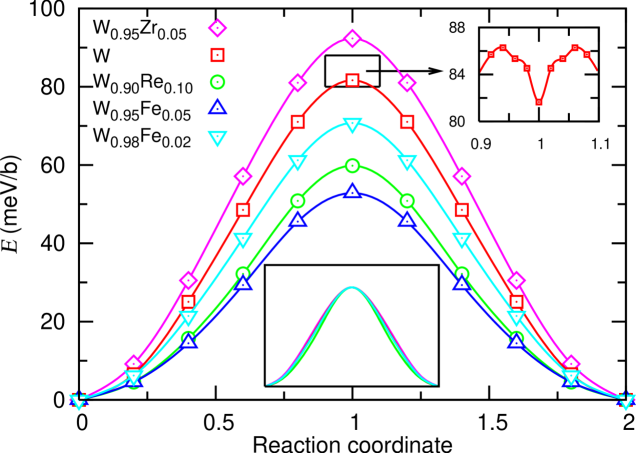
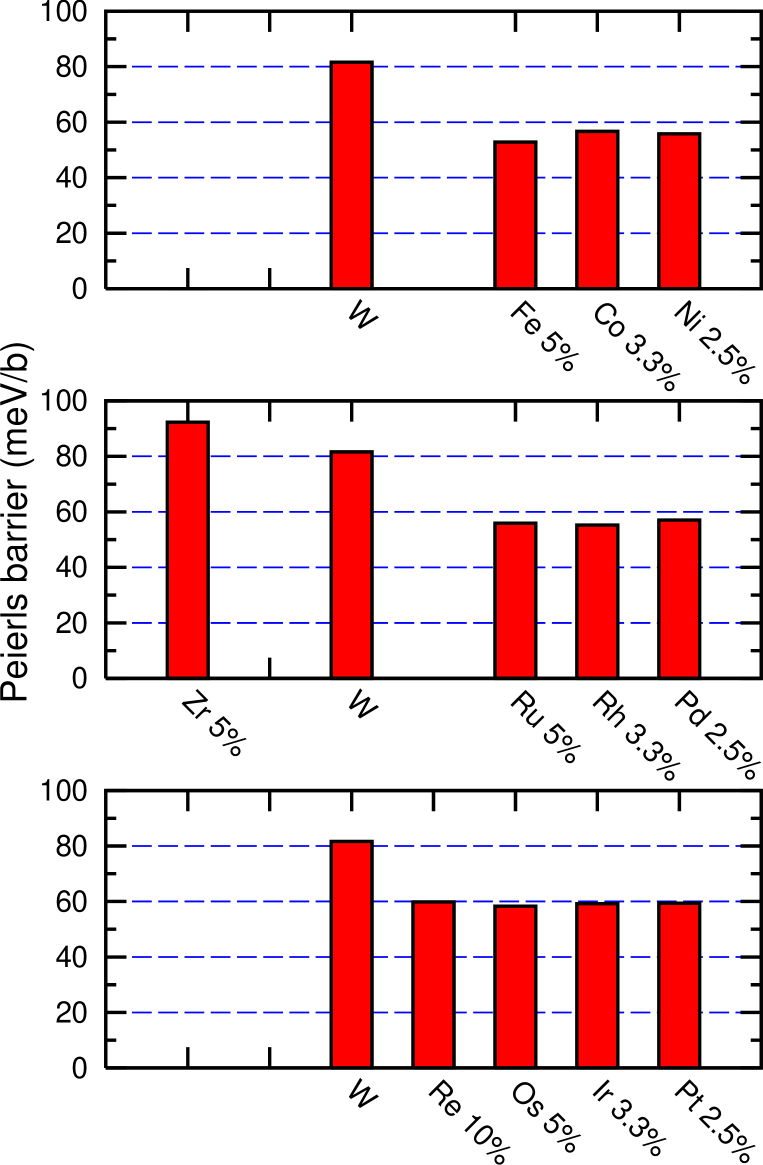
where is the Burgers vector, is energy per unit length of a straight dislocation and is the distance along the dislocation core path on the move from 1 to 2. equals 0 for position 1 and , where is the lattice parameter, for the position 2. We use the drag method, also called the reaction coordinate method Xu and Moriarty (1998), to move the dislocation from 1 (”easy”) to 2 (”split”) core configuration. According to this method, the -coordinates of atoms in two columns around both cores in the modeling cell, shown by purple circles in Fig. 5a, are fixed so that , where and correspond to the -coordinate of the specified atoms in the ”easy” and ”split” core configurations respectively, and ) is the so called reaction coordinate. In the initial implementation Xu and Moriarty (1998), the authors fix the -coordinate of atom which has the largest displacement resulting from the movement of the dislocation core. However from our experience the atomic relaxation convergence increases if we fix the -coordinate of any two of the three atoms surrounding site 2 in Fig. 5a. In order to avoid any changes in the elastic interaction between dislocations, both cores are moved simultaneously. The results obtained for the Peierls barrier changes are presented in Figure 7 for pure tungsten and alloys of tungsten with Re, Fe, Ru and Zr. In order to demonstrate that the ”split” core configuration corresponds to a metastable state, we calculated the potential barrier using a small reaction coordinate step for pure tungsten around . As can be seen from the results presented in the upper insert in Figure 7, the ”split” core configuration corresponds to a local minimum in the potential energy. When normalized using the values for pure tungsten, the shape of the Peierls barrier for the alloys is shown to be similar to tungsten and quite insensitive to solute type and concentration, see lower insert of Figure 7. In all these alloys, the results yield a single barrier. For alloys with Os, Ir, Pt, Ru, Rh, Pd, Co and Ni the total energy was calculated for the ”easy” core (reaction coordinate, ) and ”split” core (). Since the shape of Peierls barrier is insensitive to type of solute, the difference between these energies provides an estimate of the value of the Peierls barrier as shown in Figure 8. The reduction of the Peierls barrier observed in these calculations correlates well with the reduction in Peierls stress estimated in the deformation simulation described above. Alloying with Re or any group VIII transition metal at a concentration which corresponds to reduces the barrier by 25 %. Fe reduces the Peierls barrier even more significantly, whereas Zr increases the barrier. This is consistent with the effect obtained for Mo alloys with 5 transition metals in which placing a row of solute atoms with higher number of valence electrons along the dislocation core reduce stiffness and a row of atoms with lower number increase stiffness Trinkle and Woodward (2005).
The Peierls stress calculated using the direct deformation method, , and from the Peierls barrier using Eq.2, are presented in Table LABEL:PS. For all alloys the Peierls stress values obtained from the Peierls barrier are lower than those from the direct method. The difference is largest, 14 %, for W alloys with 10 % Re, or 2 % Fe. Thus, the results, introduction of 2 % Fe to tungsten reduces the Peierls stress by 12 %. While for the pure W and W alloy with 5 % of Fe it is below 5 %. Gröger and Vitek Gröger and Vitek (2012) connected the discrepancy in the results of two methods with the fact that both drag and Nudged Elastic Band Jonsson et al. (1998) (NEB) methods garantee that images of the system are distributed uniformly along the minimum energy path and do not implay that dislocation position is distributed along this path. In order to overcome this problem, the authors introduced a modified NEB Gröger and Vitek (2012) method which gives a Peierls stress that agrees within 8 % of the directly calculated stress. However we believe that the 14 % accuracy obtained in our calculation is reasonably good considering that maintains the same trend in . It should be metioned that problems with direct application of drag or NEB methods can be more substentional. According to modeling result obtained in the deformed cell the dislocation core structure is slightly modified with increase of deformation and then jumps directly to next ”easy” core position. The dislocation core is not observed in metastable, ”split” core position. Thus the agreemnt between data presented in Table LABEL:PS gives a support to application of drag method to calculation of Peierls stress.
The reduction of Peierls stress/barrier due to alloying with transition metals with a higher number of valence electrons and the increase for lower number of valence electrons is supported by existing experimental data. Hardening was observed in W-Zr alloys Pod’yachev and Gavrilyuk (1975) and softening in W-Re/Ir alloys Luo et al. (1991). Very interesting experimental results for Mo alloys with group VIIIA transition metals were presented by Hiraoka et al Hiraoka et al. (2004). The authors report a decrease of yield strength with addition of any element from group VIIIA, Fe, Co, Ni or Pd. The author concluded that this effect could be well understood in the terms number of valence electrons of alloying elements, and that the effect of atomic size mismatch is secondary and minor. Although the value of yield strength is not directly related to ductility, the observed correlation of properties with value supports the validity of our calculation using the VCA approach.
IV Conclusions
The influence of alloying tungsten with transition metal solutes on the elastic properties and properties of screw dislocation based on electronic structure calculations. In comparison with a standard supercell method, we demonstrated that the virtual crystal approximation gives a fairly good description of such alloying, especially in the case of 4 and 5 transition metals. For the case of alloying with transition metals from group VIIIA, the modification of elastic constants, Peierls stress and barrier can be understood within the rigid band approximation. This means that alloys with TM concentrations leading to the same number of electrons per atoms exhibit a similar reduction of modulus and elastic anisotropy . Together with this modification of elastic moduli the value of the Peierls stress and barrier are reduced by alloying with transition metals from group VIIIA. In addition to the Peierls barrier reduction, alloying with any metal from this group changes the ”easy” core dislocation structure from the symmetric to asymmetric configuration. This similarity allows us to conclude that the search for an alternative to Re could be reduced to transition metals from the group VIIIA.
V Acknowledgments
Work was supported by the U.S. Department of Energy Office of Fusion Energy Sciences. This research used resources of the National Energy Research Scientific Computing Center, which is supported by the Office of Science of the U.S. Department of Energy.
References
- El-Guebaly et al. (2011) L. El-Guebaly, R. Kurtz, M. Rieth, H. Kurishita, A. Robinson, and A. Team, Fusion Science and Technology 60, 185 (2011).
- Nygren et al. (2011) R. Nygren, R. Raffray, D. Whyte, M. Urickson, M. Baldwin, and L. Snead, Journal of Nuclear Materials 417, 451 (2011).
- Klopp (1969) W. D. Klopp, J. Metals 21, 23 (1969).
- Geach and Hughes (1956) J. C. Geach and J. E. Hughes, Plansee Proc. (Pergamon Press, Oxford, 1956).
- Savitskii et al. (1965) E. M. Savitskii, M. A. Tylkina, and K. V. Povarova, Rhenium-Based Alloys (Izd. Nauka, Moskva, 1965).
- Edington et al. (1966) J. W. Edington, A. Gilbert, and M. J. Klein, NASA CR-81225, 1 (1966).
- Raffo (1969) P. Raffo, Journal of the Less Common Metals 17, 133 (1969).
- Luo et al. (1991) A. Luo, D. Jacobson, and K. Shin, International Journal of Refractory Metals and Hard Materials 10, 107 (1991).
- Gornostyrev et al. (1991) Y. N. Gornostyrev, M. I. Katsnelson, G. V. Peschanskikh, and A. V. Trefilov, physica status solidi (b) 164, 185 (1991).
- Trefilov et al. (1975) V. I. Trefilov, Y. V. Milman, and S. V. Firsov, Physics of Refractory Metal Strength (Izd. Naukova Dumka, Kiev, 1975).
- Kurdyumova et al. (1980) G. G. Kurdyumova, Y. V. Milman, and V. I. Trefilov, Electronic structure and Physico-Chemical Properties of Refractory Compounds and Alloys (Izd. Naukova Dumka, Kiev, 1980).
- Gao et al. (2008) M. C. Gao, mer N. Dogan, P. King, A. D. Rollett, and M. Widom, JOM 60, 61 (2008).
- Hiraoka et al. (2004) Y. Hiraoka, T. Ogusu, and N. Yoshizawa, Journal of Alloys and Compounds 381, 192 (2004).
- Klopp (1975) W. D. Klopp, Journal of the Less Common Metals 42, 261 (1975).
- Stephens and Witzke (1975) J. R. Stephens and W. R. Witzke, Journal of the Less Common Metals 41, 265 (1975).
- Medvedeva et al. (2005) N. I. Medvedeva, Y. N. Gornostyrev, and A. J. Freeman, Phys. Rev. Lett. 94, 136402 (2005).
- Medvedeva et al. (2007) N. I. Medvedeva, Y. N. Gornostyrev, and A. J. Freeman, Phys. Rev. B 76, 212104 (2007).
- Romaner et al. (2010) L. Romaner, C. Ambrosch-Draxl, and R. Pippan, Phys. Rev. Lett. 104, 195503 (2010).
- Li et al. (2012) H. Li, S. Wurster, C. Motz, L. Romaner, C. Ambrosch-Draxl, and R. Pippan, Acta Materialia 60, 748 (2012).
- Trinkle and Woodward (2005) D. R. Trinkle and C. Woodward, Science 310, 1665 (2005).
- Garfinkle (1966) M. Garfinkle, NASA TN D-3190, 1 (1966).
- Faulkner (1982) J. S. Faulkner, Progress in Materials Science 27, 1 (1982).
- Persson et al. (1999) K. Persson, M. Ekman, and G. Grimvall, Phys. Rev. B 60, 9999 (1999).
- Ekman et al. (2000) M. Ekman, K. Persson, and G. Grimvall, J. Nucl. Mater. 278, 273 (2000).
- Lassner and Schubert (1999) E. Lassner and W.-D. Schubert, Tungsten - Properties, Chemistry, Technology of the Element, Alloys, and Chemical Compounds (Springer-Verlag, 1999).
- Giannozzi et al. (2009) P. Giannozzi, S. Baroni, and N. B. …, J of Physics: Condensed Matter 21, 395502 (2009).
- Rappe et al. (1990) A. M. Rappe, K. M. Rabe, E. Kaxiras, and J. D. Joannopoulos, Phys. Rev. B 41, 1227 (1990).
- Perdew and Wang (1992) J. P. Perdew and Y. Wang, Phys. Rev. B 45, 13244 (1992).
- Ramer and Rappe (2000) N. J. Ramer and A. M. Rappe, Phys. Rev. B 62, R743 (2000).
- Mehl et al. (1990) M. J. Mehl, J. E. Osburn, D. A. Papaconstantopoulos, and B. M. Klein, Phys. Rev. B 41, 10311 (1990).
- Bigger et al. (1992) J. R. K. Bigger, D. A. McInnes, A. P. Sutton, M. C. Payne, I. Stich, R. D. King-Smith, D. M. Bird, and L. J. Clarke, Phys. Rev. Lett. 69, 2224 (1992).
- Segall et al. (2001a) D. Segall, T. Arias, A. Strachan, and W. Goddard, Journal of Computer-Aided Materials Design 8, 161 (2001a).
- Ismail-Beigi and Arias (2000) S. Ismail-Beigi and T. A. Arias, Phys. Rev. Lett. 84, 1499 (2000).
- Segall et al. (2003) D. E. Segall, A. Strachan, W. A. Goddard, S. Ismail-Beigi, and T. A. Arias, Phys. Rev. B 68, 014104 (2003).
- Frederiksena and Jacobsena (2003) S. L. Frederiksena and K. W. Jacobsena, Phil. Mag. 83, 365 (2003).
- Li et al. (2004) J. Li, C.-Z. Wang, J.-P. Chang, W. Cai, V. V. Bulatov, K.-M. Ho, and S. Yip, Phys. Rev. B 70, 104113 (2004).
- Ventelon and Willaime (2007) L. Ventelon and F. Willaime, Journal of Computer-Aided Materials Design 14, 85 (2007).
- Odbadrakh et al. (2011) K. Odbadrakh, A. Rusanu, G. M. Stocks, G. D. Samolyuk, M. Eisenbach, Y. Wang, and D. M. Nicholson, Journal of Applied Physics 109, 07E159 (2011).
- Moruzzi et al. (1977) V. L. Moruzzi, A. R. Williams, and J. F. Janak, Phys. Rev. B 15, 2854 (1977).
- Ayres et al. (1974) R. A. Ayres, G. W. Shanette, and D. F. Stein, J. Appl. Phys 46, 1528 (1974).
- Massalski et al. (1986) T. B. Massalski, J. L. Murray, L. H. Bennett, and H. Baker, Binary alloy phase diagrams (American Society for Metals, Metals Park, Ohio, 1986).
- Vitek (1974) V. Vitek, Cryst. Lattice Defects 5, 1 (1974).
- Xu and Moriarty (1996) W. Xu and J. A. Moriarty, Phys. Rev. B 54, 6941 (1996).
- Takeuchi (1979) S. Takeuchi, Philosophical Magazine A 39, 661 (1979).
- Itakura et al. (2012) M. Itakura, H. Kaburaki, and M. Yamaguchi, Acta Materialia 60, 3698 (2012).
- Xu and Moriarty (1998) W. Xu and J. A. Moriarty, Computational Materials Science 9, 348 (1998).
- Hirth and Lothe (1982) J. Hirth and J. Lothe, Theory of dislocations (Wiley-Interscience, New York, 1982).
- Gröger (2007) R. Gröger, Ph.D. thesis, University of Pennsylvania, Pennsylvania (2007), eprint arXiv:cond-mat/0707.3577v1.
- Segall et al. (2001b) D. E. Segall, T. Arias, A. Strachan, and W. Goddard III, Journal of Computer-Aided Materials Design 8, 161 (2001b).
- O’Dell et al. (2012) S. O’Dell, T. McKechnie, A. Shchetkovskiy, and A. Smirnov, in Workshop on Challenges to Developing W-Based Materials fo Fusion Application. (UC Santa Barbara, Santa Barbara., 2012).
- Nabarro (1947) F. R. N. Nabarro, Proceedings of the Physical Society 59, 256 (1947).
- Gröger and Vitek (2012) R. Gröger and V. Vitek (2012), eprint arXiv:cond-mat/111.5709v1.
- Jonsson et al. (1998) H. Jonsson, G. Mills, and K. W. Jacobsen, in Classical and Quantum Dynamics in Condensed Phase Simulations, edited by E. B. J. Berne, G. Ciccotti, and D. F. Coker (World Scientific, 1998), p. 385.
- Pod’yachev and Gavrilyuk (1975) V. N. Pod’yachev and M. I. Gavrilyuk, Metal Science and Heat Treatment 17, 299 (1975).
| TM | Approach | ||||||
|---|---|---|---|---|---|---|---|
| pure W | VCA | 3.1903 | 304 | 160 | 141 | 518 | 197 |
| SC | 3.1896 | 308 | 157 | 139 | 517 | 203 | |
| Zr | VCA | 3.2095 | 287 | 153 | 126 | 491 | 185 |
| SC | 3.2079 | 286 | 150 | 127 | 489 | 186 | |
| Ta | VCA | 3.1946 | 298 | 161 | 136 | 513 | 191 |
| SC | 3.1963 | 308 | 157 | 135 | 517 | 203 | |
| Fe | VCA | 3.1802 | 284 | 132 | 128 | 459 | 196 |
| SC | 3.1716 | 300 | 140 | 132 | 487 | 207 | |
| Co | VCA | 3.1788 | 284 | 125 | 115 | 450 | 200 |
| SC | 3.1725 | 297 | 129 | 131 | 469 | 211 | |
| Ni | VCA | 3.1830 | 279 | 116 | 126 | 434 | 202 |
| SC | 3.1743 | 295 | 126 | 131 | 463 | 211 | |
| Ru | VCA | 3.1772 | 308 | 142 | 142 | 498 | 213 |
| SC | 3.1842 | 301 | 135 | 137 | 481 | 211 | |
| Rh | VCA | 3.1710 | 309 | 135 | 141 | 490 | 219 |
| SC | 3.1862 | 298 | 124 | 133 | 462 | 215 | |
| Pd | VCA | 3.1639 | 310 | 129 | 139 | 482 | 224 |
| SC | 3.1901 | 293 | 116 | 131 | 448 | 216 | |
| Re | VCA | 3.1857 | 308 | 151 | 144 | 510 | 207 |
| SC | 3.1859 | 308 | 150 | 143 | 508 | 208 | |
| Os | VCA | 3.1809 | 312 | 143 | 146 | 503 | 216 |
| SC | 3.1848 | 307 | 136 | 144 | 489 | 216 | |
| Ir | VCA | 3.1736 | 316 | 147 | 148 | 513 | 218 |
| SC | 3.1865 | 304 | 125 | 140 | 470 | 221 | |
| Pt | VCA | 3.1687 | 317 | 132 | 148 | 494 | 229 |
| SC | 3.1917 | 299 | 113 | 135 | 449 | 223 |
| TM | |||||||
| experiment Ayres et al. (1974) | |||||||
| W | 0.0000 | 3.1659 | 314 | 164 | 163 | 533 | 205 |
| calculated, virtual crystal approximation | |||||||
| Re | 0.0000 | 3.1903 | 304 | 160 | 141 | 518 | 197 |
| 0.0300 | 3.1880 | 306 | 156 | 142 | 514 | 202 | |
| 0.0500 | 3.1866 | 307 | 153 | 143 | 512 | 205 | |
| 0.1000 | 3.1831 | 310 | 146 | 145 | 504 | 212 | |
| 0.3000 | 3.1689 | 322 | 130 | 156 | 495 | 235 | |
| 1.0000 | 3.1317 | 350 | -30 | 163 | 309 | 370 | |
| Zr | 0.0250 | 3.1972 | 297 | 161 | 136 | 511 | 190 |
| Ta | 0.0500 | 3.1936 | 299 | 162 | 137 | 515 | 191 |
| Fe | 0.0250 | 3.1849 | 296 | 148 | 136 | 494 | 198 |
| Ru | 0.0250 | 3.1846 | 306 | 153 | 141 | 510 | 204 |
| Rh | 0.0167 | 3.1846 | 306 | 153 | 141 | 509 | 204 |
| Os | 0.0250 | 3.1862 | 307 | 153 | 143 | 511 | 205 |
| Ir | 0.0167 | 3.1849 | 308 | 154 | 143 | 512 | 205 |
| W | 1.71 | 1.64 |
|---|---|---|
| W0.95Zr0.05 | 2.18 | 1.82 |
| W0.90Re0.10 | 1.37 | 1.15 |
| W0.95Fe0.05 | 1.09 | 1.05 |
| W0.98Fe0.02 | 1.65 | 1.40 |
| W0.97Ru0.03 | 1.60 | 1.35 |