Ontologies and tag-statistics
Abstract
Due to the increasing popularity of collaborative tagging systems, the research on tagged networks, hypergraphs, ontologies, folksonomies and other related concepts is becoming an important interdisciplinary topic with great actuality and relevance for practical applications. In most collaborative tagging systems the tagging by the users is completely “flat”, while in some cases they are allowed to define a shallow hierarchy for their own tags. However, usually no overall hierarchical organisation of the tags is given, and one of the interesting challenges of this area is to provide an algorithm generating the ontology of the tags from the available data. In contrast, there are also other type of tagged networks available for research, where the tags are already organised into a directed acyclic graph (DAG), encapsulating the “is a sub-category of” type of hierarchy between each other. In this paper we study how this DAG affects the statistical distribution of tags on the nodes marked by the tags in various real networks. The motivation of this research is that understanding the tagging based on a known hierarchy can help in revealing the hidden hierarchy of tags in collaborative tagging systems. We analyse the relation between the tag-frequency and the position of the tag in the DAG in two large sub-networks of the English Wikipedia and a protein-protein interaction network. We also study the tag co-occurrence statistics by introducing a 2d tag-distance distribution preserving both the difference in the levels and the absolute distance in the DAG for the co-occurring pairs of tags. Our most interesting finding is that the local relevance of tags in the DAG, (i.e., their rank or significance as characterised by, e.g., the length of the branches starting from them) is much more important than their global distance from the root. Furthermore, we also introduce a simple tagging model based on random walks on the DAG, capable of reproducing the main statistical features of tag co-occurrence. This model has high potential for further practical applications, e.g., it can provide a starting point for a benchmark system in ontology retrieval, or it may help pinpointing unusual correlations in the co-occurrence of tags.
, , ,
1 Introduction
The network approach has become an ubiquitous tool for analysing complex systems ranging from the interactions within cells through transportation systems, the Internet and other technological networks to economic networks, collaboration networks and the society [1, 2]. Over the last decade it has turned out that networks corresponding to realistic systems can be highly non-trivial, characterised by a low average distance combined with a high average clustering coefficient [3], anomalous degree distributions [4, 5] and an intricate modular structure [6, 7, 8]. A recently emerging sub-field of growing interest in this area is given by tagged networks, folksonomies and hypergraphs. In general, when studying the topology of the graph corresponding to a real system, the inclusion of node tags (also called as attributes, annotations, properties, categories, features) leads to a richer structure, opening up the possibility for a more comprehensive analysis. These tags can correspond to any information about the nodes and in most cases a single node can have several tags at the same time. The appearance of tags, e.g., in biological networks is very common [9, 10, 11, 12, 13, 14], where they usually refer to the biological function of the units represented by the nodes (proteins, genes, etc.). Node features are also fundamental ingredients in the so-called co-evolving network models, where the evolution of the network topology affects the node properties and vice versa [15, 16, 17, 18, 19, 20, 21, 22, 23, 24, 25]. These models are aimed at describing the dynamics of social networks, in which people with similar opinion are assumed to form ties more easily, and the opinion of connected people becomes more similar in time.
The entanglement between tags and the network structure is even more deep in collaborative tagging systems or folksonomies like CiteUlike, Delicious or Flickr [26, 27, 28], where the network is actually arising in a tagging process. The basic scenario in these systems is that users can tag certain type of objects (photos, web-pages, books, etc.) with freely chosen words. Although the limits of the access to objects and tags introduced by others varies from system to system, the arising set of objects with associated free tags is usually referred to as a folksonomy. Since each tagging action is forming a new user-tag-object triple, the natural representation of these systems is given by tri-partite graphs, or in a more general framework by hypergraphs [27, 29, 30], where the hyperedges can connect more than two nodes together. In some cases the users are also offered the possibility to indicate social contacts (mark each other as a friend), opening up a new dimension for the analysis of the interrelation between tagging and the social ties between users [31, 32].
Folksonomies provide an alternative approach to organise knowledge compared to ontologies [33, 34, 35]. An ontology usually corresponds to a set of narrower or broader categories, (capturing the view and concepts of a certain domain, e.g., protein functions), building up a hierarchy composed of “is a sub-category of” type relations. The natural representation of this hierarchy is given by a directed acyclic graph (DAG) between the categories. When tagging objects with categories taken from an ontology, we have the benefit that in principle all ancestors up to the root in the DAG can be inferred from a single tag on the object. In contrast, the tagging in a folksonomy is either completely “flat”, or at most the users can define a shallow hierarchy for their own tags. Nevertheless, a global hierarchical organisation of the tags is not given. One of the very interesting challenges related to folksonomies is to extract an ontology for the tags appearing in the system. Several promising approaches have been proposed, e.g., by aggregating the shallow hierarchies of the individual users [36, 37], using a probabilistic model [38], analysing the node centralities in the co-occurrence network between the tags [39], or integrating information from as many sources as possible [40]. Since a reliable hierarchy between the tags can seriously improve searching, an effective ontology building algorithm has high potential for practical applications.
Motivated by the ontology extraction problem described above, in this paper we focus on the relation between the structure of the ontology and the distribution of the tags in systems where the DAG describing the hierarchical relations is predefined. The basic idea is that understanding how the ontology effects the tagging can help in improving the methods for reverse engineering the hidden DAG from the tag distribution in folksonomies. Along this line we examine the statistics of tag occurrence in two large sub-graphs of the English Wikipedia and the protein interaction network of MIPS. We also analyse samples from Flickr, where the user defined shallow hierarchies are taken into account as individual DAGs. Furthermore, we introduce a simple model for reproducing the observed statistics based on a random walk on the DAG of tags. The paper is organised as follows: in Sect.2. we define the most important quantities we aim to study, while the details of the investigated networks are given in Sect.3. The obtained statistics are presented in Sect.4, continued by the description of the random walk model in Sect.5, with some concluding remarks closing the paper in Sect.6.
2 Definitions
2.1 DAG-levels
In the tagged networks we study the tags are organised into a hierarchy which can be represented by a DAG, where the directed links between two tags correspond to an “is a sub-category of” type of relation. The tags close to the root in the DAG are usually related to general properties, and as we follow the links towards the leafs, the categories become more and more specific. In some cases we can find categories in the DAG with more than one in-neighbours, meaning that the given sub-category is part of several categories which are not in direct ancestor-descendant relation with each other.
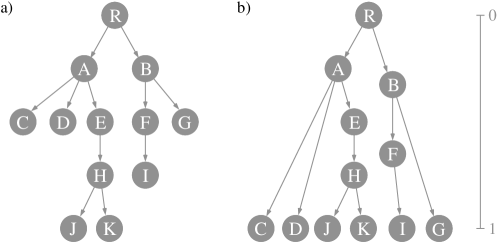
Starting from the root we can define levels in the DAG, with the root corresponding to level , the first tags under the root providing level , etc. For tags which can be reached via multiple paths from the root we assign the level corresponding to the longest path. (In some cases the level value of a tag is also referred to as the rank of tag). One of the simple statistical properties we are interested in is how does effect the frequency of the tags, or in other words, are the popular/rare tags close to the root in the DAG, or are they more likely to be close to the leafs? At this point we note that leafs can occur in principle at any level in the DAG, since the different branches have usually different maximal depths in a real system. In order to be able to judge the distance of a tag from the leafs as well, we introduce a rescaling of the level values illustrated in Fig.1.: The rescaled level value, at the root remains unchanged (), while for any leaf tags we require . For tags in-between the two extremes we assign an based on the length of the longest root-leaf branch it takes part in, and is given by the depth of the tag divided by the maximal depth of the branch.
2.2 Tag-frequency
The frequency of the tags in most real systems is heterogeneous, most popular tags occur rather often, whereas others are assigned only to a few objects. A natural choice for the definition of the frequency of a given tag is simply the number of objects it is assigned to. The probability to find attached to an object chosen uniformly at random is given by
| (1) |
where denotes the total number of objects. According to [41], the probability distribution of this quantity has a power-law like tail for both the Wikipedia and the MIPS network. In the present work (among other questions) we shall be interested in how is the tag-frequency effected by the level value of the tag.
We note that in systems where a DAG of the hierarchical relations between the tags is given, in principle we could infer all ancestors up to the root from an actually present tag on an object. This enables an alternative definition of the tag-frequency [41, 42], considering the aggregated number of occurrences for all descendants of and itself. However, since one of the main motivation of the present work is given by folksonomies (where the DAG is absent), we shall concentrate on the frequency given by simply the number of occurrences.
2.3 2d tag-distance distribution
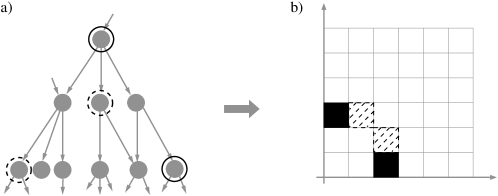
Another question of interest is how does the DAG affect the co-occurrence of different tags on the same object. The simplest idea for measuring the relatedness of a pair of co-occurring tags based on the DAG would be given by their distance. However, for some pairs the connecting path in the DAG is composed of links all going in the same direction, whereas in other cases we might need both up- and downward pointing links to reach from one tag to the other. In order to also include this aspect into the investigations, we define the 2d tag-distance distribution for the co-occurring pairs as illustrated in Fig.2. The positive quarter plane is divided into unit cells, with the cell at the origin corresponding to distance zero. A given pair of tags contributes to the distribution as follows: starting from one of them we first move upwards in the DAG until the lowest common ancestor is reached. In parallel we move the same number of cells vertically up in the 2d plane. Next, we move downwards in the DAG to reach the other tag, and in parallel, we move the same number cells horizontally to the right in the plane, and the number of “events” in the final cell is increased by one. The contribution from the path going back to the first tag from the second one is taken into account following the same rules: going upwards in the DAG corresponds to moving up in the 2d plane starting from the origin, whereas going down in the DAG corresponds to moving horizontally to the right in the plane. The resulting distribution of the tag-distances is symmetric to the diagonal by construction. The co-occurring pairs of tags which are in direct ancestor-descendant relation contribute to the first column of cells and the bottom row, whereas e.g., the diagonal cells correspond to pairs in which the two tags are equally deep in different branches from their lowest common ancestor, (see Fig.2 for illustration).
3 The studied systems
We studied the statistical properties of co-occurring tags with predefined DAG in two sub-networks of the English Wikipedia and the protein-protein interaction network of MIPS. Furthermore, we also investigated the tag co-occurrence in the presence of user defined shallow hierarchies in samples from Flickr.
The protein-protein interaction network of MIPS [43] consisted of proteins, connected by links, and the tags attached to the nodes corresponded to categories describing the biological processes the proteins take part in. The DAG between these categories was obtained from the Genome Ontology database [44].
In the Wikipedia [45] the pages are connected by hyperlinks (providing a very interesting network on its own [45, 46, 47, 48]), and at the bottom of each page, one can find a list of categories, which can be used as tags. We used the same data set as in [41, 42], representing the state of the system in 2008. Since each Wiki-category is a page in the Wikipedia as well, these pages were removed from the network to keep a clear distinction between objects and tags. Similarly to the biological processes in the MIPS network, the Wiki-categories can have sub-categories and are usually part of a larger Wiki-category. (Although the directed graph graph between the Wiki-categories contains a few loops, these can be removed quite easily to obtain a strict DAG [41]). Since the English-Wikipedia is quite a large network, we used smaller subsets obtained with a sampling method based on the tag-induced graphs [41]: after choosing a rather general category we keep the pages marked by this tag or any of its descendants. The chosen sub-graphs were induced by the categories “Japan”, (consisting of nodes, links and sub-categories), and “United Kingdom” (consisting of nodes, links and sub-categories).
One of the most popular collaborative tagging systems is given by Flickr, designed for tagging photos. Beside attaching tags, the users can also group their photos into so-called sets, and these sets can be also put into larger collections up to a limited range of levels. In contrast to the photos, the collections and sets are given short descriptions rather than tags. Anyhow, from the sets and collections of a given user we can generate a shallow hierarchy of tags. A natural choice is to link all tags appearing in a given set under one meta-tag corresponding to the set itself, then link this meta-tag under another meta-tag corresponding to the collection the given set is part of, etc. Of course, the tag-distance distribution of the tags appearing on the photos of a given user becomes trivial if we use the shallow hierarchy gained from these photos as the DAG: all co-occurring tags are siblings. However, the picture becomes non-trivial when we calculate the tag-distance distribution of the tags of a given user with help of the DAG gained from another user. In fact, for a given sample of users from Flickr, we can extract the shallow hierarchy of each user separately, then prepare the tag-distance distribution of for all other users using this DAG, and finally merge the results into one aggregated plot.
4 Applications
4.1 The structure of the DAG
We start our analysis with an interesting effect related to the structure of the DAGs describing the hierarchy of tags in the systems we investigate. In Fig.3. we plot the size of the levels (how many tags occur at a given level) as a function of the level depth. For convenience, the vertical axis for each plot is rescaled by the size of the largest level. According to Fig.3a, the size of the levels is small when we are either very close to the root, or very far from it, whereas it becomes larger in between. (Since the maximal depth is different in each system, the horizontal axis in this case has been rescaled from to , where denotes the length of the longest branch in the DAG). However, the shape and place of this maximum is unique for each system. (An alternative illustration of this effect is given in the Appendix, where in the top-panel of Fig.11. the differences between the un-scaled DAGs are more apparent). In contrast, when we switch to the rescaled level depth , the curves become roughly uniform with a more or less monotonously increasing shape, as shown in Fig.3b.
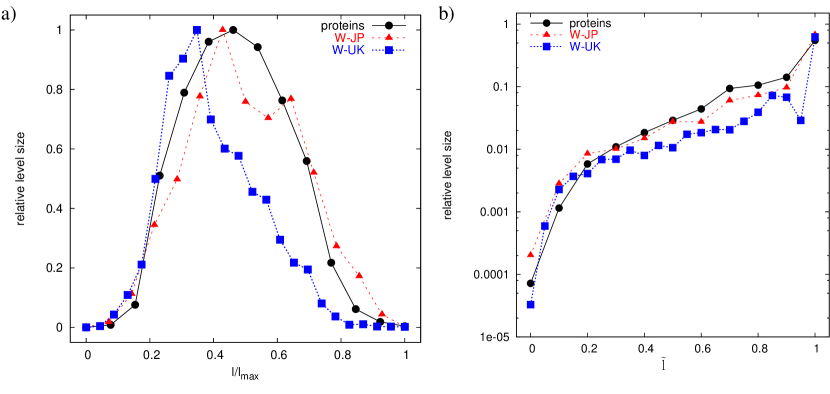
Thus, the rescaling of the level values has an interesting side effect on the shape of the DAG, bringing it closer a “triangular” form, similar to the shape of a regular hierarchical graph.
4.2 Tag-frequencies and level values
As our main interest is focused on the interplay between the tag-hierarchy and the statistical properties of tag-occurrences, in Fig.4. we show the average tag-frequency as a function of the level depth. When no rescaling is applied (apart from dividing by the maximal level depth ), the tag-frequency is almost completely independent of the level depth in a wide range of (Fig.4a). In contrast, when switching to the rescaled , a clear decreasing tendency can be observed, apart from the very low region (corresponding to levels close to the root). This non-trivial result indicates that the frequency of a tag is more sensitive to the depth of the branches starting from it compared to its distance from the root.
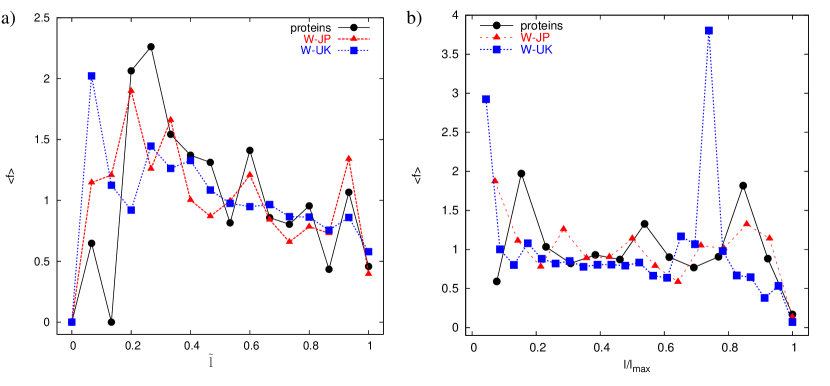
A plausible explanation of this effect is the following: we already pointed out that leafs can occur basically at any level in a large enough real world DAG. As we move upwards from the leafs, presumably the importance (relevance, rank, significance, standing, etc.) of the tags is increasing at least in the first few steps. However, since the leafs we started from were located at various levels, we arrive to the conclusion that tags with higher relevance can also occur at a wide range of levels in the DAG. Thus, the level value of a tag, measuring its global distance from the root is not very informative in this respect, and accordingly, it has no significant effect on the average frequency of the tags. In contrast, by switching to the rescaled level value , we also take into account the depth of the local branches starting from the given tag, which seem to be more relevant for evaluating the standing of a tag in the hierarchy, as the frequency of tags is decreasing with . (The more important tags have longer sub-branches starting from them, thus, on average have lower values).
4.3 Tag-distance and co-occurrence
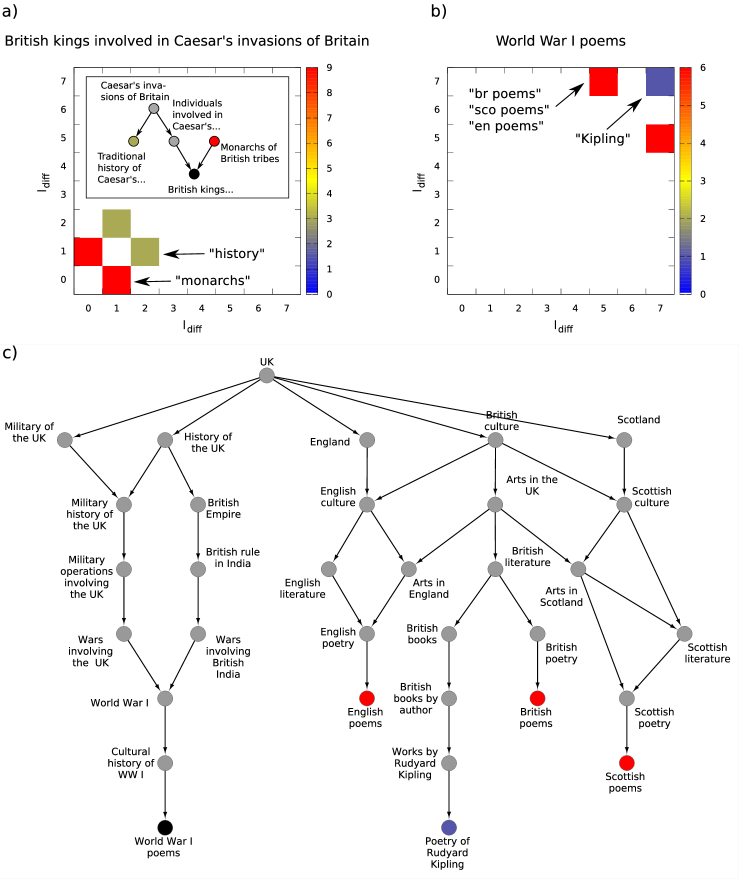
Next we move on to the examination of the 2d tag-distance distributions defined in Sect.2.3. For illustration, in Fig.5a we show the contribution from the tag “British kings involved in Caesar’s invasion of Britain” in case of the Wiki-UK network, where the number of occurrences together with other tags at a given distance are indicated by the colour of the corresponding cell. The sub-graph between the tags and the lowest common ancestors in the DAG is given in the inset. For comparison, in Fig.5b we show the contribution from “World War I poems” in a similar fashion. Here the routes through the lowest common ancestors between the co-occurring tag pairs are much longer, thus, they are displayed separately in Fig.5c. The tags co-occurring with “British kings …” are close in the DAG, and accordingly, their contribution in the 2d distribution is close to the origin. In contrast, the distances to the tags co-occurring with “World War I poems” are large, thus, their contribution falls in cells far from the origin.
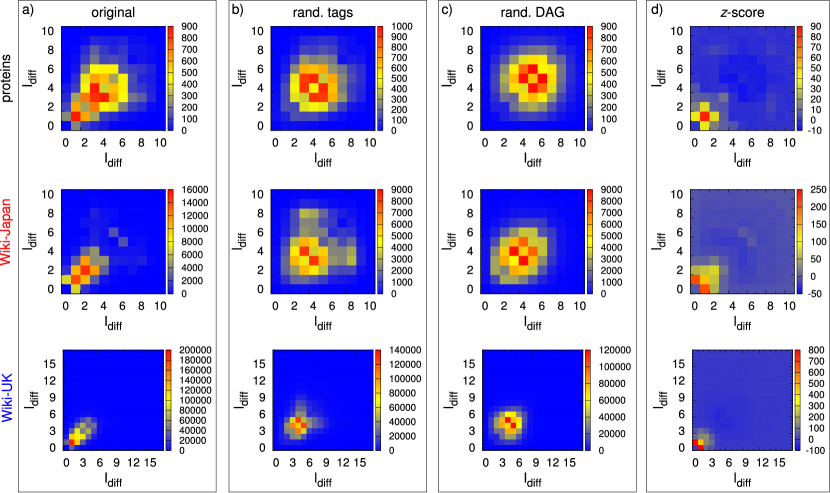
In Fig.6. we plot the complete 2d tag-distance distributions for the networks we investigated. According to the Fig.6a, the maximum of the plots is a few steps away from the origin, which might seem a bit surprising at first sight. In order to reveal the background of this effect we also measured the average tag-distance distribution for a random tag assignment analogous to the configuration model in the networks literature. Here the DAG is taken from the system under study, and we consider the ensemble of all possible associations of tags to the objects consistent with the observed number of occurrences for the tags and the observed number of tags on the individual objects. To simulate draws from this ensemble one can apply a randomisation procedure, in which a pair of tags is swapped between two randomly chosen objects in each step. This way both the number of tags on the objects and the tag-frequencies are preserved. The average tag-distance distributions for this random tag assignment are shown in Fig.6b, with the maximums even further away from the origin compared to the original data. An alternative possibility for randomisation is to replace the DAG of the original system by a random DAG of the the same size. For this we used the random DAG model introduced in [49] with fixed number of nodes and links. The results for random DAGs and the original distribution of the tags on the objects are displayed in Fig.6c, showing a picture somewhat similar to Fig.6b. Finally, to highlight the part of the original tag-distance distribution that cannot be accounted for random effects, in Fig.6d we show the -score of the individual cells, defined as the difference between the original distribution (Fig.6a) and the average for the random tag assignment (Fig.6b) scaled by the standard deviation of the random tag assignment. The maximums in this plots have clearly moved close to the origin, showing that the co-occurrence of tags only a few steps away in the DAG is far more probable than at random in the systems we investigated.
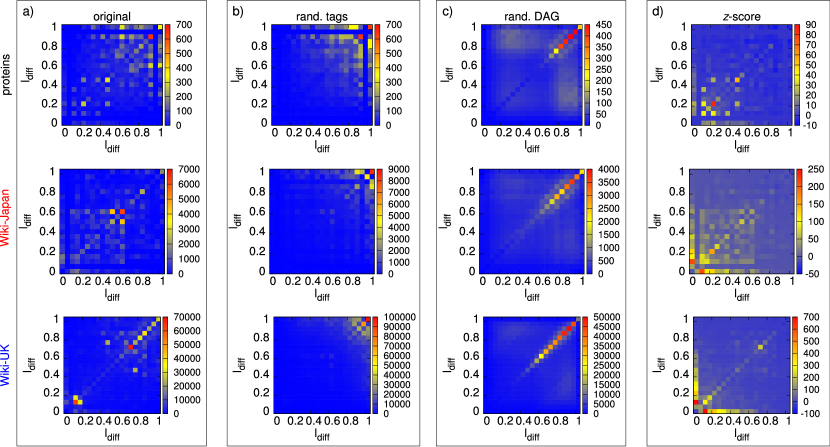
The three -score plots in Fig.6d also reveal an interesting difference between the systems: in case of the protein interaction network the maximum is in the diagonal, while for the two Wiki-networks it is in the first row (or first column). This means that for the protein interaction network the most enhanced co-occurring tags are like “brothers”, i.e., they are at the same depth from their lowest common ancestor on different branches. In contrast, the maximum places for the Wiki-networks correspond to tag-pairs in direct ancestor-descendant relation with each other. This effect is somewhat even more apparent when we replot the tag-distance distributions using the rescaled level value for measuring the distance between the tags, as shown in Fig.7. (Since can take up real values in , we introduced bins of size 0.05 when preparing the tag-distance distributions). Similarly to Fig.6., the maximums are far from the origin for both the original data sets (panel a) and their random counterparts (panels b-c). However, in case of the -score (panel d), the maximum is shifted rather close to the origin along the diagonal for the protein interaction network, while it is concentrated in the first row (or column) for the two Wiki-networks. A further nice feature of using the rescaled levels is that the tag-distance distribution of the random tag assignment has high values around (1,1), in contrast to the traditional level-based distribution which has high values in a nontrivial, case-specific region (see Fig.6b).
4.4 Results for Flickr
We also prepared the 2d tag-distance distribution using the user defined shallow hierarchies for a sample from Flickr. Since the maximal level depth in this case is only , the distinction between close by and far away tags becomes a bit artificial, (e.g., for direct descendants the largest possible distance is 3). According to the results shown in Fig.8., the maximum of the 2d tag-distance distribution is close to the origin for both the original data (Fig.8a) and its randomised counterparts (Figs.8b-c). From the -score (Fig.8d) we can see that the cells having the most significant enhancement in the number of tag-pairs compared to the random tag assignment correspond to direct descendants within distance 1 and 2.
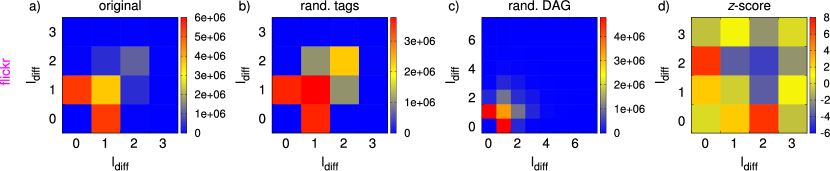
Although this behaviour is consistent with the results shown previously for the three tagged networks, the enhancement in the number of close by tag-pairs is far less striking. An interesting question, (which is out of the scope of the present work), related to the above is the following: How would the tag-distance distribution behave in the Flickr data set if the set of user-defined shallow hierarchies are replaced by a unique overall DAG obtained from an ontology extraction algorithm?
4.5 Local standing vs. global rank in the tag-distance distribution
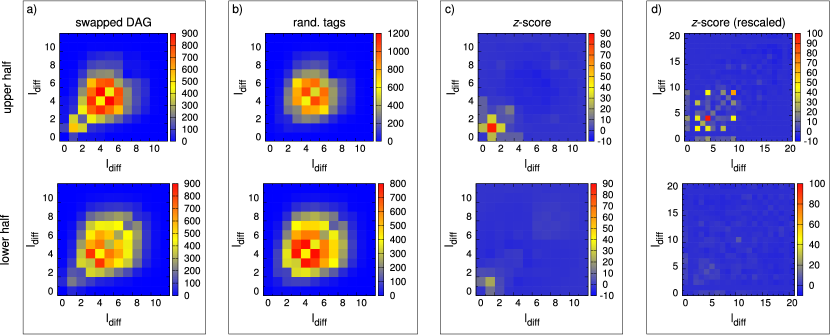
In Sect.4.2. we have seen that the length of the local branches starting from a given tag in the DAG have much larger effect on its frequency compared to its global distance from the root. An interesting question related to this is whether we can observe any similar effect in the behaviour of the 2d tag-distance distribution as well. Since this distribution depends on the relative distance between the co-occurring tags, from its original form we cannot deduce any information about the absolute level value of the occurring tags. However, applying a randomisation restricted to a given part (e.g., a given set of levels) in the DAG and tracking the induced changes in the 2d tag-distance distribution can help resolving the influence of the given region in the DAG on the tag co-occurrence: If the chosen part is crucial, then the behaviour of 2d tag-distance distribution obtained after the randomisation should be very different from the original. However, if the chosen part of the DAG has only little influence on the tag co-occurrence, then the restricted randomisation of the given part should not make a significant difference.
Along this line we divided the DAG of the systems we investigated into an “upper half” (corresponding to levels close to the root), and a “lower half” (composed of bottom levels far from the root). Although the number of tags in the two parts were the same, the induced changes in the 2d tag-distance distribution due to the randomisation of a single part alone were strikingly different, in agreement with the previously observed enhancement of the importance of the “local position” compared to the“global position” in the DAG from the point of view of tag frequencies. In Fig.9. we show the results for randomising the “upper half” (top row) and “lower half” (bottom row) of the DAG separately in the protein interaction network. (During the randomisation process at each step a pair of tags from the restricted set was randomly swapped in the DAG). In Fig.9a we show the 2d tag-distance distribution obtained after the restricted randomisation, for comparison Fig.9b displays the results for random tag assignment (using the partly randomised DAG). The corresponding -scores are given in Fig.9c-d, for both for the original- and the rescaled level values. In case of randomising the “upper half” the -scores are quite similar to the -scores shown in Figs.6-7, (although some small details look slightly different). In contrast, the -scores for randomising the “lower half” show drastic deviations from the original -scores: we can observe only a week reminiscent of the maximum close to the origin, and the landscape becomes almost completely flat. This enhanced sensitivity of the 2d tag-distance distribution to the changes in the “lower half” of the DAG compared to changes in the “upper half” is in agreement with the enhanced sensitivity of the tag-frequencies to the local position of the tags in the hierarchy compared to the global distance from the root: When randomising the “upper half”, the local position for at least the tags in the “lower half” is preserved, whereas the global routes to any tag are messed up. In contrast, when randomising the “lower half”, while preserving the global structure, we mess up the local position for the majority of the tags, (as “upper half” tags are also likely to have branches reaching into the “lower half”). We observed similar behaviour in case of randomising partly the DAG of either the Wiki-Japan or the Wiki-UK network as well.
5 Random walk model
According to the results of Sect.4. the DAG between the tags has indeed an effect on the co-occurrence of tags. In this section we demonstrate that a rather simple model can reproduce the main statistical features observed for the real systems. Since the co-occurring tags were more close to each other in the DAG than at random, the model has to provide a mechanism for choosing pairs from the DAG with an enhanced probability for close by tags. A natural idea is to pick the first tag at random, then start a random walk on the DAG from the chosen tag, and after a few steps pick the target reached. (In some respect this approach is a sort of “dual-model” of the random walk model introduced in [50] on the network of word associations, which was used for inferring similarity relations between words).
If we take the DAG as predefined (e.g., the DAG of the system we would like to model), then the two “parameters” of the model are given by the frequency distribution of the tags and the length distribution of the random walks. For the tag-frequencies the first natural idea is to use the frequency distribution measured in the real data. However, we also worked with uniform tag-frequencies set to the average value measured in the real data. In case of the random walk length distribution we tried out the gamma-distribution, the uniform distribution, the lognormal distribution, and the Poisson-distribution. For all choices the average length of the walks was set to a value ranging between 3 and 10. According to the results, the tag-distance distribution is very robust against the changes in any parameters.
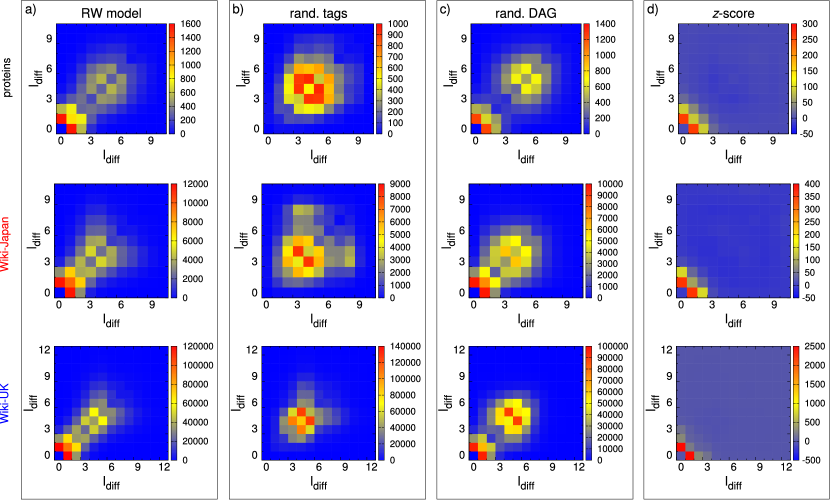
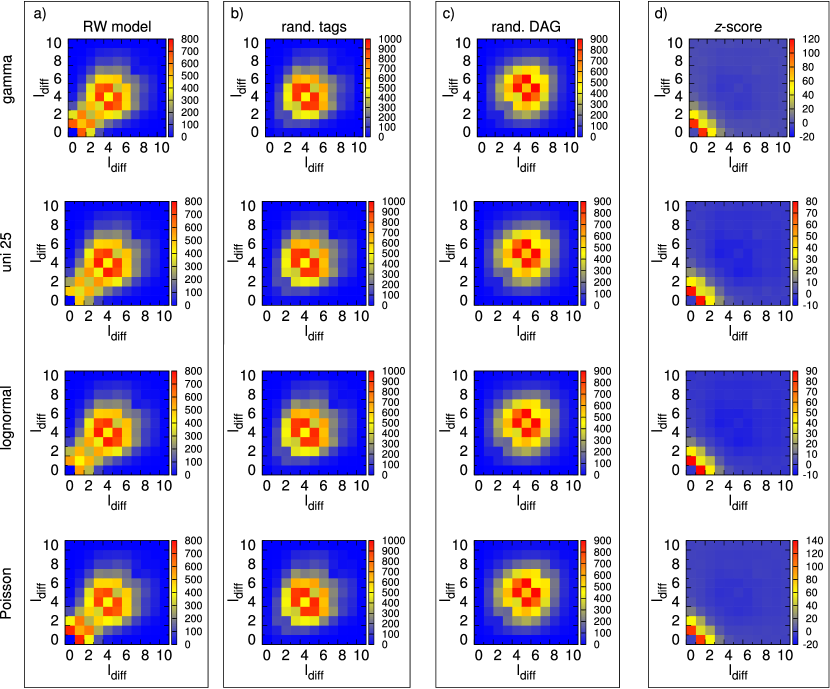
In Fig.10a we show typical tag-distance distribution results for the random walk model. The DAGs used in these simulations (indicated on the left of each row) were taken from the tagged networks we studied in Sect.4.3, and the frequency of the tags as well as the number of tags on the objects were set to the average values measured in the corresponding real system. The length distribution for the random walks was a uniform distribution in the [3-10] interval. (In the Appendix we show very similar results for different random walk length distributions). Similarly to the case of the real systems we studied, in Fig.10b we also show the results for a suitably chosen null-model which in this case corresponds to choosing the tag-pairs at random, irrespectively of the DAG. In Fig.10c we show the results for random walks on random DAGs generated using the model introduced in [49]. For highlighting the part which is only present due to the correlations induced by the random walk, in Fig.10d we also display the -scores (corresponding to the difference between Fig.10a and Fig.10b in the units of the standard deviation of Fig.10b). Similarly to the behaviour observed in the real systems, the maximum in the -score is shifted close to the origin in all cases.
In summary, according to the simulations, our random walk model qualitatively reproduces the main properties of the tag-distance distribution for the co-occurring tags observed in real systems. Although the model is rather simple, it has high potential for further applications. On the one hand, with the further development of ontology extraction algorithms sooner or later the need for a controllable benchmark system will arise. The rough outline of this benchmark is that stochastic collections of tagged “objects” (sets of co-occurring tags) are generated based on given input DAG, and using these collections as input we can test how well does a given ontology extraction algorithm recover the DAG. Our random walk model can provide a starting point for generating random collections of co-occurring tags with some sort of “memory” of the underlying DAG of hierarchy between the tags.
On the other hand, the tag-distance distribution generated by the random walk model can also help pointing out non-trivial effects in the tag-distance distribution of the original data where the DAG was taken from. For example, when using the DAG taken from the Wiki networks, the behaviour of the tag-distance distribution in the random walk model is very similar compared to the original one. However, when repeating this experiment with the protein interaction network, the two tag-distance distributions are only roughly similar: although the maximum in the -scores is shifted close to the origin in both cases, for the original data it remains in a diagonal position (see Figs.6-7), while it becomes off-diagonal for the random walk model (see Fig.10). Thus, the co-occurrence patterns of the protein interaction network have features which cannot be explained by a simple random walk on the DAG.
6 Conclusions
Motivated by the ontology extraction problem in collaborative tagging systems and folksonomies, we studied the statistical properties of tag occurrence in tagged networks where the DAG of hierarchy between the tags is predefined. In order to be able to give support for the further development of ontology extraction algorithms, this research was focused on the interaction between the DAG and the tag-statistics. Our most interesting result is that the local standing (rank, significance, etc.) of the tags in the DAG has a much more relevant effect on the tag-statistics compared to the global distance from the root. This is supported on the one hand by the change in the behaviour of the tag-frequency as a function of the level value when switching to the rescaled levels , on the other hand by the different sensitivity of the 2d tag-distance distribution for co-occurring tags to randomising the “upper half” or the “lower half” of the DAG.
According to our studies on a protein interaction network and two sub-networks from the English Wikipedia, the average frequency of the tags is more or less independent of the level value (distance from the root) in the hierarchy of the tags. In contrast, if we switch to a rescaled level value taking into account also the length of the sub-branches starting from the given tag in the DAG, we see a decreasing tendency in the tag-frequency with growing in a wide range of . A plausible explanation for this interesting effect is that the distance from the root is not a good indicator of the importance (significance, rank, etc.), e.g., in the DAGs we studied leafs (corresponding probably to the most specific tags) occurred at a wide range of levels. However, the lengths of the branches starting from a given tag provide an alternative candidate for evaluating its importance, and in contrast to the distance from the root, this measure is of local nature. The above result suggests that taking into account this local information as well when evaluating the rank of a tag yields a quantity which is much more entangled with the tag-frequency compared to the traditional level value.
We studied the statistical properties of co-occurring tag pairs by introducing a 2d tag-distance distribution for the relative positions in the DAG. We compared this distribution for the three investigated systems with the distribution obtained for a random tag assignment analogous to the configuration model in the complex network literature. According to the -scores, close by pairs of tags co-occur in these systems far more often then expected at random. Furthermore, these 2d plots also reveal an interesting difference between the protein interaction network and the Wiki-networks: in the first system the co-occurring tag pairs are much less likely to be direct descendants of each other compared to the other two networks, instead they are often to like “cousins”, “brothers” or “nephews”. We also analysed the 2d tag-distance distribution obtained for a sample from Flickr using the shallow hierarchies defined by the users. The results were consistent with the behaviour seen for the tagged networks with predefined DAG, however the increase in the number of the close by tag pairs compared to the random null model was far less striking.
In order to examine the difference between importance of the local- and global position of the tags in the hierarchy from a further perspective, we applied restrictive randomisation to the DAG by dividing it into an “upper-half” and a “lower-part” of equal size. The induced changes in the 2d tag-distance distribution showed significant difference: the effect of randomising the “upper-half” is marginal, whereas the structure of the -score undergoes a drastic transformation when randomising the “lower-half”. Since randomising the “upper-half” modifies mainly the global structure, while randomising the “lower-half” reshuffles mainly the local structure, this effect is in complete agreement with the previously observed imbalance between the importance of the local- and global standing of tags (in favour of the local one) from the point of view of tag-frequencies.
Finally, we introduced a simple model based on random walks on the DAG for describing the enhancement of close by tag-pairs in the tag-distance distribution. According to our simulations, this approach can reproduce the shift of the maximum towards the origin in the -score in a robust way. Although simple in nature, this model has relevant potential for further applications, e.g., it can provide a starting point in constructing benchmark systems for ontology extraction algorithms, and can also help in pinpointing non-trivial effects in the tag-distance distribution of real systems.
Appendix
A1: The structure of the DAGs
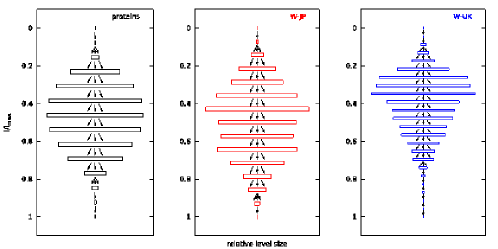
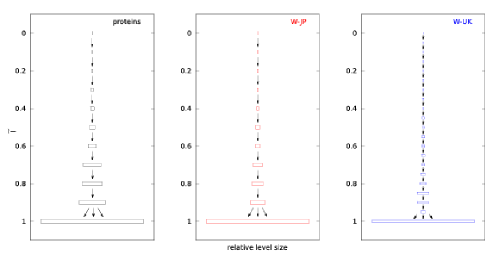
The DAG capturing the hierarchical relations between the tags plays a crucial role in our analysis, and in the systems we investigate the structure of the DAG is not trivial, i.e., its shape is far from e.g., the shape of a regular hierarchical graph in which the level sizes are increasing as a power-law with the level depth. In Fig.11a we show a schematic illustration of the level sizes for the networks under study, where the width of the bars indicates the number of tags on a given level, while the vertical position of the bar corresponds to . This representation shows significant differences between the three DAGs. However, when switching to the rescaled level value , according to Fig.11b, the shape of the DAGs become more or less uniformly “triangular”. (Since can take up real values instead of integers, we used binning similarly to the case of Fig.7. in the main text).
A2: Robustness of the random walk model
As mentioned in the main text, the random walk model turned out to be quite robust against changes in the details like the frequency distribution of the tags, the distribution of the number of tags on the objects, or the length distribution of the random walk on the DAG. For illustration, in Fig.12. we show results for replacing the uniform distribution of the random walk lengths in Fig.10. in the main text by gamma-distribution (1st row), uniform distribution with different ranges (2nd row), lognormal-distribution (3drow), and Poisson-distribution (4th row). Apparently, the qualitative behaviour of the 2d tag-distance distribution is the same as before: the maximum is shifted close to the origin in the -score.
Acknowledgment
This work was supported by the European Union and co-financed by the European Social Fund (grant agreement no. TAMOP 4.2.1/B-09/1/KMR-2010-0003).
References
References
- [1] R. Albert and A.-L. Barabási. Statistical mechanics of complex networks. Rev. Mod. Phys., 74:47–97, 2002.
- [2] J. F. F. Mendes and S. N. Dorogovtsev. Evolution of Networks: From Biological Nets to the Internet and WWW. Oxford University Press, Oxford, 2003.
- [3] D. J. Watts and S. H. Strogatz. Collective dynamics of ’small-world’ networks. Nature, 393:440–442, 1998.
- [4] M. Faloutsos, P. Faloutsos, and C. Faloutsos. On power-law relationships of the internet topology. Comput. Commun. Rev., 29:251–262, 1999.
- [5] A.-L. Barabási and R. Albert. Emergence of scaling in random networks. Science, 286:509–512, 1999.
- [6] M. Girvan and M. E. J. Newman. Community structure in social and biological networks. Proc. Natl. Acad. Sci. USA, 99:7821–7826, 2002.
- [7] G. Palla, I. Derényi, I. Farkas, and T. Vicsek. Uncovering the overlapping community structure of complex networks in nature and society. Nature, 435:814–818, 2005.
- [8] S. Fortunato. Community detection in graphs. Physics Reports, 486:75–174, 2010.
- [9] O. Mason and M. Verwoerd. Graph theory and networks in Biology. IET Systems Biology, 1:89–119, 2007.
- [10] X. Zhu, M. Gerstein, and M. Snyder. Getting connected: analysis and principles of biological networks. Genes & Development, 21:1010–1024, 2007.
- [11] T. Aittokallio and B. Schwikowski. Graph-based methods for analysing networks in cell biology. Briefings in Bioinformatics, 7:243–255, 2006.
- [12] G. Finocchiaro, F. M. Mancuso, D. Cittaro, and H. Muller. Graph-based identification of cancer signaling pathways from published gene expression signatures using PubLiME. Nucl. Ac. Res., 35:2343–2355, 2007.
- [13] P. F. Jonsson and P. A. Bates. Global topological features of cancer proteins in the human interactome. Bioinformatics, 22:2291–2297, 2006.
- [14] P. F. Jonsson, T. Cavanna, D. Zicha, and P. A. Bates. Cluster analysis of networks generated through homology: automatic identification of important protein communities involved in cancer metastasis. BMC Bioinformatics, 7:2, 2006.
- [15] M. G. Zimmermann, V. M. Eguíluz, and M. S. Miguel. Coevolution of dynamical stats and interactions in dynamic networks. Phys. Rev. E, 69:065102(R), 2004.
- [16] V. M. Eguíluz, M. G. Zimmermann, and C. J. Cela-Conde. Cooperation and the emergence of role differentiation in the dynamics of social networks. Am. J. Sociol., 110:977–1008, 2005.
- [17] G. Kossinets and D. J. Watts. Empirical analysis of an evolving social network. Science, 311:88–90, 2006.
- [18] G. C. M. A. Ehrhardt and M. Marsili. Phenomenological models of socioeconomic network dynamics. Phys. Rev. E, 74:036106, 2006.
- [19] P. Holme and M. E. J. Newman. Nonequilibrium phase transition in the coevolution of networks and opinions. Phys. Rev. E, 74:056108, 2006.
- [20] S. Gil and D. H. Zanette. Coevolution of agents and networks: Opinion sperading and community disconnection. Phys. Lett. A, 356:89–94, 2006.
- [21] F. Vazquez, J. C. González-Avella, V. M. Eguíluz, and M. S. Miguel. Time-scale competition leading to fragmentation and recombination transitions in the coevolution of network and states. Phys. Rev. E, 76:046120, 2007.
- [22] F. Vazquez, V. M. Eguíluz, and M. S. Miguel. Generic absorbing transition in coevolution dynamics. Phys. Rev. Lett., 100:108702, 2008.
- [23] B. Kozma and A. Barrat. Consensus formation on adaptive networks. Phys. Rev. E, 77:016102, 2008.
- [24] I. J. Benczik, S. Z. Benczik, B. Schmittmann, and R. K. P. Zia. Lack of consensus in social systems. Europhys. Lett., 82:48006, 2008.
- [25] C. Castellano, S. Fortunato, and V. Loreto. Statistical physics of social dynamics. Rev. Mod. Phys., 81:591–646, 2009.
- [26] C. Cattuto, V. Loreto, and L. Pietronero. Semiotic dynamics and collaborative tagging. Proc. Natl. Acad. Sci. USA, 104:1461–1464, 2007.
- [27] R. Lambiotte and M. Ausloos. Collaborative tagging as a tripartite network. Lect. Notes in Computer Sci., 3993:1114–1117, 2006.
- [28] C. Cattuto, A. Barrat, A. Baldassarri, G. Schehr, and V. Loreto. Collective dynamics of social annotation. Proc. Natl. Acad. Sci. USA, 106:10511–10515, 2009.
- [29] G. Ghosal, V. Zlatić, G. Caldarelli, and M. E. J. Newman. Random hypergraphs and their applications. Phys. Rev. E, 79:066118, 2009.
- [30] V. Zlatić, G. Ghosal, and G. Caldarelli. Hypergraph topological quantities for tagged social networks. Phys. Rev. E, 80:036118, 2009.
- [31] R. Schifanella, A. Barrat, C. Cattuto, B. Markines, and F. Menczer. Folks in folksonomies: social link prediction from shared metadata. In WSDM ’10 Proceedings of the third ACM international conference on Web search and data mining, pages 271–280, 2010.
- [32] L. M. Aiello, A. Barrat, C. Cattuto, G. Ruffo, and R. Schifanella. Link creation and profile alignment in the aNobii social network. In Proceedings of the Second IEEE International Conference on Social Computing SocialCom 2010, pages 249–256, 2010.
- [33] P. Mika. Ontologies are us: A unified model of social networks and semantics. In In International Semantic Web Conference, Vol. 3729, pages 522–536, 2005.
- [34] P. Spyns, A. D. Moor, J. Vandenbussche, and R. Meersman. From Folksologies to Ontologies: How the Twain Meet. In In Proceedings of OTM Conferences (1), pages 738–755, 2006.
- [35] J. Voss. Tagging, folksonomy & Co - renaissance of manual indexing? arXiv:cs/0701072v2, 2007.
- [36] A. Plangprasopchok and K. Lerman. Constructing folksonomies from user-specified relations on flickr. In Proceedings of the World Wide Web conference, 2009.
- [37] A. Plangprasopchok, K. Lerman, and L. Getoor. A probabilistic approach for learning folksonomies from structured data. In Fourth ACM International Conference on Web Search and Data Mining (WSDM), 2011.
- [38] P. Schmitz. Inducing ontology from flickr tags. In Proceedings of the 15th International Conference on World Wide Web (WWW), 2006.
- [39] P. Heymann and H. Garcia-Molina. Collaborative creation of communal hierarchical taxonomies in social tagging systems. Technical report, Stanford InfoLab, 2006.
- [40] C. Van Damme, M. Hepp, and K. Siorpaes. Folksontology: An integrated approach for turning folksonomies into ontologies. Social Networks, 2:57–70, 2007.
- [41] G. Palla, I. J. Farkas, P. Pollner, I. Der¡E9¿nyi, and T. Vicsek. Fundamental statistical features and self-similar properties of tagged networks. New Journal of Physics, 10:123026, 2008.
- [42] P. Pollner, G. Palla, and T. Vicsek. Clustering of tag-induced subgraphs in complex networks. Physica A, 389:5887–5894, 2010.
- [43] H. W. Mewes, S. Dietmann, D. Frishman, R. Gregory, G. Mann haupt, K. Mayer, M. Muensterkötter, A. Ruepp, M. Spannagl, V. Stuempflen, and T. Rattei. Mips: Analysis and annotation of genome information in 2007. Nucl. Acids Res., 36:D196–D201, 2008.
- [44] The Gene Ontology Consortium. Gene ontology: tool for the unification of biology. Nature Genetics, 25:25–29, 2000.
- [45] http://en.wikipedia.org.
- [46] V. Zlatić, M. Božičević, H. Štefančić, and M. Domazet. Wikipedias: Collaborative web-based encyclopedias as complex networks. Phys. Rev. E, 74:016115, 2006.
- [47] A. Capocci, V. D. P. Servedio, F. Colaiori, L. S. Buriol, D. Donato, S. Leonardi, and G. Caldarelli. Preferential attachment in the growth of social networks: The internet encyclopedia wikipedia. Phys. Rev. E, 74:036116, 2006.
- [48] A. Capocci, F. Rao, and G. Caldarelli. Taxonomy and clustering in collaborative systems: The case of the on-line encyclopedia wikipedia. Europhys. Lett., 81:28006, 2008.
- [49] B. Karrer and M. E. J. Newman. Random acyclic networks. Phys. Rev. Lett., 102:128701, 2009.
- [50] J. Borge-Holthoefer and A. Arenas. Categorizing words through semantic memory navigation. European Physical Journal B, 74:265, 2010.