On the Mass Distribution and Birth Masses of Neutron Stars
Abstract
We investigate the distribution of neutron star masses in different populations of binaries, employing Bayesian statistical techniques. In particular, we explore the differences in neutron star masses between sources that have experienced distinct evolutionary paths and accretion episodes. We find that the distribution of neutron star masses in non-recycled eclipsing high-mass binaries as well as of slow pulsars, which are all believed to be near their birth masses, has a mean of and a dispersion of . These values are consistent with expectations for neutron star formation in core-collapse supernovae. On the other hand, double neutron stars, which are also believed to be near their birth masses, have a much narrower mass distribution, peaking at but with a dispersion of only . Such a small dispersion cannot easily be understood and perhaps points to a particular and rare formation channel. The mass distribution of neutron stars that have been recycled has a mean of and a dispersion of , consistent with the expectation that they have experienced extended mass accretion episodes. The fact that only a very small fraction of recycled neutron stars in the inferred distribution have masses that exceed suggests that only a few of these neutron stars cross the mass threshold to form low mass black holes.
Subject headings:
stars: neutron — pulsars: general — binaries: X-ray1. Introduction
The mass distribution of neutron stars contains information about the supernova explosion mechanisms, the equation of state of neutron star matter, and the accretion history of each neutron star since its formation. Certain populations of neutron stars such as those in double neutron stars and in binaries with high mass companions are thought to have experienced little-to-no accretion over their lifetimes. In contrast, neutron stars in low-mass X-ray binaries and fast pulsars, which are typically in close orbits around white dwarfs, undergo extended accretion periods that are likely to move the neutron star mass away from its birth value.
The neutron star mass measurements that were available a decade ago allowed a statistical inference of the mass distribution of double neutron stars (Finn 1994) or of pulsars in binaries, without distinguishing between subgroups (Thorsett & Chakrabarty 1999). Finn (1994) found that neutron star masses fall predominantly in the range. Thorsett & Chakrabarty (1999) found that the mass distribution for the combined population is consistent with a narrow Gaussian at . More recently, Schwab, Podsiadlowski, & Rappaport (2010) argued that the distribution of neutron star masses in double neutron stars is actually bimodal, with one peak centered at and the other at , which they attributed to different supernova explosion mechanisms. Kiziltan, Kottas, & Thorsett (2010), Valentim, Rangel, & Horvath (2011), and Zhang et al. (2011), on the other hand, inferred the mass distribution of different neutron star subgroups based either on the pulsar spin period or the binary companion, both of which were taken to be indicative of the accretion history of the system. All groups found that the neutron stars that are thought to have undergone significant accretion are on average heavier than those that have not.
One result that is common to all of these studies is the narrowness of the mass distribution of double neutron stars, , which has been taken as indicative of the birth mass distribution of all neutron stars. The mean of the distribution is at , which is significantly larger than the mass of the pre-supernova iron core for neutron stars that form through the core-collapse mechanism. The Chandrasekhar mass for cores with electron fractions in the range is . Electrostatic interactions and entropy of the core introduce additional corrections to the pre-collapse mass (see Timmes et al. 1996 for a discussion). Taking into account the binding energy of the neutron star results in gravitational masses for the collapsed cores in the range . Even the largest of these masses is well below the mean of the observed distribution of double neutron stars. Fallback of stellar matter onto the collapsing core during the supernova explosion allows for the remnant to increase. However, this is also expected to increase the dispersion of masses by a comparable amount (see Zhang et al. 2008), which is inconsistent with the narrowness of the inferred mass distribution of double neutron star masses.
Considering a bimodal underlying distribution in the population of double neutron stars, as in Schwab et al. (2010), makes the width of each distribution even narrower: and for the two components. For the lower mass component centered around , such a narrow distribution may be reasonably obtained through an electron capture supernova, the onset of which occurs at a particular mass threshold of an ONeMg white dwarf (Podsiadlowski et al. 2005). However, the second component, which is centered at cannot be explained as a result of the electron capture supernovae and poses the same challenge in its narrowness when explained via the core-collapse mechanism.
In order to model the distribution of neutron star masses both at their births and throughout their lives, one important question to address is whether double neutron stars are a representative sample for neutron stars at their birth masses. In this paper, we address this question by identifying a different population of neutron stars at or near their birth masses and compare the inferred mass distribution with that of double neutron stars. Furthermore, to pinpoint the effects of subsequent accretion, we compare the inferred mass distribution of these neutron stars to that of neutron stars which have undergone or are currently undergoing extended mass accretion.
Making use of all of the currently available neutron star mass measurements, we divide the sample into various subgroups based on the nature of the companion as well as the neutron star spin. We employ a uniform Bayesian statistical approach that utilizes the entire posterior likelihood of each mass measurement to infer the parameters of the underlying mass distribution without assuming Gaussian errors.
In Section 2, we present the neutron star mass measurements, grouping the data according to the measurement technique and the type of the binary. In Section 3, we estimate the parameters of the underlying mass distribution for each subgroup and assess the sensitivity of our results on the particular measurements and priors. In section 4, we summarize our findings and discuss their implications for the different physical mechanisms that determine the neutron star mass distribution.
2. Mass Measurements
Mass measurements of neutron stars are carried out in several different ways. When neutron stars appear as pulsars, high precision pulse timing observations lead to a measurement of several orbital parameters. The pulsar’s orbit can be described in classical gravity by the five Keplerian parameters: the binary period , the eccentricity , the projection of the pulsar’s semi-major axis on the observer’s line of sight , the time of periastron , and the longitude of periastron , where is the angle between the orbital angular momentum vector and the line of sight. The mass function, which is related to the mass of the pulsar , its companion , and the inclination angle ,
| (1) |
is, therefore, directly obtained from these orbital parameters, where is the total mass of the system.
Proceeding from a mass function to a measurement of the mass of the pulsar and of its companion requires additional information. This information can come from measurement of relativistic effects in the binary orbits or from independent observations of the companion stars. We discuss below the various techniques, the measurements they resulted in to date, and the associated uncertainties.
The majority of the precise neutron star mass measurements come from radio pulsar timing techniques and rely on the measurement of relativistic effects in the binary orbits.
The general relativistic effects can be described by five additional “post-Keplerian” (or PK) parameters. These are: the advance of periastron , the orbital period decay , the time dilation-gravitational redshift factor , as well as the range and the shape of Shapiro delay, which are related to the component masses, the orbital period, and eccentricity by
| (2) |
| (3) |
| (4) |
| (5) |
In highly eccentric systems that have been observed repeatedly over a long period of time, the measurement of is usually possible and leads to a strong constraint on the total mass of the binary . The measurement of the parameter requires similarly eccentric systems and long-term monitoring. In high inclination systems, on the other hand, it is sometimes possible to detect the Shapiro time delay and obtain the parameters and . The measurement of the rate of orbital period decay typically requires the longest monitoring and timing of the pulsar, sometimes over decades. This has been achieved for a handful of pulsars in binaries.
The precision with which the pulsar mass can be determined ultimately depends on the number of PK parameters that are measured for that binary. In systems where two or more PK parameters are known, the pulsar mass is precisely determined. In the category where only one PK parameter is known in addition to the mass function, the mass of each neutron star is not as well constrained.
In the following, we divide neutron star mass measurements into categories based on the information available for each binary system such as the number of PK parameters. For each category, we derive the likelihood , which measures the chance of obtaining the particular set of data for the -th source if that source had mass .
We are ultimately interested in delineating the effects of mass accretion from the neutron star birth masses. We, therefore, further divide each category into groups based on the nature of the companion star or the spin of the pulsar. In particular, neutron star-neutron star (NS-NS) binaries, as well as eclipsing X-ray pulsars in high-mass X-ray binaries and slow radio pulsars are expected to have experienced little-to-no accretion. On the other hand, neutron star-white dwarf (NS-WD) binaries are the remnants of a long-lasting low-mass X-ray binary phase, where significant mass accretion may have occurred. We also group millisecond pulsars with main sequence companions (NS-MS) along with the latter group, because of the probable recycling these neutron stars underwent to reach millisecond periods. We will refer to the latter group as “fast pulsars”. Finally, we will also consider accreting X-ray bursters, for which the masses have been measured primarily through X-ray spectroscopy.
In detail, the various categories are:
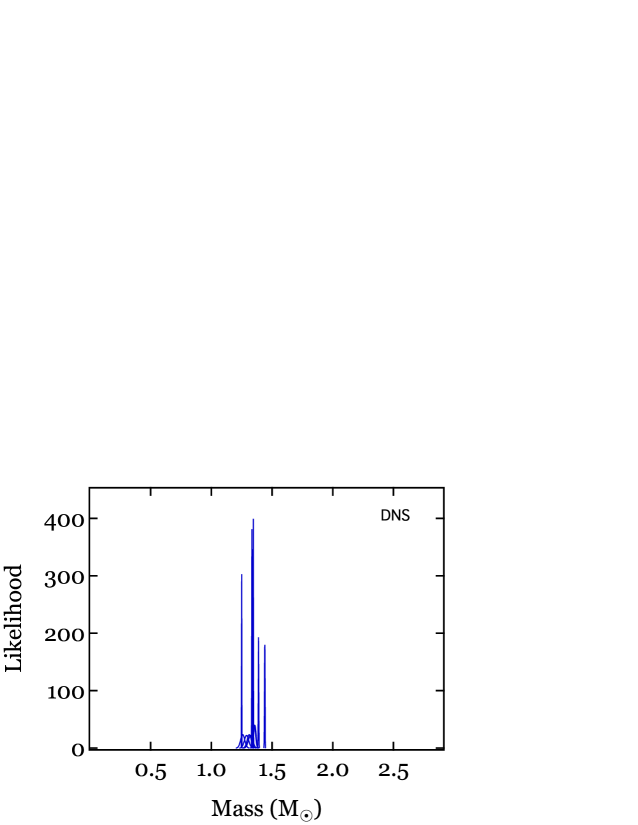
(Ia) Double Neutron Stars with at least 2 PK Parameters.— Six neutron star systems shown in Table 1 have at least 2 measured PK parameters leading to well determined masses. In this case, the likelihood of neutron star masses is highly symmetric and narrowly peaked, and thus can be described as a Gaussian
| (6) |
with a mean and a standard deviation . In this and the following expressions, is a proper normalization constant such that
| (7) |
| Name | Mass | Error | RefsbbReferences:
1. Kramer et al. 2006;
2. Stairs et al. 2002;
3. Ferdman 2008;
4. Lorimer et al. 2006;
5. Kasian 2012;
6. Weisberg et al. 2010;
7. Jacoby et al. 2006
|
|---|---|---|---|
| () | () | ||
| J0737-3039 | 1 | ||
| pulsar B | 1 | ||
| B1534+12 | 2 | ||
| companion | 2 | ||
| J1756-2251 | 3 | ||
| companion | 3 | ||
| J1906+0746 | 4, 5 | ||
| companion | 4, 5 | ||
| B1913+16 | 6 | ||
| companion | 6 | ||
| B2127+11C | 7 | ||
| companion | 7 |
We plot in Figure 1 the likelihood of the masses of NS-NS binaries that belong to this category.
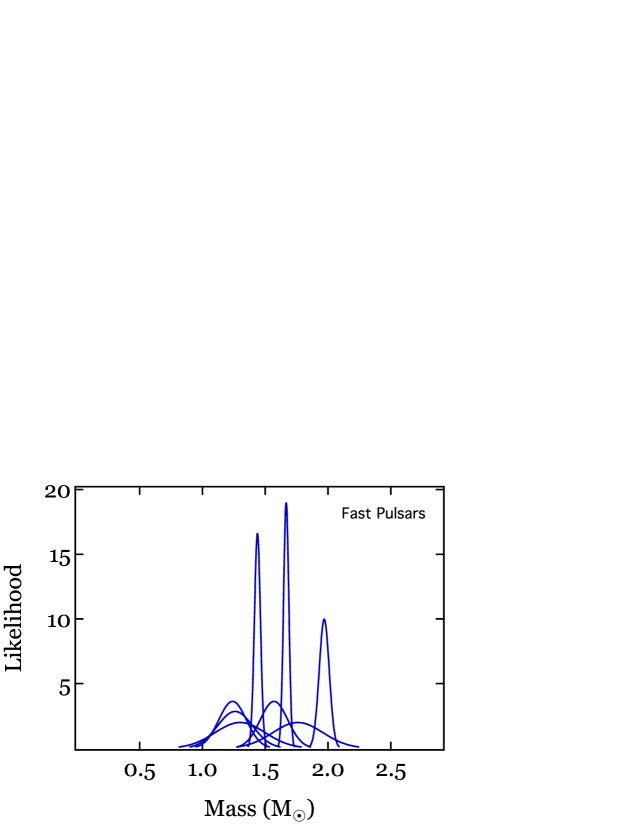
(Ib) Neutron Stars in Binaries with at least 2 PK Parameters.— To date, observations of nine neutron stars that are in close orbits around predominantly white dwarf companions have yielded a measurement of at least 2 PK parameters. The known exception is PSR J1903+0327, with a probable main sequence companion, but is nevertheless thought to be recycled owing to its millisecond period. As in the previous category, we assign a Gaussian likelihood to each measurement with a mean and a standard deviation . We present in Table 2 and Figure 2 the mass measurements and their uncertainties for these NS-WD binaries. Even though it has a white dwarf companion, PSR J11416545 is different from the rest of the sources in this category in that it is a slowly spinning neutron star. For this reason, we group it with the accreting and slow pulsars discussed below and show its likelihood in Figure 5.
| Name | Mass | Error | RefsbbReferences:
1. Verbiest et al. 2008;
2. Nice et al. 2005;
3. Nice et al. 2008;
4. Bhat et al. 2008;
5. Demorest et al. 2010;
6. Splaver et al. 2005;
7. Ferdman et al. 2010;
8. Nice et al. 2003;
9. Kaspi et al. 1994;
10. Freire et al. 2011;
11. Jacoby et al. 2005
|
|---|---|---|---|
| () | () | ||
| J0437-4715 | 1 | ||
| J0751+1807 | 2, 3 | ||
| J1141-6545 | 4 | ||
| J1614-2230 | 5 | ||
| J1713+0747 | 6 | ||
| J1802-2124 | 7 | ||
| B1855+09 | 8, 9 | ||
| J1903+0327 | 10 | ||
| J1909-3744 | 11 |
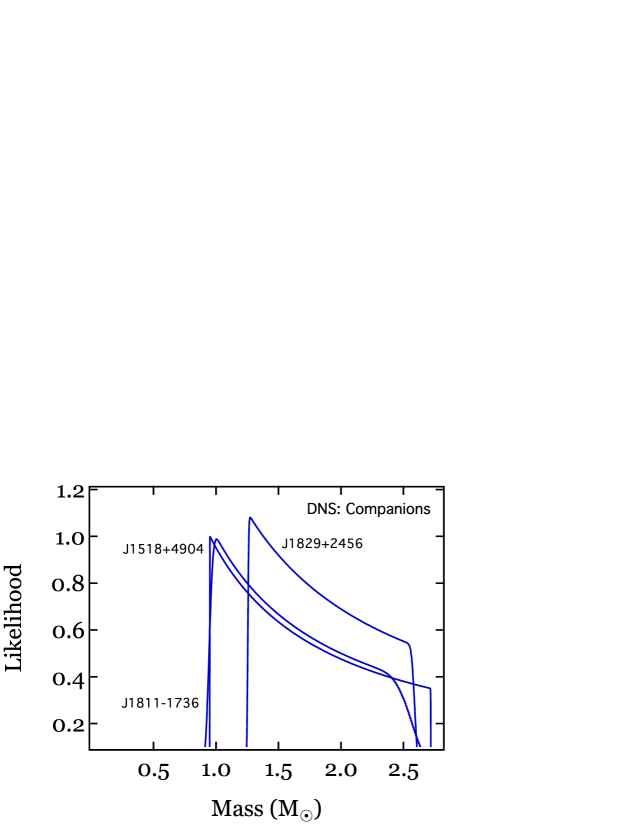
(IIa) Double Neutron Stars with 1 PK Parameter.— In this category, there are three double neutron stars, for which the measurement of the advance of periastron allows for a precise determination of the total mass of the binary. However, in the absence of a second PK parameter or a knowledge of the system inclination , the mass of each neutron star is not well constrained. In these cases, using the total mass of the system as a constraint allows us to write the likelihood of the mass of the pulsar as
| (8) |
and of the companion as
| (9) |
We present in Table 3 the relevant pulsar data for the three double neutron star binaries that are in this category. Figure 3 shows the likelihood of each neutron star mass for these sources, with the top panel including the pulsars and the bottom panel the companions. Note, however, that even though they are shown independently for the purposes of this figure, the likelihoods of the masses of the pulsar and its companion are not independent probabilities. Therefore, when inferring the mass distribution of double neutron stars, the constraint over the total mass is incorporated as we will discuss in §3.
| Name | RefsaaReferences:
1. Janssen et al. 2008;
2. Corongiu et al. 2007;
3. Champion et al. 2005
|
|||
|---|---|---|---|---|
| () | (deg yr-1) | () | ||
| PSR J1518+4904 | 0.115988 | 0.0113725(9) | 2.7183(7) | 1 |
| PSR J1811-1736 | 0.128121(5) | 0.0090(2) | 2.57(10) | 2 |
| PSR J1829+2456 | 0.29413(1) | 0.2929(16) | 2.59(2) | 3 |

(IIb) Neutron Stars in Binaries with 1 PK Parameter.— This category comprises of eleven neutron star binaries with mostly white dwarf companions. In several systems, the companions have not been identified. A constraint on the total mass comes from the measurement of the rate of advance of the periastron. We assign to each neutron star mass a likelihood according to equation (8). Table 4 and Figure 4 shows the relevant parameters for these systems. Note that, of this category, PSR B2303+46 is a slowly spinning neutron star. For this reason, we group it with the accreting and slow pulsars discussed below and show its likelihood in Figure 5.
| Name | RefsaaReferences:
1. Freire et al. 2003;
2. Freire et al. 2007;
3. Kasian 2012;
4. Freire et al. 2008a;
5. Freire et al. 2008b;
6. Ransom et al. 2005;
7. Thorsett & Chakrabarty 1999
|
|||
|---|---|---|---|---|
| () | (deg yr-1) | () | ||
| J0024-7204H | 0.001927 | 0.066(2) | 1.61(4) | 1 |
| J0514-4002A | 0.14549547 | 0.01289(4) | 2.453(14) | 2 |
| J0621+1002 | 0.027026849 | 0.0102(2) | 2.32(8) | 3 |
| B1516+02B | 0.000646723 | 0.0142(7) | 2.29(17) | 4 |
| J1748-2021B | 0.0002266235 | 0.00391(18) | 2.92(20) | 5 |
| J1748-2446I | 0.003658 | 2.17(2) | 4, 6 | |
| J1748-2446J | 0.013066 | 2.20(4) | 4, 6 | |
| J1750-37A | 0.0518649 | 0.00548(30) | 1.97(15) | 5 |
| B1802-07 | 0.00945034 | 0.0578(16) | 1.62(7) | 7 |
| J1824-2452C | 0.006553 | 1.616(7) | 4 | |
| B2303+46 | 0.246332 | 0.01019(13) | 2.64(5) | 7 |
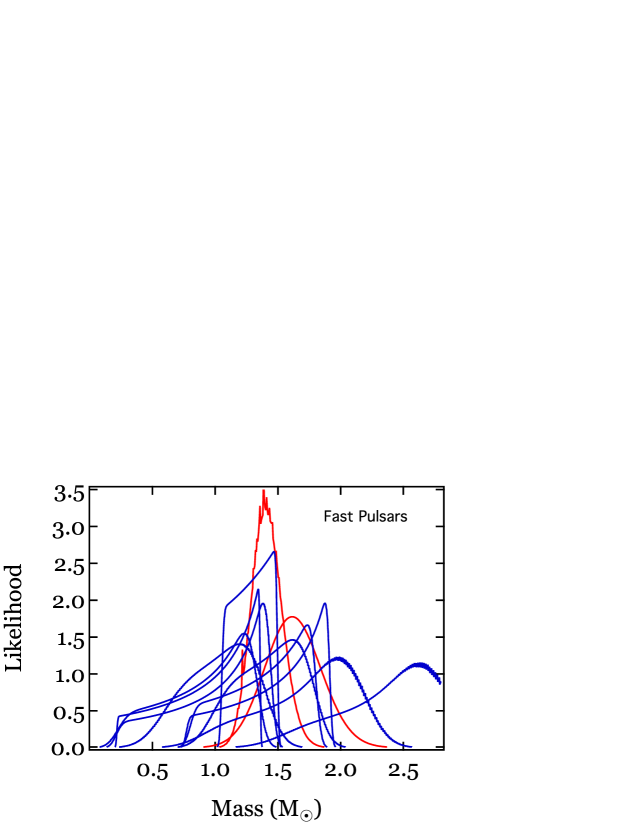
(III) Neutron Stars in Binaries with Optical Observations of White Dwarf Companions.— For two neutron stars in orbit around white dwarfs, optical observations of the companions have resulted in the measurements of the mass as well as of the radial velocity amplitude of the white dwarf. The latter, in combination with the orbital parameters obtained from the radio timing solution gives the mass ratio of the binary according to
| (10) |
Using this information, we can then calculate the likelihood of the neutron star mass as
| (11) |
where we assume that the error in the measurement of each mass function is negligible. We perform the integration over inclination making use of the identity
| (12) |
where is the solution of the equation , i.e.,
| (13) |
Given that
| (14) |
the likelihood becomes
| (15) |
Table 5 summarizes the relevant data for these two binaries. The likelihoods of the neutron star masses are shown as red curves in Figure 4.
| Name | RefsaaReferences:
1. Callanan et al. 1998;
2. Nicastro et al. 1995;
3. Bassa et al. 2006;
4. D’Amico et al. 2002
|
|||
|---|---|---|---|---|
| () | () | |||
| J1012+5307 | 0.00058709(2) | 0.1560.02 | 10.70.5 | 1,2 |
| B1911-5958A | 0.002687603(13) | 0.180.02 | 7.360.25 | 3,4 |
(IV) Eclipsing X-ray Pulsars.— Eclipsing X-ray pulsars provide a wealth of observational information using which we can estimate the masses of these neutron stars. X-ray observations of each pulsar give the orbital period of the binary , the eccentricity of the orbit , longitude of periastron , the semi-major axis of the neutron star’s orbit , and the semi-duration of the eclipse . In addition, optical observations of the companion star give its velocity amplitude , its projected rotational velocity , and the amplitude of ellipsoidal variations . From these observables, it is possible to solve for the fundamental parameters of the binary, viz., the mass of the neutron star , the mass, radius and rotational angular velocity of the companion, , , , and the inclination angle of the binary .
The necessary data are available for six eclipsing pulsars: Vela X–1, 4U1538–52, SMC X–1, LMC X–4, Cen X–3, and Her X–1 (see, e.g., van Kerkwijk, van Paradijs, & Zuiderwijk 1995; van der Meer et al. 2007). Recently, Rawls et al. (2011) collected all the available data and presented a detailed analysis of the likelihood of mass for the individual neutron stars; see Table 6 for a compilation of the relevant results.
There are several sources of potential systematic uncertainties in the masses inferred in these eclipsing binaries. For example, there are significant residuals in the radial velocity curves of Vela X-1 after the best-fit orbital solution is subtracted (e.g., Barziv et al. 2001), in which Quaintrell et al. (2003) noted the presence of a periodicity and suggested modes on the star as a possible origin. More recently, Koenigsberger et al. (2012) developed a model for these residuals based on the interaction between the neutron star and its companion but did not directly fit the model to the data. Even though they concluded that a 1.55 neutron star is marginally consistent with observations, a higher mass for the neutron star, centered around 1.7 , appears to be favored.
A second important source of systematic uncertainty arises from modeling of the ellipsoidal modulations, which includes a contribution from the accretion disk and may significantly influence the inferred neutron star masses. This disk contribution is often non-negligible (see Figs. 8, 9 of Rawls et al. 2011) and involves multiple parameters. In order to assess the influence of this additional information on our results, we reanalyze here the data of eclipsing pulsars ignoring the ellipsoidal modulations.
For each of the six systems, we write the likelihood of the data as a function of the neutron star mass as follows,
| (16) | |||||
Here is the mass function of the binary, and and are the measured value of and its uncertainty (obtained from X-ray timing observations). Similarly, , are the measured value of and its uncertainty, , are the measured value of and its uncertainty, and , are the measured semi-duration of the eclipse and its uncertainty. All these measurements are listed in Rawls et al. (2011) for the six systems of interest. Note that there is no measurement of for Her X-1, which leads to larger uncertainties in the mass determination of this source.
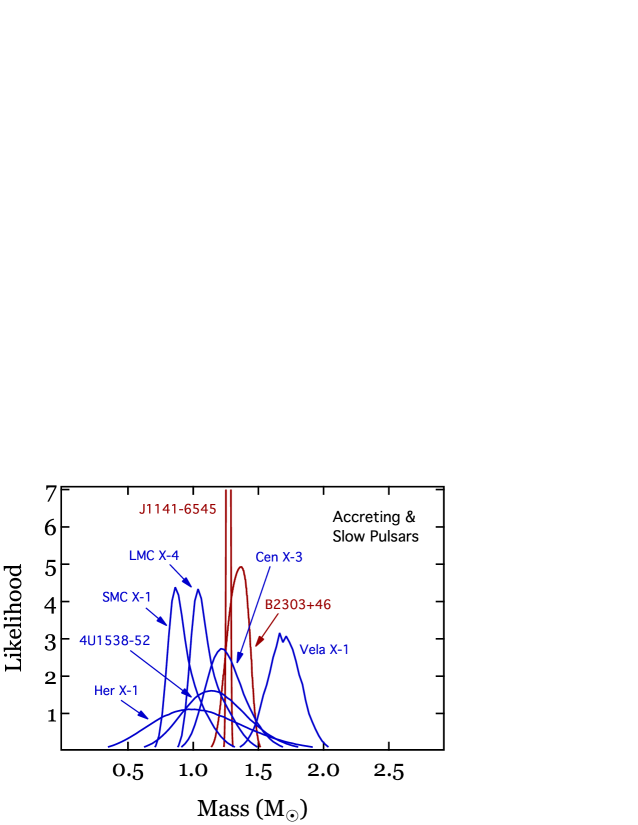
The quantity is equal to , where is the effective radius of the Roche lobe of the secondary. For the integration limits in equation (16), we choose , , , , where is the mean angular velocity of the binary orbit, and a sufficiently generous range of . As indicated in equation (16), we assume a flat prior for each of the variables, though we have confirmed that the results are not sensitive to this assumption. We calculate for each of the six X-ray pulsars by computing the integrals via a Monte Carlo method. We show in Figure 5 the resulting likelihoods of mass for each of the six systems and summarize the results in Table 6.
We consider an eccentric orbit in the case of Vela X-1 using the value of given in Rawls et al. (2011), and we assume a circular orbit for the other five systems. Rawls et al. (2011) considered both eccentric and circular orbits for 4U1538–52. However, the evidence for eccentricity is not very strong. Moreover, the estimate of that they obtain for their eccentric orbit solution appears to be anomalously low (it does not fit the measured velocities very well — see the lower left panel of their Fig. 9). For this reason, we consider only a circular orbit for 4U1538–52, and we take as estimated by Rawls et al. (2011). (The fit to the velocity data appears to be better in this case — see the bottom right panel of their Fig. 9.)
| Rawls et al. (2011)aaThese values are taken from Table 4 of Rawls et al. (2011). | This Work | |||||
|---|---|---|---|---|---|---|
| Name | Mass | i | Mass | i | ||
| deg | deg | |||||
| Vela X1 | 1.7700.083 | 78.81.2 | 1 | 1.700.13 | 86.32.6 | 0.990.01 |
| 4U 153852 | 0.9960.101 | 76.86.7 | 0.88 | 1.180.25 | 76.98.0 | 0.870.07 |
| SMC X1 | 1.0370.085 | 68.55.2 | 0.95 | 0.930.12 | 77.28.0 | 0.870.07 |
| LMC X4 | 1.2850.051 | 67.01.9 | 0.95 | 1.110.12 | 77.97.5 | 0.870.07 |
| Cen X3 | 1.4860.082 | 66.72.4 | 1 | 1.260.15 | 78.67.0 | 0.910.05 |
| Her X1 | 1.0730.358 | 1 | 1.080.36 | 84.14.1 | 0.940.04 | |
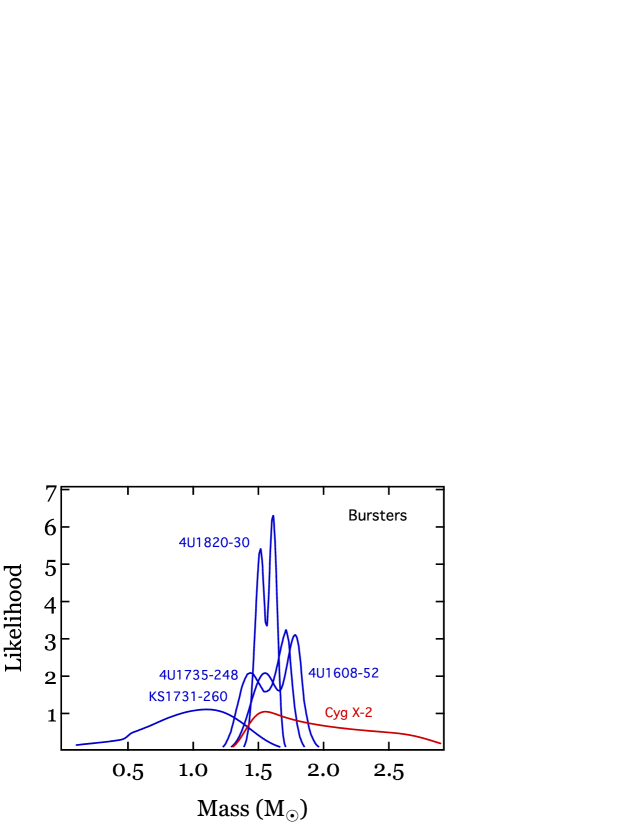
(V) Accreting Bursting Neutron Stars.— Spectroscopic observations of a number of neutron stars during thermonuclear X-ray bursts have led to measurements of their masses and radii. This category includes 4U 1745248 (Özel et al. 2009), 4U 160852 (Güver et al. 2010a), 4U 182030 (Güver et al. 2010b), and KS 1731260 (Özel et al. 2012). We convert the posterior likelihood of mass and radius for each neutron star reported in these analyses into a likelihood of mass by integrating over radius as
| (17) |
The resulting likelihoods are shown in Figure 6.
The mass of a fifth burster, Cyg X-2, has been measured in a different manner using the optical observations of its companion star (Orosz & Kuulkers 1999). These observations yield the mass function of the binary , a range of allowed mass ratios , as well as a measurement of the binary inclination . Using this information, we calculate the posterior likelihood of the mass of the neutron star according to (Özel et al. 2010a)
| (18) |
and plot it in Figure 6.
3. The Intrinsic Distribution of Neutron Star Masses
The range of neutron star masses that can be produced in astrophysically plausible scenarios is rather narrow, from to . The posterior likelihood functions for the neutron star mass measurements we report in the previous section are indeed within this range. Moreover, earlier studies of the neutron star masses indicated a narrowly peaked distribution (Finn 1994; Thorsett & Chakrabarty 1999). For these reasons, we will model the distribution of neutron star masses with a mean and a dispersion , i.e.,
| (19) |
Our goal in this section is to obtain the most likely values for the parameters and of this distribution that are consistent with the measurements.
Using Bayes’ theorem, we can write the probability that measures the likelihood of the parameters of the neutron star mass distribution as
| (20) |
where is an appropriate normalization constant and and are the priors over the parameters of the mass distribution. Hereafter, we will assume a flat prior over between 1 and as well as a flat distribution over between zero and . We repeated the analysis using a logarithmic prior distribution, which had indistiguishable effects on the final results. This is expected, given that the inferred mass distributions are all very narrow and, therefore, are not sensitive to any weak priors.
In equation (20), the quantity measures the posterior probability of having made a particular set of observations for the ensemble of neutron stars given the values of the parameters of the mass distribution. Under the assumption that each measurement is independent of all the others, we calculate this quantity using
| (21) |
The only case where this assumption is not satisfied is for double neutron stars in category IIa, for which the mass measurements of the pulsar and the companion neutron star are not independent. For these three binary systems, we write instead
| (22) | |||||
In Section 2, we divided the neutron star mass measurements not only according to the technique by which these measurements were obtained but also by the type of companion and the spin period of the neutron star. We carried out the latter division in anticipation of the fact that fast and slow pulsars are drawn from different parent populations, i.e., from those which have and have not experienced significant mass accretion phases. In the following, we derive the parameters of the intrinsic mass distributions for each of those populations separately. We then address the extent to which the particular evolutionary channels followed by each type of neutron star leaves a measurable imprint on the mass distribution.
3.1. Neutron Stars at or Near their Birth Masses
The low spin periods of a number of pulsars in our sample are indicative of mild or even no recycling due to mass accretion. We, therefore, consider the masses of neutron stars in this population likely to be very near their birth values. This sample includes categories Ia and IIa for double neutron stars, category IV for accreting pulsars with primarily high-mass companions, as well as one pulsar each in categories Ib (PSR J11416545) and IIb (PSR B2303+46).
We first study the underlying mass distribution of the double neutron stars. The mass measurements in these systems have by far the smallest errors, which can dominate the parameter estimation of the mass distribution of the total ensemble. Furthermore, these binaries have followed a very particular and highly selective evolutionary path, which may be evident in their mass distribution. We group the remaining sources together as a second sample that consists of neutron stars likely to be near their birth masses.
3.1.1 Double Neutron Stars
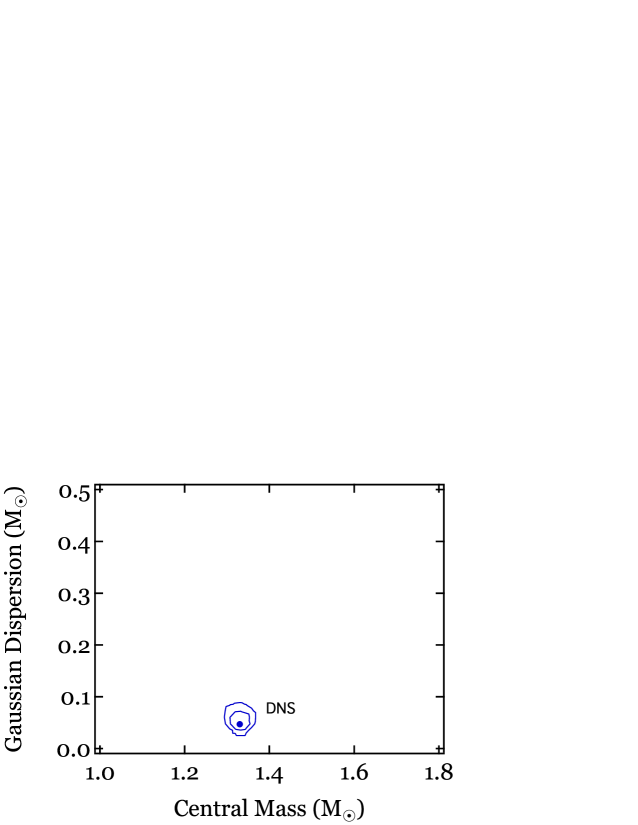
Figure 7 shows the 68% and 95% confidence contours over the parameters of the intrinsic Gaussian distribution that is consistent with the observed masses of nine double neutron stars. The most likely value of the mean of the Gaussian distribution is 1.33 and that of the dispersion is 0.05 . It is evident from the figure that the uncertainties in the parameters of the underlying distribution are very small: the 68% errors are 0.03 in both parameters.
Our results are in agreement with the distribution reported by Thorsett & Chakrabarty (1999), who found a mean of 1.35 and a dispersion of 0.04 , and with the more recent results of Kiziltan et al. (2010) for this category.
An interesting question we can address with the sample of double neutron stars is whether the two members of each binary system are drawn from the same underlying population. To study this, we divided the sample into one of pulsars and one of the companions. Note that for the double pulsar, we assigned the faster pulsar to the “pulsar” and the slower to the “companion” categories. Repeating the above inference for these two subgroups individually, we found that the most likely parameters of the mass distribution for the pulsars are and , whereas for the companions they are and . These parameters are the same within the 68% confidence ranges of each.
One further question about the double neutron star population concerns the mass ratio in each binary. The mass ratios of the neutron stars in two of the six binaries with well determined masses are within one part in of unity. This is an order of magnitude smaller than the most likely dispersion of the underlying mass distribution. We explored whether the distribution of observed mass ratios is consistent with the pulsar and the companion being drawn independently from a Gaussian distribution with the parameters we determined above.
The posterior likelihood of observing a binary with pulsar and companion masses of and , respectively, is given by
| (23) |
To convert this into a distribution over the mass ratio, we set and write
| (24) | |||||
In Figure 8, we compare the cumulative likelihood of the mass ratio
| (25) |
calculated for the most likely values of the parameters of the Gaussian, to the cumulative distribution of the observed mass ratios of the 6 double neutron stars with well determined masses. The similarity between the two distributions is striking and demonstrates that the pulsar and the companion in each of the double neutron stars are consistent with having been drawn independently from the same narrow distribution of masses.
We also explored whether the observed distribution of mass ratios is consistent with the predicted cumulative distribution for neutron star pairs drawn independently from the double Gaussian distribution suggested by Schwab et al. (2010; their eq. (1)). The result is shown as a green line in Figure 8. The width of the individual components in the bimodal distribution is significantly narrower than the width of the single Gaussian that we infer here. This leads to a larger fraction of double neutron stars with mass ratios closer to unity for the bimodal distribution, which is not in agreement with the observed sample.

3.1.2 Accreting and Slow Pulsars
The second subgroup consists of neutron stars accreting from high-mass companions and slow pulsars, which are likely to be near their birth masses. To infer the neutron star mass distribution, we will use both the numerical results of Rawls et al. (2011) as well as our analytic results discussed in §2, in which the information regarding ellipsoidal variations in the lightcurves was not taken into account.
In Figure 9, we show the 68% and 95% confidence limits on the Gaussian parameters of the underlying mass distribution for the accreting and slow pulsars, using the numerical results of Rawls et al. (2011). For comparison, we overplot the equivalent confidence contours for the double neutron stars. There is a small but statistically insignificant shift in the central mass of the Gaussian between the two populations. On the other hand, the Gaussian dispersions between the two populations are different to a high statistical significance. In other words, even though both of these populations are believed to represent neutron stars near their birth masses, the double neutron stars are drawn from a significantly narrower distribution of masses. The most likely values of the central mass and dispersion for the accreting and slow pulsars are 1.28 and 0.24 , respectively.

The Rawls et al. (2011) analysis depends on a synthesis of a large number of spectroscopic and photometric measurements of the binaries that are used to infer the binary parameters. Fitting these observations, and especially taking into account the ellipsoidal variations requires complex models of the shape of the companion star and of the relative contribution of light from the accretion disk. Moreover, the photometric observations of the ellipsoidal variations typically are the lowest signal-to-noise components of the mass measurements. In order to assess the possible influence of the modeling of the ellipsoidal variations on our results, we also infer the underlying mass distribution using our analytical posterior probabilities discussed in §3. Figure 10 shows the resulting 68% and the 95% confidence contours for the parameters of the mass distribution. In this case, the most likely values of the central mass and dispersion for the accreting and slow pulsars are 1.24 and 0.20 , respectively. Comparing these to the distribution inferred from the numerical results of Rawls et al. (2011), we see that the central mass remains unchanged, but the dispersion becomes less constrained and is even statistically consistent with that of double neutron stars.

3.2. Recycled Neutron Stars
We now focus on the subgroup of neutron stars which have been recycled through extended mass accretion. Neutron stars with white dwarf companions, millisecond pulsars, as well as neutron stars in low-mass X-ray binaries currently undergoing accretion (categories Ib, IIb, III, and V) belong to this group. Figure 11 shows the confidence contours over the parameters of the Gaussian distribution for the recycled neutron stars. The most likely value of the central mass is 1.48 and of the dispersion is 0.20 . Both the dispersion and the mean are similar to those found by Kiziltan et al. (2010) within statistical uncertainties. The uncertainties in the mean value quoted by Kiziltan et al. (2010), however, are significantly smaller than those shown in Figure 11 (c.f. Figure 3 of Kiziltan et al. 2010).
There are two main differences between our study and that of Kiziltan et al. (2010) with regard to the recycled neutron star sample. First, we make use of the detailed posterior likelihood for each mass measurement, whereas Kiziltan et al. (2010) appear to have approximated them with asymmetric Gaussians. Second, we include in our sample neutron stars in low-mass X-ray binaries for which mass measurements were performed mostly spectroscopically and typically have larger uncertainties.

In order to assess the sensitivity of our results to the inclusion of the accreting neutron stars, we repeat the inference of the mass distribution parameters using only the radio pulsars in categories Ib and IIb. In Figure 12 we show the resulting confidence contours. The difference with the entire sample is minimal: the most likely mean value and the dispersion are 1.46 and 0.21 , respectively. We, therefore, attribute the small difference with the Kiziltan et al. (2010) results to our handling of the posterior likelihood distributions for each measurement.

4. Discussion
In this paper, we investigated the distribution of neutron star masses in different types of binary systems and at different stages of evolution based on currently available measurements. We summarize the neutron star mass measurements and their uncertainties in each subgroup in Figure 13 and compare them to those of black holes in Figure 14 (compiled and analyzed in Özel et al. 2010a). In these figures, the error bars correspond to a 68% confidence level calculated from the detailed likelihood distribution presented for each subgroup of sources in §2.


In the top panel of Figure 15, we show the inferred mass distributions of the various neutron star populations discussed in Section 2. For each population, we present two different distributions. The dashed lines correspond to the most likely parameters of the underlying distributions inferred in Section 3. Each solid line represents the weighted distribution over the central mass and dispersion for each population. We compute this weighted distribution as
| (26) |
where and is given by equations 19 and 20, respectively. In the Appendix, we provide approximate analytic fitting formulae for these weighted distributions for each population.
In the bottom panel of Figure 15, we compare the inferred mass distribution for recycled neutron stars to that of black holes reported in Özel et al. (2010a). For the latter, we use the exponential model with a lower mass cutoff given by
| (27) |
The most likely values for the parameters of this distribution are and . In the same panel, we also include the appropriate weighted distribution for the black holes, where we carried out the integration over the posterior likelihood of the parameters and ; we provide an analytic fitting formula for the weighted distribution in the Appendix. This panel highlights the substantial mass gap that exists between the black hole population and even the heaviest neutron star population (see the discussion in Özel et al. 2010a and Farr et al. 2011).
Within the neutron star population, it is evident from these figures that the mass distribution of double neutron star systems is different than those observed in other binary systems, which include both neutron stars near their birth masses as well as neutron stars that experienced significant accretion episodes. Indeed, the most likely values of the mean mass and the dispersion we derived for these populations using the Bayesian inference technique discussed in §3 are for double neutron stars, in contrast to for other neutron stars near their birth masses and for recycled neutron stars. Note that the uncertainties in both the mean mass and the dispersion for all of these subgroups are shown in Figures 9-12.
The narrowness of the mass distribution of double neutron stars is difficult to account for within the current understanding of neutron star formation mechanisms. One possible way to generate a narrow distribution is via electron capture supernovae in ONeMg white dwarfs. The onset of such a supernova occurs at a particular density threshold, which corresponds to a pre-collapse mass of the white dwarf in the narrow range for different temperatures and compositions (Podsiadlowski et al. 2005). Taking into account a binding mass given by the approximate formula (Lattimer & Yahil 1989)
| (28) |
the gravitational masses of the outcomes of electron capture supernovae become . This range of masses is compared to the parameters of the underlying distributions of double neutron stars as well as of the other neutron stars near their birth masses in Figure 16. Even though the electron capture supernovae are capable of producing a narrow range of neutron star masses, the mean of the expected distribution is inconsistent with that of double neutron stars to a high confidence level.

In the case of core collapse supernovae, the mean mass of the neutron stars produced in the absence of fallback is also expected to be significantly smaller than that inferred from the double neutron stars. We can estimate this mass assuming that the core of the pre-supernova star collapses when it reaches its Chandrasekhar limit. Considering an electron fraction of , which is appropriate for the cores of presupernova stars (Timmes et al. 1996), the Chandrasekhar mass
| (29) |
falls in the range . Taking into account the gravitational binding energy, the expected range of birth masses for neutron stars from core-collapse supernovae is .
Fallback of matter during and immediately following the supernova explosion can naturally lead to neutron stars more massive than the cores of the progenitor stars. At the same time, the stochastic nature of fallback necessarily leads to an increased dispersion of neutron star masses. In Figure 16, we show the evolution of the expected dispersion with central mass assuming that a fallback of baryonic mass introduces a dispersion of the baryonic mass of the neutron star of the same magnitude. (Note that in Fig. 16, we plot the corresponding gravitational mass for the neutron stars.) This simple analytical estimate is in agreement with the detailed numerical calculations of Zhang et al. (2008), which are also shown in the figure. The green hatched region outlines the results for different compositions, explosion energies, and locations of the pistons for an assumed maximum neutron star mass of . Allowing sufficient fallback to account for the mean value of the double neutron star masses introduces a dispersion that is significantly larger than the observed one. In contrast, the inferred mean and dispersion of the mass distribution of other neutron stars believed to be near their birth masses (labeled accreting and slow pulsars) are in agreement with theoretical expectations of core collapse supernovae.
Considering a bimodal mass distribution for the double neutron stars, as in Schwab et al. (2010), aggravates these challenges. First, as we showed in §3, the cumulative likelihood of the mass ratio for such a distribution does not agree with the cumulative distribution of the observed mass ratios for the double neutron stars. Second, the dispersion in the two components becomes even smaller, , making the higher mass component even less consistent with the expectations of the core collapse supernovae. All of these arguments lead to the conclusion that the mass distribution of double neutron stars is peculiar and perhaps related to the particular evolutionary history that leads to their formation.
The masses of the population of recycled neutron stars, which include fast pulsars with white dwarf companions as well as accreting bursters, are consistent with them having undergone extended periods of accretion. On average, recycled neutron stars are more massive by compared to other accreting and slow pulsars. Such a mass increase is more than adequate to recycle these pulsars to millisecond periods. Indeed, assuming that the mass is transferred onto the neutron star via an accretion disk that is magnetically truncated at the corotation radius
| (30) |
where is the spin frequency of the neutron star, the angular momentum transferred per unit mass is
| (31) |
After accreting mass , the neutron star acquires an angular momentum . Equating this to the spin angular momentum of the recycled pulsar , where is its moment of inertia, allows us to calculate the mass required to spin up the pulsar as
| (32) |
It is interesting that the most likely value of the mean mass of the recycled pulsars is significantly smaller than the lower bound on the maximum mass of a neutron star (Demorest et al. 2010; Özel et al. 2010b) as well as the average mass of recycled neutron stars predicted by population synthesis studies (e.g., Pfahl, Rappaport, & Podsiadlowski 2003; Lin et al. 2011). This conclusion can be used to refine models of low-mass X-ray binary evolution. Furthermore, our analysis shows that a very small fraction of neutron stars reach masses comparable to the maximum possible neutron star mass and collapse into black holes. Therefore, this channel does not contribute significantly to a putative but still undetected population of low-mass black holes in the Galaxy (see the discussion in Özel et al. 2010a).
Appendix A Fitting Formulae for Weighted Mass Distributions of Neutron Stars and Black Holes
The weighted distributions of all of the neutron star populations, shown as solid lines in Figure 15, are well approximated by Gaussian functions, with a mean and dispersion of and for the double neutron stars, and for other neutron stars near their birth mass, and and for recycled neutron stars.
We also obtained a fitting formula for the normalized weighted mass distribution of black holes (solid line in the bottom panel of Fig. 15) for that approximates the numerical result to within :
| (A1) |
where
| (A2) |
References
- Barziv et al. (2001) Barziv, O., Kaper, L., Van Kerkwijk, M. H., Telting, J. H., & Van Paradijs, J. 2001, A&A, 377, 925
- Bassa et al. (2006) Bassa, C. G., van Kerkwijk, M. H., Koester, D., & Verbunt, F. 2006, A&A, 456, 295
- Bhat et al. (2008) Bhat, N. D. R., Bailes, M., & Verbiest, J. P. W. 2008, Phys. Rev. D, 77, 124017
- Callanan et al. (1998) Callanan, P. J., Garnavich, P. M., & Koester, D. 1998, MNRAS, 298, 207
- Champion et al. (2005) Champion, D. J., Lorimer, D. R., McLaughlin, M. A., et al. 2005, MNRAS, 363, 929
- Corongiu et al. (2007) Corongiu, A., Kramer, M., Stappers, B. W., et al. 2007, A&A, 462, 703
- D’Amico et al. (2002) D’Amico, N., Possenti, A., Fici, L., et al. 2002, ApJ, 570, L89
- Demorest et al. (2010) Demorest, P. B., Pennucci, T., Ransom, S. M., Roberts, M. S. E., & Hessels, J. W. T. 2010, Nature, 467, 1081
- Farr et al. (2011) Farr, W. M., Sravan, N., Cantrell, A., et al. 2011, ApJ, 741, 103
-
Ferdman (2008)
Ferdman, R. D. 2008, Ph. D. thesis,
University of British Columbia,
http://hdl.handle.net/2429/370 - Ferdman et al. (2010) Ferdman, R. D., Stairs, I. H., Kramer, M., et al. 2010, ApJ, 711, 764
- Finn (1994) Finn, L. S. 1994, Physical Review Letters, 73, 1878
- Freire et al. (2003) Freire, P. C., Camilo, F., Kramer, M., et al. 2003, MNRAS, 340, 1359
- Freire et al. (2007) Freire, P. C. C., Ransom, S. M., & Gupta, Y. 2007, ApJ, 662, 1177
- Freire et al. (2008) Freire, P. C. C., Ransom, S. M., Bégin, S., et al. 2008, ApJ, 675, 670
- Freire et al. (2008) Freire, P. C. C., Wolszczan, A., van den Berg, M., & Hessels, J. W. T. 2008, ApJ, 679, 1433
- Freire et al. (2011) Freire, P. C. C., Bassa, C. G., Wex, N., et al. 2011, MNRAS, 412, 2763
- Guver et al. (2010) Güver, T., Özel, F., Cabrera-Lavers, A., & Wroblewski, P. 2010a, ApJ, 712, 964
- Güver et al. (2010) Güver, T., Wroblewski, P., Camarota, L., Özel, F. 2010b, ApJ, 719, 1807
- Jacoby et al. (2005) Jacoby, B. A., Hotan, A., Bailes, M., Ord, S., & Kulkarni, S. R. 2005, ApJ, 629, L113
- Jacoby et al. (2006) Jacoby, B. A., Cameron, P. B., Jenet, F. A., et al. 2006, ApJ, 644, L113
- Janssen et al. (2008) Janssen, G. H., Stappers, B. W., Kramer, M., et al. 2008, A&A, 490, 753
-
Kasian (2012)
Kasian, L. E. 2012, Ph. D. thesis,
University of British Columbia,
http://hdl.handle.net/2429/41515 - Kaspi et al. (1994) Kaspi, V. M., Taylor, J. H., & Ryba, M. F. 1994, ApJ, 428, 713
- Koenigsberger et al. (2012) Koenigsberger, G., Moreno, E., & Harrington, D. M. 2012, A&A, 539, A84
- Kramer et al. (2006) Kramer, M., Stairs, I. H., Manchester, R. N., et al. 2006, Science, 314, 97
- Kiziltan et al. (2010) Kiziltan, B., Kottas, A., & Thorsett, S. E. 2010, arXiv:1011.4291
- Lattimer & Yahil (1989) Lattimer, J. M., & Yahil, A. 1989, ApJ, 340, 426
- Lin et al. (2011) Lin, J., Rappaport, S., Podsiadlowski, P., et al. 2011, ApJ, 732, 70
- Lorimer et al. (2006) Lorimer, D. R., Stairs, I. H., Freire, P. C., et al. 2006, ApJ, 640, 428
- Nicastro et al. (1995) Nicastro, L., Lyne, A. G., Lorimer, D. R., et al. 1995, MNRAS, 273, L68
- Nice et al. (2005) Nice, D. J., Splaver, E. M., Stairs, I. H., et al. 2005, ApJ, 634, 1242
- Nice et al. (2008) Nice, D. J., Stairs, I. H., & Kasian, L. E. 2008, 40 Years of Pulsars: Millisecond Pulsars, Magnetars and More, 983, 453
- Nice et al. (2003) Nice, D. J., Splaver, E. M., & Stairs, I. H. 2003, Radio Pulsars, 302, 75
- Orosz & Kuulkers (1999) Orosz, J. A., & Kuulkers, E. 1999, MNRAS, 305, 132
- Ozel et al. (2009) Özel, F., Güver, T., & Psaltis, D. 2009, ApJ, 693, 1775
- Özel et al. (2010) Özel, F., Psaltis, D., Narayan, R., & McClintock, J. E. 2010a, ApJ, 725, 1918
- Özel et al. (2010) Özel, F., Psaltis, D., Ransom, S., Demorest, P., & Alford, M. 2010b, ApJ, 724, L199
- Ozel et al. (2012) Özel, F., Gould, A., & Güver, T. 2012, ApJ, 748, 5
- Pfahl et al. (2003) Pfahl, E., Rappaport, S., & Podsiadlowski, P. 2003, ApJ, 597, 1036
- Podsiadlowski et al. (2005) Podsiadlowski, P., Dewi, J. D. M., Lesaffre, P., et al. 2005, MNRAS, 361, 1243
- Quaintrell et al. (2003) Quaintrell, H., Norton, A. J., Ash, T. D. C., et al. 2003, A&A, 401, 313
- Ransom et al. (2005) Ransom, S. M., Hessels, J. W. T., Stairs, I. H., et al. 2005, Science, 307, 892
- Rawls et al. (2011) Rawls, M. L., Orosz, J. A., McClintock, J. E., et al. 2011, ApJ, 730, 25
- Schwab et al. (2010) Schwab, J., Podsiadlowski, P., & Rappaport, S. 2010, ApJ, 719, 722
- Splaver et al. (2005) Splaver, E. M., Nice, D. J., Stairs, I. H., Lommen, A. N., & Backer, D. C. 2005, ApJ, 620, 405
- Stairs et al. (2002) Stairs, I. H., Thorsett, S. E., Taylor, J. H., & Wolszczan, A. 2002, ApJ, 581, 501
- Thorsett & Chakrabarty (1999) Thorsett, S. E., & Chakrabarty, D. 1999, ApJ, 512, 288
- Timmes et al. (1996) Timmes, F. X., Woosley, S. E., & Weaver, T. A. 1996, ApJ, 457, 834
- Valentim et al. (2011) Valentim, R., Rangel, E., & Horvath, J. E. 2011, MNRAS, 414, 1427
- van Kerkwijk et al. (1995) van Kerkwijk, M. H., van Paradijs, J., & Zuiderwijk, E. J. 1995, A&A, 303, 497
- van der Meer et al. (2007) van der Meer, A., Kaper, L., van Kerkwijk, M. H., Heemskerk, M. H. M., & van den Heuvel, E. P. J. 2007, A&A, 473, 523
- Verbiest et al. (2008) Verbiest, J. P. W., Bailes, M., van Straten, W., et al. 2008, ApJ, 679, 675
- Weisberg et al. (2010) Weisberg, J. M., Nice, D. J., & Taylor, J. H. 2010, ApJ, 722, 1030
- Zhang et al. (2011) Zhang, C. M., Wang, J., Zhao, Y. H., et al. 2011, A&A, 527, A83
- Zhang et al. (2008) Zhang, W., Woosley, S. E., & Heger, A. 2008, ApJ, 679, 639