The ancient stellar population of M 32:
RR Lyr Variable stars confirmed
Using archival multi–epoch ACS/WFC images in the F606W and F814W filters of a resolved stellar field in Local Group dwarf elliptical galaxy M 32 we have made an accurate ColourMagnitude Diagram and a careful search for RR Lyr variable stars. We identified 416 bona fide RR Lyr stars over our field of view, and their spatial distribution shows a rising number density towards the centre of M 32. These new observations clearly confirm the tentative result of Fiorentino et al. (2010), on a much smaller field of view, associating an ancient population of RR Lyr variables to M 32. We associate at least 83 RR Lyr stars in our field to M 32.
In addition the detection of 4 Anomalous Cepheids with masses in the range 1.21.9 M⊙ indicates the presence of relatively young, 14 Gyr old, stars in this field. They are most likely associated to the presence of the blue plume in the ColourMagnitude Diagram. However these young stars are unlikely to be associated with M 32 because the radial distribution of the blue plume does not follow the M 32 density profile, and thus they are more likely to belong to the underlying M 31 stellar population. Finally the detection of 3 Population II Cepheids in this field gives an independent measurement of the distance modulus in good agreement with that obtained from the RR Lyr, =24.33 0.21 mag.
Key Words.:
Local Group — galaxies: individual: M 32, M 31 — stars: horizontal-branch – stars: variables: other1 Introduction
The compact dwarf elliptical galaxy M 32 is one of the few elliptical galaxies close enough that, with the help of HST, direct observations can be made of its ancient resolved stellar population (e.g., Grillmair et al., 1996; Alonso-García et al., 2004; Fiorentino et al., 2010b; Monachesi et al., 2011). Another example is the peculiar giant elliptical galaxy Cen A, at a distance of 3.8 Mpc, where the red giant branch (RGB) and red clump (RC) have been resolved in the outer halo (e.g., Rejkuba et al., 2011). More distant elliptical galaxies, and also the extremely high surface brightness inner regions of M 32, can only be studied in integrated light (e.g., Renzini, 2006; Rose, 1994; Trager et al., 2000; Coelho et al., 2009). Integrated light provides a picture of the mean properties of a galaxy, but these analyses are rarely unique and cannot avoid a strong bias from the dominant stellar population.
The search for traces of an old (10 Gyr) stellar population is the main motivation for this study of the resolved stellar population of M 32. RRLyr variable stars are unequivocal indicators of the presence of a stellar population 10 Gyr old. There have been a number of detailed studies of the RRLyr population of M 31, both with groundbased wide field surveys of the halo (Pritchet & van den Bergh, 1987; Dolphin et al., 2004), and HST monitoring of M 31 globular clusters (Clementini et al., 2009) and small halo and disk fields (Brown et al., 2004; Jeffery et al., 2011). Thare have also been studies in the region around M 32 (Alonso-García et al., 2004; Sarajedini et al., 2009; Fiorentino et al., 2010b).
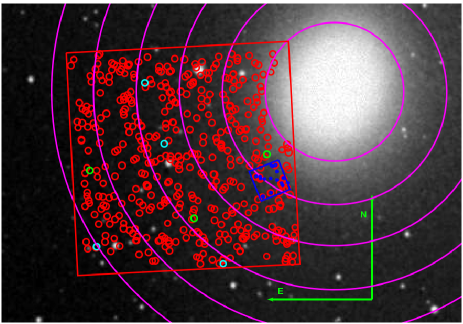
A recent analysis of the resolved stellar population of M 32 using the ACS/HRC camera, which has a tiny field of view 30x30 arsec square (see small blue square in Fig. 1) but very high spatial resolution (a factor two better than WFC/ACS), concluded that the bulk of the stellar population has an age in the range Gyrs old, with a mean metallicity, [Fe/H] 0.2 dex (Monachesi et al., 2011). However their Colour-Magnitude-Diagram (CMD) did not reach the Main Sequence Turn Off stars of the oldest stellar population. They also associated a faint blue plume (BP) of stars in the CMD to 1 Gyr old stars in M 32. Using the same ACS/HRS data 17 RRLyr were found, and it was tentatively suggested that could be associated to M 32 (Fiorentino et al., 2010b). The small field of view made this result highly uncertain simply due to the poor spatial sampling of a sparse population and the significant contamination from M 31. Here we use archival ACS/WFC data, with significantly better spatial coverage (see large red square in Fig. 1), to revisit the detection of RRLyr associated with M 32.
2 Data reduction and analysis
. Field Filter Exposure time Date F1 00h42m56s +40∘50′50′′ 81000 24 Nov 2004 F1 00h42m56s +40∘50′50′′ 51000 25 Nov 2004 F1 00h42m56s +40∘50′50′′ 51000 10 Dec 2004 F1 00h42m56s +40∘50′27′′ 81580 24 Nov 2004 F1 00h42m56s +40∘50′27′′ 51580 25 Nov 2004 F1 00h42m56s +40∘50′27′′ 51580 10 Dec 2004
We used 36 archival ACS/WFC images111Proposal id: 9392; PI: M. Mateo, covering a 3.3 x 3.3 arcmin square region, centred at 00 42 56 40 50 50 (J2000), and extending from 1 to 4.5 arcmin from the centre of M 32, see Fig. 1 and Table 1. The cadence of the images was chosen with the aim of picking up short period variable stars (periods 1 day), which includes RRLyr. The sensitivity of the temporal sampling to these short periods is close to 100% complete, for variable stars with periods 1 day.
2.1 Photometric analysis
We used the same data reduction and analysis techniques described in Fiorentino et al. (2010a, b). The PSFfitting photometry was carried out using DOLPHOT, a version of HSTphot modified for ACS images (Dolphin, 2000b). DOLPHOT returns a time series of measurements for each image as well as a final mean magnitude for all stars found on all the individual frames. DOLPHOT also makes automatic aperture corrections, following the prescription of Sirianni et al. (2005), and corrects for charge transport efficiency (CTE) effects (as described in Dolphin, 2000a). Thus we end up with a final catalogue consisting of a time series of 18 individual photometric measurements in two filters, plus mean magnitudes, for 400 000 stars over the entire ACS/WFC field of view.
There is clearly a very strong gradient in stellar density across our field of view, which increases towards the centre of M 32. This gradient leads to large variations in the crowding of the stellar images. We thus also performed artificial star tests to quantify the completeness of the photometric catalogue over the field of view. A mean completeness above 90% for the whole field is only found for stars with mF606W mag. For stars fainter than this, the completeness drops rapidly towards the centre of M 32, as the stellar density increases. This has to be carefully corrected before conclusions can be drawn about grandients across this field. We come back to this point in Section 5.
We also tested our photometric catalogue for evidence of differential reddening across the field using the well established method of Piotto et al. (1999). We divided our field into 64 26x26 arcsec2 regions and selected one of these as reference. Then for each sub-region we compared the CMD properties with the reference. No evidence for differential reddening was found, down to a limit of m mag, and thus we adopted a single reddening value of E(BV) = 0.08 mag (AF606W=0.21 mag, AF814W=0.13 mag, see Fiorentino et al., 2010b; Bedin et al., 2005), in our analysis.
2.2 Search for variability
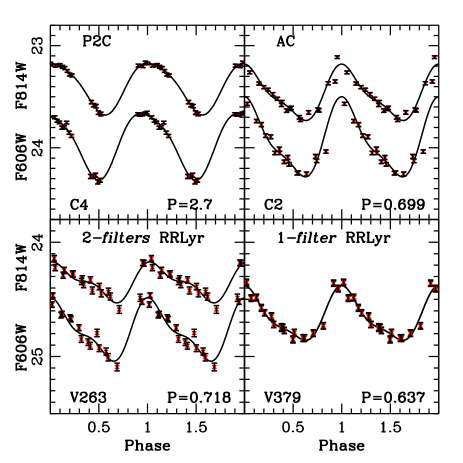
Details of the procedures to detect and classify variable stars are described in Fiorentino et al. (2010b). The average errors on the periods are 0.01 day, on the amplitudes of the variation are 0.1 mag and on the mean magnitudes are 0.1 mag. We identified 416 bona–fide RRLyr. We divided the RRLyr into two groups, two-filters (351 RRLyr) and one-filter (65 RRLyr). For two-filters candidates we were able to properly phase the F606W and F814W light curves. For the one-filter candidates we could estimate the period using only one filter (usually F606W). We identified also 4 Anomalous Cepheids (AC) and 3 Population II Cepheids (P2C), see Section 4. In Fig. 2 we show the light curves we have obtained for 2 RRLyr, 1 AC and 1 P2C. We have also detected 61 variable candidates which cannot be accurately classified, they include 27 possible RRLyr and 34 longer period variables.
We have recovered 9 of the 17 RRLyr ( 53 %) found in our previous study with ACS/HRC (Fiorentino et al., 2010b), confirming the low mean completeness ( 57 %) of the HB luminosity on the present ACS/WFC images so close to M 32.
3 The RRLyr variable stars
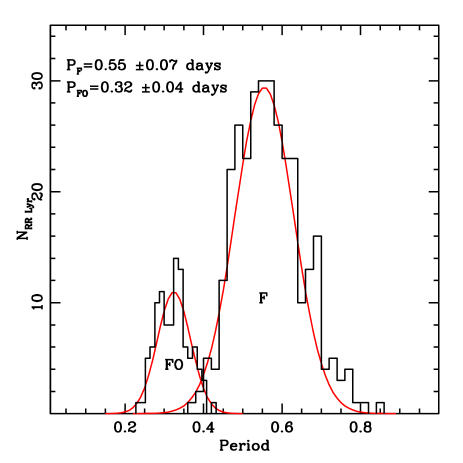
From the 416 bona fide RRLyr we have detected, we classify 314 as fundamental pulsators (F or RRab) and 102 firstovertone pulsators (FO or RRc). Table 2 lists the RRLyr along with their properties such as position, period, pulsation type classification, mean intensityweighted magnitudes, amplitudes and dereddened mean magnitudes transformed in the JohnsonCousin photometric system. The RR Lyrae have been named using their increasing distance from the centre of M 32.
The mean period distribution of the F pulsators matches a gaussian peaked at P0.55 days with days, see Fig. 3, which is consistent with Oosterhoff type I. Similarly, a mean period of P 0.32 days with 0.04 days is found for FO pulsators, which is also consistent with an Oosterhoff type I. The ratio between the number of FO and the total sample, NFO/NTOT 0.25. Our results are thus in agreement with the M 31 study performed by Sarajedini et al. (2009) of two ACS fields close to M 32. Other deep HST/ACS observations of RRLyr M 31 include six fields of the halo, disk, and giant stellar stream have been studied by Jeffery et al. (2011). The RRLyr of these fields appear to mostly be of Oosterhoff I type. Comparing our results with these six M 31 fields which sample different components of M 31, the properties of our sample resembles the giant stream of M 31, where they found =0.56 and NFO/NTOT=0.33.
| ID | Period | Type | m | AF606W | m | AF814W | m | m | ||
|---|---|---|---|---|---|---|---|---|---|---|
| V1 | 0:43:01.7183 | 40:52:33.583 | 0.306 | RRc | 25.080 | 0.379 | 24.799 | 0.209 | 24.910 | 24.661 |
| V2 | 0:43:01.8445 | 40:52:32.564 | 0.458 | RRab | 25.459 | 1.095 | 25.118 | 0.667 | 25.304 | 24.980 |
| V3 | 0:43:03.9260 | 40:52:29.779 | 0.406 | RRab | 24.983 | 0.522 | 24.627a | - | - | - |
| V4 | 0:42:50.5077 | 40:52:29.038 | 0.584 | RRab | 24.940 | 0.682 | 24.530 | 0.475 | 24.794 | 24.392 |
| V5 | 0:42:57.7187 | 40:52:28.670 | 0.310 | RRc | 25.422 | 0.460 | 25.082 | - | - | - |
| V6 | 0:42:51.6067 | 40:52:27.570 | 0.399 | RRc | 24.846 | 0.451 | 24.465 | 0.287 | 24.703 | 24.326 |
| V7 | 0:42:47.0945 | 40:52:27.376 | 0.690 | RRab | 25.182 | 1.073 | 24.151 | - | - | - |
a for onefilter RRLyr we have only one
mean magnitude, thus we can not estimate the corresponding amplitude
or Johnson-Cousin
magnitudes, we can only indicate the Dolphot mean magnitude.
3.1 Bailey diagram and metallicity
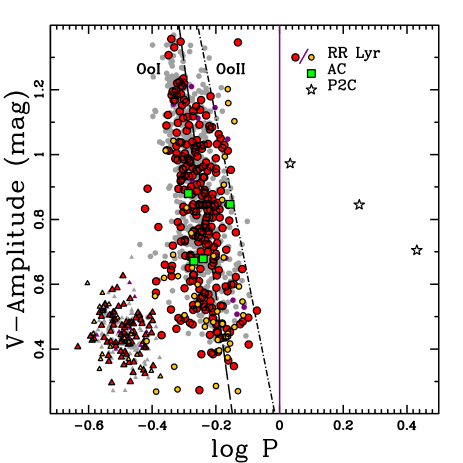
Fig. 4 shows the Bailey diagram of the variable stars detected in the present study overlaid on the M 31 studies of Sarajedini et al. (2009); Brown et al. (2004). This diagram divides into two regions, at log P=0, to distinguish the variable star types. At log P are the RRLyr and AC and at log P the P2C. The amplitudes have been transformed to Vfilter amplitudes (Brown et al., 2004) using AF606W=92 % AV to directly compare the Oosterhoff (Oo) type loci (see Clement, 2000, and references therein). In Fig. 4 we see that F RRLyr are predominantly consistent with an Oo type I, confirming the Oo classification based on the periods alone.
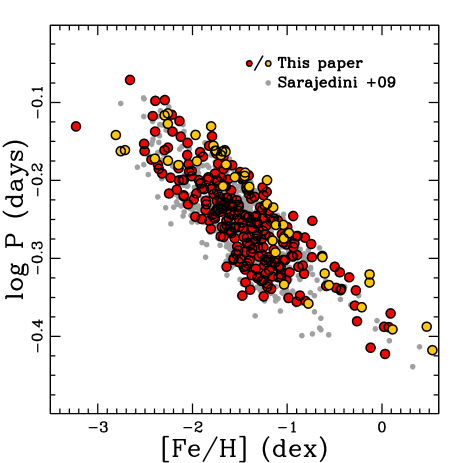
Next, we use this V amplitudeperiod relation (given by Alcock et al., 2000) to determine the individual metallicities of our entire sample of RRLyr. This is a method commonly used in the literature for RRLyr studies without colour information. We found a mean metallicity [Fe/H]=0.55 dex for our sample, comparable with what was found in M 31. Sarajedini et al. (2009) found [Fe/H] 0.45 for their F1 field (the closest to M 32) and [Fe/H] 0.43 for their F2. In Fig. 5 we show a comparison between individual metallicities for our sample and Sarajedini’s sample. We can see that our results are in very good agreement with their studies. We also notice that in our field, and also in the Sarajedini field closest to M 32, there are a few RRLyr of solar metallicity. This means that we observe more metalrich RRLyr than have been found in the halo, disk and giant stream of M 31 by Brown et al. (2004) and Jeffery et al. (2011), where using the same method, no RRLyr with metallicity larger than [Fe/H] dex have been found.
3.2 The Horizontal Branch
The Horizontal Branch (HB) is almost invisible in our CMD, because it is sparsely populated and dominated by contamination from other populations, such as an extensive and broad RGB and a young BP of stars in the main sequence region. The only way to reliably identify the HB is using RRLyr. In Fig. 6a we show the CMD of the Horizontal Branch region for our two-filters RRLyr, for which we have lightcurve weighted mean magnitudes and colours. The RRLyr define the HB and thus give us the opportunity to determine the mean distance modulus of the sample. To derive the distance modulus, we transformed mean mF606W and mF814W (columns 8 and 10 in Table 2) into JohnsonCousins mV and mI (columns 12 and 13 in Table 2). We thus obtained a dereddened V magnitude of the HB, = 24.95 0.18 mag. Then, assuming the average metallicity found above and using the M[Fe/H] relationship (Carretta et al., 2000), we obtain a distance modulus of 24.33 0.21 mag. The large uncertainty is due to both the large metallicity spread (see Fig. 5) and the large scatter on the HB ( mag), as seen in Fig. 6a.
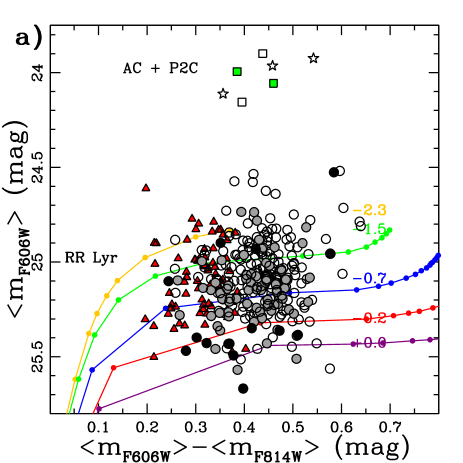
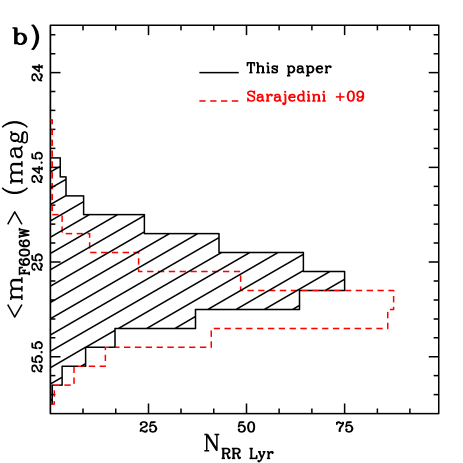
In Fig. 6b, we show the luminosity histogram of our two-filters RRLyr and we compare it with that for field F1 from Sarajedini et al. (2009). The peak of our luminosity distribution is brighter than Sarajedini’s by 0.16 mag. This could be due to the significantly different surface brightness of the two fields, which is 22 mag/arcsec2 in our field and 25 mag/arcsec2 in Sarajedini’s. A brighter surface brightness implies more severe blending effects that can lead to brighter magnitudes for individual stars (e.g., Fiorentino et al., 2010b). However, the broad spread we find in mF606W does not change using only the least blended222as defined by the DOLPHOT crowding parameter. RRLyr in our sample. This suggests that this spread is not likely to be caused by photometric errors. The spread could be due to either the RRLyr being at a range of different distances and/or having a large range in metallicity. Note that in both cases differences in the evolutionary states may affect the RRLyr luminosity, which would further increase the final HB luminosity range. In Fig. 6a we show the effect of a metallicity range using the theoretical HB tracks for a range of metallicity at the mean distance modulus derived above. The metallicity spread inferred for the RRLyr is consistent with the large range derived from the periods and amplitudes in Fig. 4. However this does not account for the whole HB spread. In addition, a distance spread is also very likely because the M 32 field is mixed with M 31 population. Assuming the mean metallicity found above and moving the relative zero age HB locus to fit the brightest and the faintest RRLyr in Fig. 6a, we find a distance modulus of 24.33 mag (or d = 734 Kpc).
To determine how many, if any, of the RRLyr in our sample are likely to be associated with M 32, we need to look at their radial distribution from the centre of M 32.
4 The Cepheid variable stars
. ID Period Type m AF606W m AF814W m m C1 0:42:47.8102 40:50:53.238 1.78 P2C 23.964 0.782 23.506 0.579 23.839 23.368 C2 0:42:56.4848 40:51:06.308 0.70 ACF 23.899 0.784 23.462 0.551 23.765 23.323 C3 0:42:57.9929 40:52:04.630 0.53 ACFO 23.995 0.622 23.610 0.421 23.853 23.471 C4 0:42:54.1987 40:49:53.248 2.70 P2C 23.925 0.652 23.382 0.506 23.835 23.244 C5 0:43:02.8871 40:50:43.142 1.08 P2C 24.112 0.900 23.756 0.627 23.962 23.618 C6 0:42:51.8780 40:49:07.727 0.57 ACFO 24.057 0.629 23.597 0.412 23.909 23.448 C7 0:43:02.5661 40:49:28.127 0.51 ACF 24.156 0.815 23.761 0.547 24.017 23.622
In our sample we have identified 7 variable stars (described in Table 3) with luminosities significantly higher than the HB, as shown in Fig. 6. These stars are at luminosities and colours consistent with both AC and P2C (Fiorentino et al., 2006; Di Criscienzo et al., 2007). The AC are core-He burning stars of intermediate age (16 Gyr old), with mass of 12M⊙, and they cover a period range from a few hours to 2 days. The P2C are lower mass stars (0.8M⊙) that just finished their coreHe burning phase and come from the blue HB. They are very old (10 Gyr) and typically have periods 1 day. Those with periods 3 days, are the socalled BL Hercules variable stars and they come from the warm part of the HB (e.g. Marconi et al., 2011).
The overlap in the period ranges of AC and P2C makes a proper distinction between them complicated. We have plotted them all in the Bailey diagram, see Fig. 4, where we see that three of them occupy the region with periods 1 day, and the remaining four lie on the RRLyr PeriodAmplitude relation. In Fig. 7 (lower panel) we plot the pulsation Instability Strip derived from theoretical models (Marconi et al., 2004) for AC, assuming the distance modulus derived in the previous section (=24.33). There is only one variable not within the instability strip, and this corresponds to the longest period, namely C4. To check that the Cepheids within the instability strip are genuine AC, we also use the colour information plotting them in the reddeningfree Wesenheit plane, i.e. WES(V, VI)=V2.54E(VI) see top panel of Fig. 7. In this plane the separation between these two classes of variables is very clear. The P2C follow a well established PeriodLuminosity relation, whereas the AC follow a more spread out PeriodLuminosity relation that depends on stellar mass. In Fig. 7 (top panel) we also show the theoretical Wesenheit relations (Fiorentino et al., 2007; Di Criscienzo et al., 2007) for both AC and P2C. Thus we can classify three Cepheids (C4, C6, C7) as P2C and the other four as AC (see Table 3).
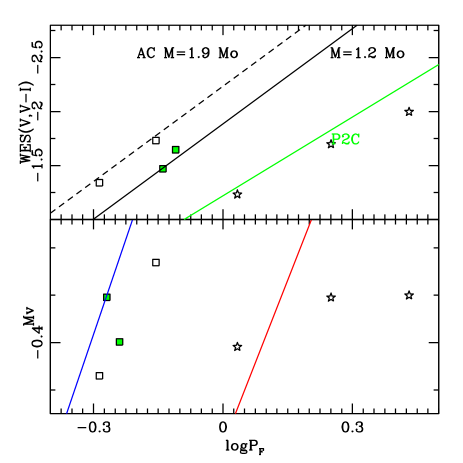
We can constrain the masses for the four AC, using our theoretical approach (extensively described in Marconi et al., 2004; Caputo et al., 2005; Fiorentino et al., 2006) which allow us to simultaneusly derive the mass and the pulsation mode of an AC using the pulsation properties. We use the well defined mass dependent PeriodMagnitudeAmplitude relation, which is valid only for F pulsator, and the PeriodMagnitudeColour relations which are available for both F and FO pulsators. Applying these relations to our four AC we classify two of them F pulsators and the remaining FO pulsators (see Table 3) with masses in the range 1.2 1.9 M⊙. Their masses indicate these stars come from a stellar population with ages between 1 and 4 Gyr old.
We notice that the distance modulus found from RRLyr agrees well with that from the P2C Wesenheit relation. The only point of concern is the low luminosity of the longest period P2C, C4. However mean luminosities and amplitudes could be affected by the small temporal coverage used to sample the full pulsation cycle for these relatively long period variable stars.
5 Radial distributions of Stellar Populations
The stellar populations of M 31 and M 32 are so similar and mixed, in our field, that the characteristics of M 32 can only be defined by looking for features that follow the strong concentration of stars towards the centre of M 32. This has to be done with extreme care, because the crowding properties of the images are also changing closer to the centre of M 32. We are mainly concerned to determine if there is a RRLyr population that can be reliably identified with M 32. To this end it is also useful to look at the radial distribution of other stellar populations that can be identified in our CMD.
In Fig. 8 we show the CMD for all the detected stars in our ACS/WFC field of view.
The two overplotted isochrones are 8 Gyr old, which is the mean age for the bulk of the stellar population (Monachesi et al., 2011).
To look for spatial gradients over our field towards the centre of
M 32, we select different stellar populations from the CMD, as
follows:
i) the bright BP, which are young 500 Myr
old main sequence stars;
ii) an intermediate BP, which includes a contribution from young main sequence
stars (1 Gyr old) and also the blue HB;
iii) the faint BP, which is made up of main
sequence stars 4 Gyr old;
iv) RRLyr;
v) the blue RGB, which is those stars with m24.9 mag
that lie on the RGB between the blue and the red isochrones
and they should be mostly old metalpoor stars (-2.7[Fe/H]-0.2), but could also
include younger ( Gyr old) metalrich stars ([Fe/H]-0.2);
vi) the red RGB, which is those stars with m24.9 mag
and on the red side of the red RGB and are all metalrich RGB stars.
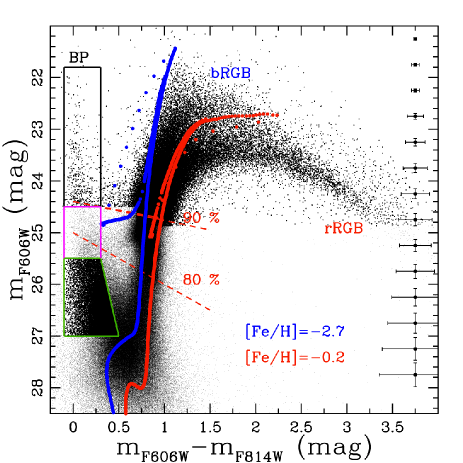
These populations have been chosen to trace different ages and metallicities in the CMD attempting to separate different contributions coming from M 31 and/or M 32. In fact, we do not expect that young stars with ages less than 0.5 Gyr belong to an elliptical galaxy such as M 32. On the other hand, we expect that the contribution to the metalrich component, as the red RGB, is mostly coming from M 32, being almost invisible in other accurate HST CMDs of the disk/halo components of M 31 (e.g. Brown et al., 2006, and reference therein).
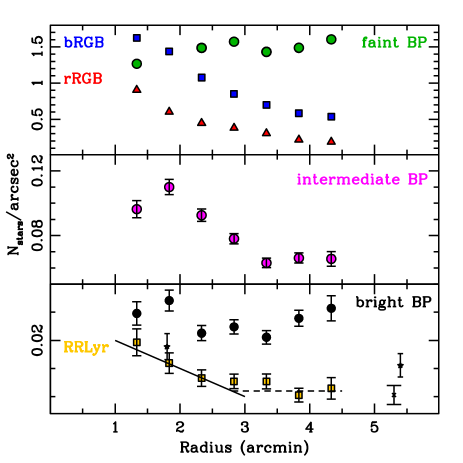
We expect that the completeness will vary along with the distance from the centre of M 32. For each selected population we have computed the completeness in annuli around M32, as defined in Fig 1. To account for the large colour baseline of our CMD, we computed the completeness for all the blue stars (VI less than 0.7 mag) and for all the red stars (VI larger than 0.7 mag) independently. As an example, at the luminosity of the RRLyr on the HB (m 25.07 mag) the mean completeness for RRLyr is 57% in the inner annulus (r 1.3 arcmin), whereas it increases to 85% in the outer annulus (r 4.3 arcmin).
In Fig. 9, we show the number of stars per arcsec2 of the selected stellar populations corrected for the completeness, as determined by artificial star tests. Four out of the six selected populations, i.e. the blue and red RGB, the intermediate BP and the RRLyr, increases going to the centre of M 32 defining the radial profile of the elliptical galaxy. On the contrary, the faint and bright BPs (top panel) show, if anything, a shallow opposite trend, suggesting an association to M 31. Stars so young are a clear feature of the M 31 field from other ACS/WFC studies, and this suggests that all the young stars observed in our field are likely associated to M 31. However, the number statistics are low and it has been suggested by Monachesi et al. (2011) that there is a BP component in M 32 (with ages 1 Gyr). We do not confirm this finding, however it could easily be hidden in the huge contamination from M 31. We note that, among the BP components only the intermediate BP, which includes also stars from the HB, increases going towards the centre of M 32 (middle panel in Fig. 9) then supporting the presence of the HB in M 32. If there were young stars in M 32 then also the other BP components should show the same signature, but they do not.
Finally, the RRLyr distribution found in the present study shows an increasing trend towards the centre of M 32 and confirms previous results (Alonso-García et al., 2004; Fiorentino et al., 2010b). In Fig. 9 we also showed the RRLyr detections found from Sarajedini et al. (2009) and Fiorentino et al. (2010b), which are in very good agreement with the RRLyr radial profile found in this paper. Our previous RRLyr detections, two points from Fiorentino et al. (2010b), were uncertain because of their large poissonian errors due to the very small FoV (3030 arcsec) of ACS/HRC. Our new detection of 416 RRLyr and their spatial variation over the 3.33.3′ ACS/WFC field of view is the strongest evidence obtained so far for an ancient population in M 32.
We also notice that the RRLyr distribution is quite flat going from outside to the centre of M 32 up to about 3 arcmin, suggesting that what we are observing for radii larger than 3 arcmin is a high background from M 31. Something similar can be seen also in the intermediate BP distribution supporting the idea of the strong M 31 background.
We can attempt an estimation of the fraction of the RRLyr that belong to M 32 by assuming that the RRLyr outside 3 arcmin from the centre of M 32 represent the M 31 background (Nstars/arcsec2=0.011, dashed line in Fig. 9). Then, we can fit a slope to the remaining observations ( 3 arcmin), Nstars/arcsec2=0.0250.005*r (solid line in Fig. 9). The total number of stars whithin 3 arcmin from the centre to M 32 is 327 RRLyr, which includes the background from M 31. Then we can estimate the number of RRLyr inside the 3 arcmin, subtracting the contribution expected from the background of M 31. At least 83 RRLyr could to be associated to M 32.
6 Conclusions
The radial density of RRLyr in our HST/WFC sample clearly increases towards the centre of M 32. This convincingly shows that we have identified an ancient stellar population of at least 83 RRLyr associated to M 32. These new RRLyr detections are in agreement with our previous results (Fiorentino et al., 2010b), which is actually a bit lucky given the statistics of the small field of view of HST/HRC.
The same trend towards the centre of M 32 is also followed by the other stellar components. Such as the blue and the red component of the RGB. This suggests that M 32 contains both a moderately metalpoor (-2.7[Fe/H]-0.2) and a metalrich ([Fe/H]-0.2) stellar population.
On the other hand, the bright and the faint blue plume of young main sequence stars ( 4 Gyr old) has a more smooth distribution suggesting that it is associated exclusively with the M 31 background. This result suggests that the 4 AC, with masses from 1.2 to 1.9 M⊙, found in our analysis are likely to be associated to M 31.
We find compelling evidence for a large spread in the metallicities of the RRLyr in our sample. They span -2.4[Fe/H]0 dex with a mean metallicity of [Fe/H] -1.440.55 dex.
The RRLyr in this study are classified as Oosterhoff type I, in agreement with recent results (Brown et al., 2004; Jeffery et al., 2011) for RRLyr observed in M 31. The properties of our RRLyr sample resemble those of the stream of M 31. This could suggest that M 32 could have contributed to the M 31 stream with its old stellar population, or that the stream dominates M 31 at the position of M 32.
Acknowledgments
We thank A. Dolphin and D. Weisz for their technical support running DOLPHOT on many WFC/ACS images simultaneously. We are grateful to A. Mucciarelli for his help in calculating the reddening map of our WFC/ACS field. We thank S. Cassisi, M. Di Criscienzo, G. Greco, M. Bellazzini and G. Bono for useful discussions. GF particularly thanks R. Merighi his technical support. The authors acknowledge an anonymous referee for his/her suggestions that improved the content and the readability of the manuscript. GF and ET have been supported by a NWOVICI grant and GF by the INAF fellowship 2009 grant. ET thanks the hospitality of Observatiore de la Côte d’Azur.
References
- Alcock et al. (2000) Alcock, C. et al. 2000, AJ, 119, 2194
- Alonso-García et al. (2004) Alonso-García, J., Mateo, M., & Worthey, G. 2004, AJ, 127, 868
- Bedin et al. (2005) Bedin, L. R., Cassisi, S., Castelli, F., et al. 2005, MNRAS, 357, 1038
- Brown et al. (2004) Brown, T. M., Ferguson, H. C., Smith, E., et al. 2004, AJ, 127, 2738
- Brown et al. (2006) Brown, T. M., Smith, E., Ferguson, H. C., et al. 2006, ApJ, 652, 323
- Caputo et al. (2005) Caputo, F., Bono, G., Fiorentino, G., Marconi, M., & Musella, I. 2005, ApJ, 629, 1021
- Carretta et al. (2000) Carretta, E., Gratton, R. G., Clementini, G., & Fusi Pecci, F. 2000, ApJ, 533, 215
- Clement (2000) Clement, C. M. 2000, in Astronomical Society of the Pacific Conference Series, Vol. 203, IAU Colloq. 176: The Impact of Large-Scale Surveys on Pulsating Star Research, ed. L. Szabados & D. Kurtz, 266
- Clementini et al. (2009) Clementini, G., Contreras, R., Federici, L., et al. 2009, ApJ, 704, L103
- Coelho et al. (2009) Coelho, P., Mendes de Oliveira, C., & Fernandes, R. C. 2009, MNRAS, 396, 624
- Di Criscienzo et al. (2007) Di Criscienzo, M., Caputo, F., Marconi, M., & Cassisi, S. 2007, A&A, 471, 893
- Dolphin (2000a) Dolphin, A. E. 2000a, PASP, 112, 1397
- Dolphin (2000b) Dolphin, A. E. 2000b, PASP, 112, 1383
- Dolphin et al. (2004) Dolphin, A. E., Saha, A., Olszewski, E. W., et al. 2004, AJ, 127, 875
- Fiorentino et al. (2010a) Fiorentino, G., Contreras Ramos, R., Clementini, G., et al. 2010a, ApJ, 711, 808
- Fiorentino et al. (2006) Fiorentino, G., Limongi, M., Caputo, F., & Marconi, M. 2006, A&A, 460, 155
- Fiorentino et al. (2007) Fiorentino, G., Marconi, M., Musella, I., & Caputo, F. 2007, A&A, 476, 863
- Fiorentino et al. (2010b) Fiorentino, G., Monachesi, A., Trager, S. C., et al. 2010b, ApJ, 708, 817
- Grillmair et al. (1996) Grillmair, C. J. et al. 1996, AJ, 112, 1975
- Jeffery et al. (2011) Jeffery, E. J., Smith, E., Brown, T. M., et al. 2011, AJ, 141, 171
- Marconi et al. (2011) Marconi, M., Bono, G., Caputo, F., et al. 2011, ApJ, 738, 111
- Marconi et al. (2004) Marconi, M., Fiorentino, G., & Caputo, F. 2004, A&A, 417, 1101
- Monachesi et al. (2011) Monachesi, A., Trager, S. C., Lauer, T. R., et al. 2011, ApJ, 727, 55
- Pietrinferni et al. (2004) Pietrinferni, A., Cassisi, S., Salaris, M., & Castelli, F. 2004, ApJ, 612, 168
- Piotto et al. (1999) Piotto, G., Zoccali, M., King, I. R., et al. 1999, AJ, 118, 1727
- Pritchet & van den Bergh (1987) Pritchet, C. J. & van den Bergh, S. 1987, ApJ, 316, 517
- Rejkuba et al. (2011) Rejkuba, M., Harris, W. E., Greggio, L., & Harris, G. L. H. 2011, A&A, 526, A123+
- Renzini (2006) Renzini, A. 2006, ARA&A, 44, 141
- Rose (1994) Rose, J. A. 1994, AJ, 107, 206
- Sarajedini et al. (2009) Sarajedini, A., Mancone, C. L., Lauer, T. R., et al. 2009, AJ, 138, 184
- Sirianni et al. (2005) Sirianni, M. et al. 2005, PASP, 117, 1049
- Trager et al. (2000) Trager, S. C., Faber, S. M., Worthey, G., & González, J. J. 2000, AJ, 119, 1645