Discovery of -ray emission from the Broad Line Radio Galaxy Pictor A
Abstract
We report the discovery of high-energy -ray emission from the Broad Line Radio Galaxy (BLRG) Pictor A with a significance of (TS), based on three years of observations with the Fermi Large Area Telescope (LAT) detector. The three-year averaged GeV -ray spectrum is adequately described by a power-law, with a photon index, , of and a resultant integrated flux of ph cm-2s-1.
A temporal investigation of the observed -ray flux, which binned the flux into year long intervals, reveals that the flux in the third year was 50% higher than the three-year average flux. This observation, coupled with the fact that this source was not detected in the first two years of Fermi-LAT observations, suggests variability on timescales of a year or less.
Synchrotron Self-Compton modelling of the spectral energy distribution of a prominent hot-spot in Pictor A’s western radio lobe is performed. It is found that the models in which the -ray emission originates within the lobes, predicts an X-ray flux larger than that observed. Given that the X-ray emission in the radio lobe hot-spots has been resolved with the current suite of X-ray detectors, we suggest that the -ray emission from Pictor A originates from within its jet, which is in agreement with other -ray loud BLRGs. This suggestion is consistent with the evidence that the -ray flux is variable on timescales of a year or less.
keywords:
galaxies: active – galaxies: Broad Line Radio Galaxies – galaxies: individual (Pictor A PKS 0518458) – galaxies: jets – gamma rays – radiation mechanisms: non thermal1 Introduction
The unified model of Active Galactic Nuclei (AGN) attributes the bright nucleus at the center of some galaxies to a super-massive black hole-accretion disk system surrounded by regions of broad line and narrow line gas clouds. Within this unified model, the difference between radio-loud (RL) and radio-quiet (RQ) AGN is explained by RL AGN possessing a relativistic jet emanating approximately perpendicular from the disk (Antonucci (1993); Urry & Padovani (1995)).
The early success of the unified AGN model was its ability to explain the observational characteristics of the different RL AGN sub-classes primarily by the size of the angle between the relativistic jet and the observer’s line of sight. However, while the unified model works well to first order, there is growing evidence that it is an oversimplification (e.g. Aharonian et al. (2007); Kharb et al. (2010)) and there are still several key fundamental questions that remain to be answered.
One of these questions is why relativistic jets only appear to be present in 10-20% of AGN. This question is often included in the broader issue of how accretion and ejecta are linked in AGN (e.g., Blandford & Znajek (1977); Blandford & Payne (1982); Sikora, Stawarz & Lasota (2007); McNamara et al. (2011)). To address this issue, the accretion disk-relativistic jet connection needs to be studied across a wide variety of RL AGN types. Broad Line Radio Galaxies (BLRGs) appear to be vital in such a study. With the line of sight orientated at an intermediate angle relative to the relativistic jet, BLRGs exhibit both jet-related and disk-related photon emission processes. BLRGs, therefore allow us to investigate how the processes of accretion (disk) and ejection (jet) relate to each other, and as such, represent a powerful diagnostic tool through which to understand this disk-jet connection111It should be noted that while the -ray emission processes of radio galaxy jets are thought to be somewhat different to those of blazars, BLRGs still allow us to investigate how the global jet emission is related to the accretion disk processes (Georganopoulos & Kazanas (2003); Ghisellini et al. (2005))..
The successful launch of the Fermi -ray Space Telescope affords us an ideal opportunity to investigate the accretion disk-jet connection in AGN. The ability of the Fermi-LAT detector to scan the entire -ray sky every three hours allows us to search for -ray emission from AGN unbiased by activity state or AGN sub-class. Recently, the two year LAT AGN catalogue has been released (2LAC), with the 2LAC clean sample consisting of 885 sources (Abdo et al. (2011a)). Of these sources, the vast majority are of the blazar sub-class, however there is a growing number of other AGN sub-classes, including radio galaxies and Narrow Line Seyfert 1 galaxies, detected as -ray sources (Abdo et al. (2009a); Abdo et al. (2009c); Abdo et al. (2009d); Abdo et al. (2009e); Kataoka et al. (2010); Foschini et al. (2011a); Foschini (2011b); Brown & Adams (2011)). This increase in the number of different AGN sub-classes detected as -ray sources is extremely important for the phenomenological studies required to investigate the connection between accretion and ejection.
To date, two BLRGs have been detected as -ray sources, 3C 120 and 3C 111 (Abdo et al. (2010b)). To investigate the connection between accretion and ejection in BLRGs, Kataoka et al. (2011) were recently able to successfully model the broad-band spectral energy distribution (SED) of both 3C 111 and 3C 120 with a combined model incorporating accretion disk emission, taken from Koratkar & Blaes (1999), and relativistic jet emission, taken from Soldi et al. (2008). Kataoka et al. also applied this combined disk-jet model to the two-year data set of a sample of 18 X-ray bright BLRGs. While this study did not reveal any new -ray emitting BLRGs, it did find that five of the BLRG sample have flux upper limits that were very close to the flux level predicted by the disk-jet model (Kataoka et al. (2011))222One of these 5 BLRGs was Pictor A, which hinted at -ray emission with a TS value of 20 from two years of observations.. Motivated by the proximity of the upper limits to the model prediction, we utlised a larger three-year Fermi data set to search for -ray emission from the most promising BLRG candidates. In total four BLRGs sources were studied. While three of these did not show significant -ray emission, our analysis revealed that Pictor A is a high-energy -ray source.
Pictor A (z=0.035, Eracleous & Halpern (2004); Liu & Zhang (2002)) is an archetypical Fanaroff-Riley II radio galaxy (FRII, Fanaroff & Riley (1974)), with the total radio emission dominated by the jet termination region observed as large radio lobes (e.g. Perley et al. (1997); Tingay et al. (2000)). From optical spectra, Pictor A is defined as a BLRG (Danziger et al. (1977)). Interestingly Pictor A’s host galaxy has recently been found to possess a disk-like morphology (Inskip et al. (2010)), indicating that Pictor A is hosted by a spiral galaxy, and thus is one of the rare examples against the AGN jet-ellipical host galaxy paradigm (see Foschini (2011b) for more details). Due to its close proximity, Pictor A affords us an excellent opportunity to study not only the disk-jet connection but also the termination shock environment of the radio lobes333Assuming a CDM cosmology and km s-1 Mpc-1 (Komatsu et al. (2009)), Pictor A has a luminosity distance of about 148 Mpc. At this distance 1 arcsecond corresponds to approximately 700 parsecs.. It is not surprising then that Pictor A has been extensively observed at many wavelengths.
Radio observations have found Pictor A to possess mildly relativistic jets containing subluminal moving components (Tingay et al. (2000)). Very Long Baseline Array (VLBA) observations have also shown complex radio structure within Pictor A’s radio lobes in the form of compact hot-spots (Tingay et al. (2008)). These remarkable hot-spots, along with the relativistic jet, have been studied with other observatories, including Spitzer, Hubble Space Telescope, XMM and Chandra (e.g. Thomson et al. (1995); Simkin et al. (1999); Wilson et al. (2001); Hardcastle & Croston (2005); Grandi et al. (2006); Migliori et al. (2007); Tingay et al. (2008); Malkan et al. (2011)). These observations have found structured magnetic fields within both the relativistic jet and radio lobe hot-spots. Synchrotron self-Compton (SSC) modelling of these broad-band observations predicts the possibility of -ray emission through inverse-Compton (IC) scattering of the synchrotron photons on the relativistic electrons. However the predicted flux level is somewhat lower than the current -ray upper limits from both the Fermi and HESS collaborations (Zhang et al. (2009); Kataoka et al. (2011); Aharonian et al. (2008)).
While Zhang et al. predicted -ray emission originating from the conditions in the radio lobe hot-spots, the high-energy emission from BLRGs is often attributed to the relativistic jet viewed at intermediate angles (Grandi & Palumbo (2007); Sambruna et al. (2009)). The question then arises as to whether the Pictor A -ray emission, that we have discovered, is associated with the radio lobe hot-spots or with the relativistic jet. To address this question we perform SED modelling of a prominent hot-spot in the western radio lobe of Pictor A using archival data at other photon energies. We take two approaches. In our first approach we tune the various parameters available in the SSC model so as to best fit the SED of the radio to optical data and the -ray data. We find that it is not possible to simultaneously fit these photon energy bands as well as the X-ray data with the X-ray flux over-predicted compared to observations. We then take the alternative approach of optimising the fit of the radio to optical data and the X-ray data. We find a good fit to this data but the predicted flux at -ray energies is significantly below the flux that we have observed from Pictor A. This suggests that if the -ray emission is SSC in origin, it is not produced in the radio lobe hot-spot region where the other wavelength photons are observed to originate.
The paper outline is as follows: In §2 we describe the Fermi-LAT observations and data analysis routines used in this study. Pictor A’s -ray characteristics are given in §3. In §4 we present our broad-band spectral energy distribution modelling using archival data at other photon energies, with the discussions on the spectral energy distribution modelling given in §5. The conclusions are given in §6. Throughout this paper, a cold dark matter (CDM) cosmology was adopted, with a Hubble constant of H km s-1 Mpc-1, and as derived from Wilkinson Microwave Anisotropy Probe results (Komatsu et al. (2009)).
2 Fermi-LAT observations and Data Analysis
The LAT detector aboard Fermi, described in detail by Atwood et al. (2009), is a pair-conversion telescope, sensitive to a photon energy range from below 20 MeV to above 300 GeV. With a large field of view, sr, improved angular resolution, ∘ at 1 GeV444Below 10 GeV photon energy, the 68% containment angle of the photon direction is approximately given by ∘(GeV)-0.8, with the 95% containment angle being less than 1.6 times the angle for 68% containment., and large effective area, cm2 on axis at 10 GeV, Fermi-LAT provides an order of magnitude improvement in performance compared to its EGRET predecessor.
Since 2008 August 4, the vast majority of data taken by Fermi has been performed in all-sky-survey mode, whereby the Fermi-LAT detector points away from the Earth and rocks north and south of its orbital plane. This rocking motion, coupled with Fermi-LAT’s large effective area, allows Fermi to scan the entire -ray sky every two orbits, or approximately every three hours (Ritz (2007)).
The data used in this analysis comprises of all all-sky-survey observations taken during the first three years of Fermi operation, between 2008 August 4 and 2011 August 8, equating to a mission elapse time (MET) interval of 239557417 to 334486765. In accordance with the PASS 7 criteria, a zenith cut of 100∘ along with a rock-angle cut of 52∘ was applied to the data to remove any cosmic ray induced secondary -rays from the Earth’s atmosphere. All ‘source’ class events555‘Source’ class events equates to EVENT_CLASS2 in the PASS 7 data set. Source class events optimise the -ray detection efficiency as a function of residual charged-particle contamination and is best suited for localised sources as opposed to transient or diffuse sources. within a 6∘ radius of interest (ROI) were considered in the GeV energy range, with the lower energy cut being conservative to reduce the systematic errors.
Throughout this analysis, the most recent Fermi-LAT Science Tools, version v9r23p1, were used in conjunction with instrument response functions P7SOURCE_V6. Furthermore, the most recent galactic, gal_2yearp7v6_v0.fits, and extragalactic, iso_p7v6source.txt, diffuse models were utilised during spectral fitting and upper limit calculations.
3 -ray characteristics
To investigate the -ray properties of Pictor A, we utilized the unbinned maximum likelihood estimator of the Fermi-LAT Science Tools’ GTLIKE routine. GTLIKE allows us to fit the data with a series of both point and diffuse sources of -rays. The model used to calculate the likelihood of -ray emission from Pictor A was a combination of the most recent galactic and extragalactic diffuse models, as given in §2, and all point sources within an 8∘ radius region of interest (ROI) centered on Pictor A. Each point source was modelled with a power-law spectrum of the form A with both parameters, photon index, , and normalisation, A, free to vary. The co-ordinates for each point source within the ROI were taken from the 2nd Fermi-LAT Catalogue (2FGL; Abdo et al. (2011a)). In addition, a 10∘ radius sky map of the three year data set was used to search for any other sources in the ROI that were not present in the 2FGL.
As a further check, the spatial distribution of the test statistic666The test statistic, TS, is defined as twice the difference between the log-likelihood of two different models, , where and are defined as the likelihood when the source is included or not respectively (Mattox et al. (1996)). values obtained from the GTLIKE fit was also utilised to identify any other possible sources in the ROI that were not present in the 2FGL. The TS distribution indicated the presence of two TS peaks within 1∘ of Pictor A. One of these peaks has a TS value of and is spatially coincident with the blazar BZQ J05154556. Indeed, BZQ J05154556 is present in the 2FGL and therefore was already included in the model file.
The other TS peak is separated from Pictor A by ∘, located at the position (, ∘, ∘). With a TS value of , or , this TS peak suggests the presence of another -ray source which is not in either the 1FGL or 2FGL catalogues. However given that the TS value is below the detection threshold of 25, this emission is not yet significant enough to be formally classified as a -ray source.
Another Fermi-LAT Science Tool, GTFINDSRC, was applied to the 8∘ ROI around Pictor A to localise the origin of the -ray emission. Using the same combined diffuse and point source model that was applied during the GTLIKE routine, the -ray emission that is associated with Pictor A is located at (, ∘, ∘), with a 95% error radius of 0.08∘. The GTFINDSRC routine was also able to identify and localise the emission from both BZQ J05154556 and the other TS ‘hot-spot’ as two -ray sources separate from Pictor A.
Once satisfied that all point sources within an 8∘ ROI have been accounted for, we applied GTLIKE to the three-year data set. With the combined diffuse and 8∘ ROI point source model, we obtain the following best-fit power-law function for Pictor A:
| (1) |
which equates to an integrated flux, in the GeV energy range, of
| (2) |
only taking statistical errors into account. Primarily governed by the uncertainty in the effective area, the systematic uncertainty of the integrated flux is energy dependent and is currently estimated as 10% at 100 MeV, down to 5% at 560 MeV and back to 10% for 10 GeV photons (Abdo et al. (2011b)).
From the power-law fit, the predicted -ray count was 337, with a test statistic of , corresponding to a detection. Compared to other -ray BLRGs, 3C 120 and 3C 111, Pictor A’s -ray flux is a factor of six lower, and the spectral index is comparable, with a spectral index of for Pictor A compared to for 3C 120 and for 3C 111. On the other hand, the -ray luminosity for Pictor A is comparable to both 3C 120 and 3C 111, log() ergs s-1 compared to 43.6 ergs s-1 and 43.9 ergs s-1 respectively (Kataoka et al. (2011)).
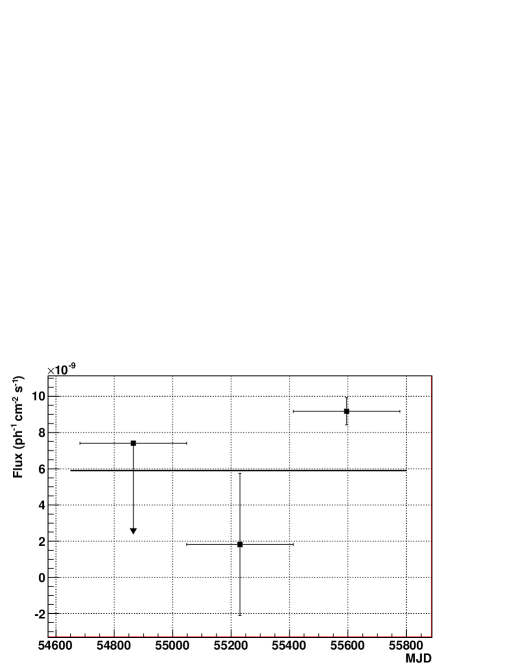
To investigate the possibility of temporal variability in Pictor A’s -ray flux, the three-year data set was binned into one year periods and analysed separately with GTLIKE. As with the spectral analysis, only GeV events were considered, with the appropriate quality cuts applied, and the same combined diffuse and 8∘ ROI point source model was used. Only the fluxes of temporal bins with TS () were plotted, with the 95% confidence upper limit being calculated for the remaining temporal bin. The resultant light curve can be seen in Figure 1, with the bold horizontal line indicating the three-year averaged GeV flux level.
A closer inspection of the individual photon energies reveals that the highest photon energy detected from Pictor A during this three year data set has an energy of 109.8 GeV. Additionally, photons with energies of 99.7 and 91.3 GeV were also detected, both within 0.8∘ of Pictor A. The spatial distribution of these highest energy photon events was compared to the sky map to confirm that none were spatially coincident with either BZQ J05154556 or the TS peak. Taking the approach outlined in Neronov et al. (2010), the chance probability of the second highest photon being clustered within 1∘ of the highest photon is . That is to say, the chance probability that these two photon events are not clustered background events is %. This value is and therefore the observed ‘clustering’ of GeV photons around Pictor A is not statistically significant. It is worth noting that a GTLIKE likelihood analysis for all very high energy (VHE) -ray events, GeV, from Pictor A, utilising the same combined diffuse and 8∘ ROI point source model, finds a comparable statistical significance to Pictor A being a VHE -ray source, with a TS value of 4.99 or .
4 Spectral energy distribution modelling
We now turn to the question of whether the observed -ray emission is associated with the hot-spots in the terminal shocks of the radio lobes or with the relativistic jet. Fermi-LAT has resolved -ray emission from the radio lobes of the low-power radio galaxy, Centaurus A (Abdo et al. (2010a)). However, beyond Centaurus A, further evidence for -ray emission from AGN radio lobes is scarce.
As mentioned in §1, leptonic models which predict -ray emission from the radio lobe hot-spots attribute the observed radio-UV emission to synchrotron radiation, primarily due to the observation of polarised radiation from the hot-spots at these wavelengths (eg. Roeser & Meisenheimer (1987); Harris et al. (1998)). Given the synchrotron origin of this radiation, the shape of the SED at radio to UV wavelengths places strong restrictions on the broken power-law energy distribution of the electron population within the hot-spot. The -ray emission, in such a model, is a result of the IC process acting on a percentage of the synchrotron photons.
Due to the close proximity of Pictor A, radio lobe hot-spot features have been individually resolved at X-ray, optical, infrared and radio wavelengths777The angular resolution of Fermi does not allow us to resolve Pictor A’s radio lobes and nucleus regions separately.. These observations have discovered several bright knots within Pictor A’s radio lobe, with the Western hot-spot (WHS) being the most prominent and thus most extensively studied. SSC modelling of the WHS spectral energy distribution (SED) has already been performed by Zhang et al. (2009), who predicted a GeV -ray flux level on the order of ergs cm. This prediction is somewhat higher than the three-year averaged flux that we have determined in the previous section.
Given there are a number of tuneable parameters available in the SSC model we performed SSC modelling to determine the consistancy of the observed -ray flux being produced through IC in the radio lobe hot-spots. The SED was constructed using historical radio, infra-red, optical and X-ray observations that have reported flux measurements from the WHS alone (Meisenheimer et al. (1997); Tingay et al. (2008); Migliori et al. (2007)). We also included the VHE -ray upper limit set by the HESS collaboration (Aharonian et al. (2008)). The SSC model assumed a spherical emission region of radius , moving with Doppler factor and filled with a random magnetic field of strength and an electron population described by a broken power-law (for more details, see Krawczynski et al. (2004)). The radius of the emission region was fixed to the physical size of the WHS, pc, as observed with the Hubble Space Telescope (Thomson et al. (1995)) and the Doppler factor, , was fixed to 1 thus removing any doopler boosting effects.

In our first approach, the SSC fit to the WHS SED, shown in Figure 2, was originally optimised to account for the synchrotron radiation distribution, whilst accurately modelling our Fermi-LAT observations. The WHS SED was found to be best described by an electron distribution of eV, eV and eV, with broken power-law indices of and below and above the break energy respectively. To reproduce the relative synchrotron and inverse Compton peak flux levels, a magnetic field of Gauss and an electron energy density of ergs cm-3 was required. The resultant SSC fit can be seen in Figure 2 with the solid line representing the synchrotron spectrum and the dashed line representing the IC spectrum.
As can be seen in Figure 2, while the best fit SSC model adequately describes the radio-optical and Fermi fluxes, it over-predicts the inverse Compton flux at X-ray energies by an order of magnitude. It is worth noting at this point, that while smaller, this discrepancy is also present if the entire Western radio lobe’s X-ray flux is included in the SED (Migliori et al. (2007)).
To address the over-prediction of the X-ray flux, both the magnetic field strength and electron population’s energy distribution were varied, optimising the fit for the synchrotron radiation distribution, whilst accurately modelling the X-ray observations. The best fit for the X-ray data was described an electron distribution of eV, eV and eV, with broken power-law indices of and , a magnetic field of Gauss and an electron energy density of ergs cm-3. It should be noted that a slight change in the break and maximum energies of the electron population were required so as to not over predict the flux of the high energy synchrotron emission. The resultant ‘X-ray’ fit can be seen in Figure 3. The fit parameters for Figure 2 and Figure 3 are shown in Table 1, along with the fit parameters for Zhang et al.’s modelling of Pictor A’s WHS and the Fermi-LAT Collaboration’s modelling of Cen A’s core and radio lobes.

| Pic A (X-ray fit) | Pic A (Fermi fit) | Pic A (Zhang et al.) | Cen Acore | Cen Alobe | |
| Magnetic field (G) | 6.2 | ||||
| Doppler factor () | 1 | 1 | 1 | 1 | |
| volume (pc3) | |||||
| 2.4 | 2.4 | 2.38 | 1.8 | 2.1 | |
| 4.4 | 4.4 | 3.9 | 4.3 | 3.0 | |
| 196 | 196 | 300 | 1 | ||
| 800 | |||||
5 Discussion
In both Figure 2 and Figure 3, the radio to optical emission can be seen to be accurately described by the process of synchrotron radiation. It is not, however, possible to simultaneously describe the X-ray and -ray fluxes by the IC component of the one-zone SSC model. Therefore, our SED modeling provides support for the synchrotron origin of the low energy emission of the WHS of Pictor A. However, assuming that the SSC model is the dominant mechanism for the observed X-ray flux from the WHS, then our SED modelling suggests that Pictor A’s observed -ray emission is either produced through processes other than SSC, or that the -ray originates from either Pictor A’s relativistic jet or central core region.
Other possible mechanisms through which the -rays can be emitted include the external-Compton (EC) model or hadronic models invoking photon-proton or proton-proton interactions. Similiar to the SSC model, the EC model simply has an external photon field, such as the Cosmic Microwave Background (CMB), as the dominant photon field on which the inverse-Compton process acts. It is worth noting that Migliori et al. attributed the X-ray emission from the WHS to the EC of the CMB (Migliori et al. (2007)), however more recently Zhang et al. found the EC contribution from the CMB to be negligible (Zhang et al. (2009)). While we have not considered EC during our SSC modelling of Pictor A’s WHS, doing so would simply allow us to relax the energetic requirements of the electron population in the hot-spot.
In depth hadronic interpretation of the Fermi-LAT observations is outside the scope of this paper. Nonetheless, we do note that neutrino telescopes, such as ANTARES and IceCube, have the potential to constrain the hadronic contribution to Pictor A’s observed -ray flux (e.g. Becker et al. (2007)); Abbasi et al. (2011); Abbasi et al. (2012); Adrian-Martinez et al. (2011)).
However, it seems more likely that the reason why our SED modelling was unable to marry the WHS observations with the observed -ray flux is that the -ray emission is of jet origin. As mentioned in §1, -ray emission from BLRGs is traditionally interpreted as originating from a relativistic jet viewed at intermediate angles from the line of sight (e.g. Grandi & Palumbo (2007); Sambruna et al. (2009); Kataoka et al. (2011)). Flux variability is a fundamental property of astrophysical jets. Indeed, evidence for variability in Pictor A’s jet has been observed with Chandra which has observed the X-ray flux from Pictor A’s western jet to vary on timescales of years (Marshall et al. (2010)). Evidence for variability in Pictor A’s -ray flux can be seen in Figure 1, which hints at -ray flux variability on timescales of a year or less. This evidence is primarily seen in the third year of observations, with a detection of Pictor A and a flux level that is 50% larger than the 3 year average888It is also worth noting that the flux in the third year is approximately 30% larger than the 95% flux upper limit set in the first year of observations. Furthermore, the 3 flux in the second year, is over five times smaller than the flux observed in the third year of observations..Taking into consideration statistical errors, the difference between the third year and three-year averaged flux levels is significant at the level. However, this is just short of the level, and as such, further Fermi-LAT observations are need to confirm this observational characteristic.
At this point, we briefly turn our attention to other possible locations for the -ray emission, namely the core region of Pictor A within the immediate vicinity of the super-massive black hole (SMBH). Magnetospheric emission models of AGN core regions have been successful invoked to explain the -ray emission from other radio galaxies such as M87 (e.g. Rieger & Aharonian (2008)). However, as highlighted in Brown & Adams (2011), for these models is expected, where is the IC luminosity, which in this case is the -ray luminosity and is the SMBH mass. Given that Pictor A’s SMBH mass is an order of magnitude larger then Cen A’s, whilst the -ray flux is two orders of magnitude smaller, we find it unlikely that a magnetospheric emission model significantly contributes to the observed -ray emission and suggest that the observed -ray emission from Pictor A is indeed of jet origin.
Therefore, given that Chandra has resolved X-ray emission from the WHS, the SSC fit of Figure 3 indicates that the observed -ray flux cannot be attributed to an SSC processes within the hot-spots of Pictor A’s radio lobes. This conclusion, coupled with the evidence of variability observed in Figure 1, suggest that the -ray emission from Pictor A originates from within its jet, in agreement with the SED modelling of other -ray loud BLRGs.
6 Conclusions
We have reported the discovery of Pictor A as a -ray source with a significance of , utilising the first three years of observations with the Fermi-LAT detector. These observations have found the GeV spectrum to be well described by a power-law with , which is comparable to the other Fermi-LAT detected BLRGs, 3C 120 and 3C 111. Pictor A’s three-year averaged GeV flux is , which equates to a -ray luminosity of log() ergs s-1. Pictor A’s -ray flux was thus found to be approximately six times smaller than 3C 120 and 3C 111, but due to its close proximity, a luminosity that is comparable with other -ray loud BLRGs.
Pictor A’s year-binned light curve suggested variability in the -ray flux, with the third year flux level being 50% larger than the three year average. However, further observations are needed to confirm this observational property.
SSC modelling of the WHS SED found that it was only possible to account for the -ray emission with an SSC model at the expense of greatly over-predicting the flux at X-ray energies. Given that the X-ray emission in the WHS has been resolved with the current suite of X-ray detectors, we suggest that the -ray emission from Pictor A originates from within its jet, in agreement with other BLRGs detected with Fermi. This suggestion agrees well with the evidence that the -ray flux is variable on timescales of a year or less.
The highest energy photon detected during this 3 year period was 109.8 GeV, with several 90 GeV photons also being observed. A likelihood analysis of the GeV -ray events does not find any significant VHE emission. While the clustering of the highest energy events does not appear to be significant, it raises the interesting possibility of VHE -ray emission from Pictor A.
Acknowledgments
This work is supported by the Marsden Fund Council from New Zealand Government funding, administered by the Royal Society of New Zealand. The authors would like to thank the referee, Luigi Foschini, for his useful suggestions that helped improve this manuscript. The authors would also like to thank Gianfranco Brunetti and Steven Tingay for providing the radio-optical SED data used in Figures 2 & 3. This work has made use of public Fermi data obtained from the High Energy Astrophysics Science Archive Research Center (HEASARC), provided by NASA’s Goddard Space Flight Center. This work has also made use of the NASA/IPAC Extragalactic Database (NED), which is operated by the Jet Propulsion Laboratory, Caltech, under contact with the National Aeronautics and Space Administration, as well as SAO/NASA’s Astrophysics Data System (ADS), hosted by the High Energy Astrophysics Division at the Harvard-Smithsonian Center for Astrophysics.
References
- Abbasi et al. (2011) Abbasi, R., et al. (IceCube Collaboration), 2011, ApJ, 732, 18A
- Abbasi et al. (2012) Abbasi, R., et al. (IceCube Collaboration), 2012, ApJ, 744, 1A
- Abdo et al. (2009a) Abdo, A.A., et al. (Fermi-LAT Collaboration), 2009a, ApJ, 700, 597
- Abdo et al. (2009b) Abdo, A.A., et al. (Fermi-LAT Collaboration), 2009b, ApJS, 183, 46
- Abdo et al. (2009c) Abdo, A.A., et al. (Fermi-LAT Collaboration), 2009c, ApJ, 707, 55
- Abdo et al. (2009d) Abdo, A.A., et al. (Fermi-LAT Collaboration), 2009d, ApJ, 699, 976
- Abdo et al. (2009e) Abdo, A.A., et al. (Fermi-LAT Collaboration), 2009e, ApJ, 707, L142
- Abdo et al. (2010a) Abdo, A.A., et al. (Fermi-LAT Collaboration), 2010a, ApJ, 719, 1433
- Abdo et al. (2010b) Abdo, A.A., et al. (Fermi-LAT Collaboration), 2010b, ApJ, 720, 912
- Abdo et al. (2010c) Abdo, A.A., et al. (Fermi-LAT Collaboration), 2010c, Science, 328, 725
- Abdo et al. (2011a) Abdo, A.A., et al. (Fermi-LAT Collaboration), 2011a, ApJ, 743, 171A
- Abdo et al. (2011b) Abdo, A.A., et al. (Fermi-LAT Collaboration), 2011b, submitted to ApJ, preprint arXiv:1108.1435T
- Adrian-Martinez et al. (2011) Adrian-Martinez, S., et al. (ANTARES Collaboration), 2011, ApJ, 743, 14A
- Aharonian et al. (2007) Aharonian, F. (HESS Collaboration), et al., 2007, ApJ, 664, 71A
- Aharonian et al. (2008) Aharonian, F. (HESS Collaboration), et al., 2008, A&A, 478, 387
- Antonucci (1993) Antonucci, R., 1993, ARA&A, 31, 473
- Atwood et al. (2009) Atwood, W.B., et al., 2009, ApJ, 697, 1071
- Becker et al. (2007) Becker, J.K., Gross, A., Munich, K., Dreyer, J., Rhode, W. & Biermann, P.L., 2007, Astropart. Phys., 28, 98
- Blandford & Znajek (1977) Blandford, R.D. & Znajek, R.L., 1977, MNRAS, 179, 433
- Blandford & Payne (1982) Blandford, R.D. & Payne, D.G., 1982, MNRAS, 199, 883
- Brown & Adams (2011) Brown, A.M., & Adams, J., 2011, MNRAS, 413, 2785B
- Burke-Spolaor et al. (2009) Burke-Spolaor, S., Ekers, R.D., Massardi, M., Murphy, T., Partridge, B., Ricci, R. & Sadler, E.M., 2009, MNRAS, 395, 504
- Danziger et al. (1977) Danziger, I.J., Fosbury, R.A.E & Penston, M.V., 1977, MNRAS, 179, 41
- Eracleous & Halpern (2004) Eracleous, M. & Halpern, J. P., 2004, ApJS, 150, 181
- Fanaroff & Riley (1974) Fanaroff, B.L., & Riley, J.M., 1974, MNRAS, 167, 31P
- Foschini et al. (2011a) Foschini, L. et al., 2011, MNRAS, 413, 1671
- Foschini (2011b) Foschini, L., 2011, Proceedings of Science NLS1, 024, preprint arXiv:1105.00772
- Georganopoulos & Kazanas (2003) Georganopoulos, M. & Kazanas, D., 2003, ApJ, 589, 5
- Ghisellini et al. (2005) Ghisellini, G., Tavecchio, F., & Chiaberge, M., 2005, A&A, 432, 401
- Grandi et al. (2006) Grandi, P., Malaguti, G., & Fiocchi, M., 2006, ApJ, 642, 113
- Grandi & Palumbo (2007) Grandi, P., & Palumbo, G.G.C., 2007, ApJ, 659, 235
- Hardcastle & Croston (2005) Hardcastle, M.J., & Croston, J.H., 2005, MNRAS, 363, 649
- Harris et al. (1998) Harris, D.E., Leighly, K.M., & Leahy, J.P., 1998, ApJ, 499, 149
- Inskip et al. (2010) Inskip, K.J., Tadhunter, C.N, Morganti, R., Holt, J., Ramos Almeida, A., & Dicken, D., 2010, MNRAS, 407, 1739
- Kataoka et al. (2010) Kataoka, J. et al., 2010, ApJ, 715, 554
- Kataoka et al. (2011) Kataoka, J. et al., 2011, ApJ, 740, 29
- Kharb et al. (2010) Kharb, P., Lister, M.L., & Cooper, N.J., et al., 2010, ApJ, 710, 764K
- Komatsu et al. (2009) Komatsu, E., et al., 2009, ApJS, 180, 330
- Koratkar & Blaes (1999) Koratkar, A., & Blaes, O., 1999, PASP, 111, 1
- Krawczynski et al. (2004) Krawczynski, H., Hughes, S. B., Horan, D., et al., 2004, ApJ, 601, 151
- Liu & Zhang (2002) Lui, F.K., & Zhang, Y.H., 2002, A&A, 381, 757L
- Malkan et al. (2011) Malkan, M.A., Gorjian, V., & Tam, R., 1998, ApJS, 117, 25
- Marshall et al. (2010) Marshall H.L., et al., 2010, ApJ, 714, 213
- Mattox et al. (1996) Mattox J.R., et al., 1996, ApJ, 461, 396
- McNamara et al. (2011) McNamara, B. R., Rohanizadegan, Mina, & Nulsen, P. E. J., 2011, ApJ, 727, 39M
- Meisenheimer et al. (1997) Meisenheimer, K., Yates, M.G, & Roeser, H.-J., 1997, A&A, 325, 57
- Migliori et al. (2007) Migliori, G, Grandi, P., Palumbo, G.G.C., Brunetti, G. & Stanghellini, C., 2007, ApJ, 668, 203
- Neronov et al. (2010) Neronov, A., Semikoz, D., & Vovk, Ie., 2010, A&A, 519, 6
- Perley et al. (1997) Perley, R.A., Roeser, H.J., & Meisenheimer, K., 1997, A&A, 328, 12
- Rieger & Aharonian (2008) Rieger, F.M. & Aharonian, F.A, 2008, A&A, 479, L5
- Ritz (2007) Ritz, S., 2007, Overview of GLAST Mission and Opportunities, Vol. 921 (AIP), 3-7
- Roeser & Meisenheimer (1987) Roeser, H. & Meisenheimer, K., 1987, ApJ, 314, 70
- Sambruna et al. (2009) Sambruna, R.M., et al., 2009, ApJ, 700, 1473
- Sikora, Stawarz & Lasota (2007) Sikora, M., Stawarz, L. & Lasota, J-P., 2007, ApJ, 658, 815
- Simkin et al. (1999) Simkin, S.M., Sadler, E.M., Sault, R., Tingay, S.J. & Callcut, J., 1999, ApJS, 123, 447
- Soldi et al. (2008) Soldi, S., et al., 2008, A&A, 486, 411
- Thomson et al. (1995) Thomson, R.C., Crane, P. & Mackay, C.D, 1995, ApJ, 446L, 93T
- Tingay et al. (2000) Tingay, S.J., et al., 2000, AJ, 119, 1695
- Tingay et al. (2008) Tingay, S.J., Lenc, E., Brunetti, G. & Bondi, M., 2008, ApJ, 136, 2473
- Urry & Padovani (1995) Urry, C.M. & Padovani, P., 1995, PASP, 54, 215
- Wilson et al. (2001) Wilson, A.S., Young, A.J. & Shopbell, P.L., 2001, ApJ, 547, 740
- Zhang et al. (2009) Zhang, J., Bai, J.M., Chen, L. & Yang, X., 2009, ApJ, 701, 423