QCD Critical Point: Synergy of Lattice & Experiments††thanks: Plenary talk at the Strangeness in Quark Matter, 2011, Krakow, Poland.
Abstract
The freeze-out curve, which describes a vast amount of precise experimental data in heavy ion collisions, provides a relation between the colliding energy and the thermodynamical parameters of the fireball. The variance, skew and kurtosis of the event distribution of baryon number are studied at several energies of interest through Padé resummations of our Lattice QCD results. A smooth behaviour is predicted for three ratios of these quantities at current RHIC and future LHC energies. Any deviations from these at the RHIC energy scan would signal the presence of a nearby critical point. Our lattice results on the critical point do show such a behaviour.
12.38.Gc, 11.35.Ha, 05.70.Jk
1 Introduction
Critical points in a phase diagram in the temperature-density plane are special for many reasons. Universality of critical indices, diverging correlation length are some of them. For common substances, such as water or carbon dioxide, the existence of critical point has been established experimentally, with its location known rather precisely. For many of these, however, getting a theoretical, especially first principles based, computation of their locations turned out to be illusive still. I wish to describe to you how things are different for strongly interacting matter, which is naturally described by Quantum Chromo Dynamics (QCD) and has an inherently higher energy scale. Whether the QCD phase diagram has a critical point in its - plane, where is the baryonic chemical potential, is therefore a tougher question to address experimentally. Thanks to the impressive developments on the experimental fronts, the Relativistic Heavy Ion Collider (RHIC) at BNL, New York, and the upcoming facilities such as FAIR at GSI, Darmstadt and NICA at Dubna, Russia can potentially search for it, as these proceedings reveal.
A variety of models have been successfully tested for hadronic interactions. These were was also the first set of tools used for getting a glimpse of the QCD phase diagram. For instance, using an effective chiral Nambu-Jana Lasinio type model, a phase diagram was obtained, which suggests [1] a critical point to exist in a world with two light quarks and one heavier quark. One would clearly like to have an ab initio theoretical evidence for it. This turns out to be difficult as one usually has to deal with large coupling constants in the world of (low energy) hadronic interactions. Non-perturbative Lattice QCD, defined on a discrete space-time lattice, has proved itself to be the most reliable technique for extracting such information from QCD. The hadron spectrum has been computed and predictions of weak decay constants of heavy mesons have been made. Application of this approach to finite temperature QCD has yielded a slew of thermodynamics determinations, such as the pressure as a function of temperature. It is therefore natural to ask whether lattice QCD can help us in locating the QCD critical point. The prospect of finding the critical point experimentally makes it exciting both as a check of theoretical predictions and as a competition for getting there first. Clearly, in view of the complexity of this task, one could turn to lattice QCD again to see if it can provide any hints for the experimental search program. In this talk, I summarise the results of our group in TIFR, Mumbai in these directions.
Due to the well-known fermion doubling problem, one has to make a compromise in choosing the quark type for any computation. Mostly staggered quarks are used in the lattice simulations at finite temperature and density. These have an exact chiral symmetry which provides an order parameter for the entire - plane but unfortunately the flavour and spin symmetry is broken for them on lattice. A representation of precisely 2 (or 2 +1) quark flavours may thus be problematic, more so on the coarse lattices one is constrained to employ. The existence of the critical point, on the other hand, is expected to depend crucially on the number of flavours. Although computationally much more expensive, domain wall or overlap fermions are better in this regard, as they do have the correct symmetries for any lattice spacing at zero temperature and density . Introduction of chemical potential, , for these, however, is not straight-forward due to their non-locality. Bloch and Wettig [2] proposed a way to do this. Unfortunately, it turns out [3] that their prescription breaks chiral symmetry . Furthermore, the chiral anomaly for it depends on unlike in continuum QCD [4]. While both these deficiencies go away in the continuum limit, the practical problem of the lack of an order parameter on finite lattices remains. What is therefore desperately needed is a formalism with continuum-like (flavour and spin) symmetries for quarks at nonzero and with a well-defined order parameter on lattice.
Finite density simulations needed for locating a critical point suffer from another well known problem. This one is inherited from the continuum theory itself: the fermion sign problem. It is a major stumbling block in extending the lattice techniques to the entire - plane. Several approaches have been proposed in the past decade to deal with it. Let me provide a partial list: 1) Two parameter re-weighting [5], 2) Imaginary chemical potential [6], 3) Taylor expansion [7], 4) Canonical ensemble method [8], and 5) Complex Langevin approach [9]. We employ the Taylor expansion approach, developed independently by the TIFR group [7] and the Bielefeld group [7], to obtain the results discussed in the next section.
2 Lattice Results
Our results were obtained by simulating full QCD with two flavours of staggered fermions of mass on lattices, with and 8, 10, 12, 16, 24 [10] and a finer with 12, 18, 24 [11]. Earlier work by the MILC collaboration for the smaller lattice had determined and , leading to a Goldstone pion of 230 MeV in our case. For the finer lattice, we determined as well. We covered a temperature range of 0.89 1.92 by suitably choosing the range of couplings on both lattices. Our measurements were made typically on 50-200 independent configurations, separated by the respective autocorrelation lengths.
From the canonical definitions of number densities and susceptibilities , the QCD pressure can be seen to have the following expansion in :
| (1) |
where the indices and denote the number of derivatives of the partition function with respect to the corresponding chemical potentials. We construct the series for baryonic susceptibility from this expansion. and look for its radius of convergence as the estimate of the nearest critical point.
Successive estimates for the radius of convergence were obtained by using the ratio method [ ] and the nth root method []. We used terms up to 8th order in for doing so. A key point to note is that all coefficients of the series must be positive for the critical point to be at real , and thus physical. We thus first look for this condition to be satisfied and then look for agreement between the two definitions above as well as their -independence to locate the critical point. The detailed expressions for all the terms can be found in [10] where the method to evaluate them is also explained. We use stochastic estimators. For terms up to the 8th order one needs 20 inversions of on 500 vectors for a single measurement on a given gauge configuration. This makes the computation expensive. Nevertheless, extension to 10th & even 12th order may be possible, especially using new emerging ideas [4] which may save up to 60 % computer time in the measurements. Adding the chemical potential simply as , as proposed in[4], one has the advantage that most derivatives of the quark matrix with are zero except the first. This reduces the number of terms in each nonlinear susceptibility (NLS) appearing in the equation above a lot. One can show that it still leads to essentially the same results[12].
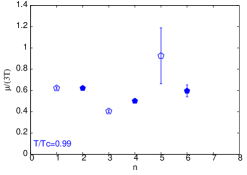
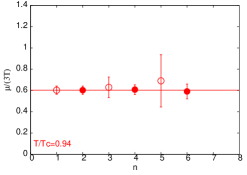
Fig. 1 shows our results for both the ratios defined above on lattice at two different temperatures, and 0.94. All the susceptibilities are positive at both but the ratios fluctuate for the former while seeming to be constant for the latter. We[11] thus found the coordinates of the endpoint (E)—the critical point—to be , and for the finer lattice. Our earlier coarser [10] lattice result was for similar volumes with an infinite volume result leading to . In view of this, it may be safer to quote the critical point to be at .
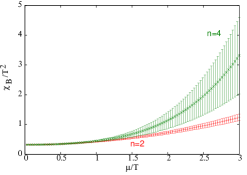
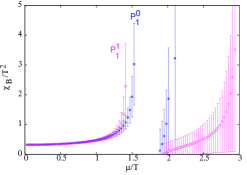
As a cross check on the location of the , one can use the series with the numerically determined coefficients directly to construct for nonzero . As one sees in Fig. 2, it leads to smooth curves with no signs of criticality, whereas employing the Padé approximants for the series to estimate the radius of convergence does lead to a consistent window with our above estimate.
3 Searching Experimentally
In order to make predictions for the heavy ion experiments, and design further any search criteria for the critical point, one needs to know the temperature and the chemical potential as a function of the colliding energy. Recently, we proposed [13] to use the freeze-out curve as a a way to exploit the information hidden in the nonlinear susceptibilities discussed in the previous section by evaluating lattice QCD predictions along it. Recall the well known observation that the huge amounts of precise data on hadron abundances in a variety of relativistic heavy ion experiments are well described [14] by statistical thermodynamical models. Indeed this description has been found to work over the entire range of experiments made so far. It thus leads to a mapping of the and parameters of the model to the collision (center of mass) energy . Assuming these to reflect the true thermodynamic variables of the system and plotting these results in the - plane, one has the freeze-out curve. We treat this curve, solely based on precise experimental data on hadron yields, as a means to provide the accessible in heavy-ion experiments as a function of the colliding energy . We use then these relevant freeze-out parameters and in our lattice computations directly to make predictions as a function of colliding energy.
One expects the QCD critical point to have a critical region whose size depends on the size of the fireball as well as the critical exponents. The freeze-out curve may pass through it or may miss it. If the conditions are thus right, it may pass close enough to the critical point such that a study of fluctuations along it will detect its presence. We define , , and . Note that the variance, skew and kurtosis of the event distribution of baryon number measure the various ’s above. Furthermore, the spatial volume cancels out in these ratios, making them also suitable for experiments who can use their favourite proxy for it. Usually, number of participants is preferred for that role in the analysis of heavy ion data.
Defining , and denoting by the estimate for radius of convergence using , as before, one has
Similar series expressions can be written [13] down for and . We resum these by the Padè method described above to construct them, since they seem to capture the critical behaviour well in Fig. 2:
.
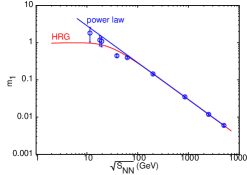
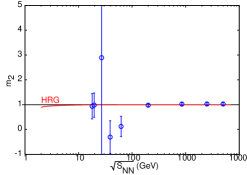
Figure 3 shows our [13] results for these ratios on our finer lattice; the results for coarser lattice are similar and can be found in Ref. [13]. Also shown in these figures are hadron resonance gas results which do not assume a critical point. One observes a smooth and monotonic behaviour for large which is well reproduced by the hadron resonance gas. Note that even in this smooth region, any experimental comparison is exciting since it is a direct non-perturbative test of QCD in hot and dense environment. Earlier lattice predictions, such as the equation of state or the transition temperature can be compared with experiments only indirectly. Remarkably, a non-monotonic behaviour is visible in Fig. 3 at our estimated critical point in all , suggesting that it would be accessible to the low energy scan of RHIC at BNL. Indeed, even if one were to be cautious in trusting the numerical precision of our results, what should be clear that such a non-monotonic behaviour seen at any other nearby location would still signal the presence of QCD critical point.
In order to confront these results on the baryon number fluctuations with data, one needs to address the issue of neutral baryons—neutrons—which are not easy to detect and are thus missed. It turns out that proton number fluctuations suffice [15]. Since the diverging correlation length at our critical point is linked to the mode which cannot mix with any isospin modes, and the isospin susceptibility must be regular there. Assuming protons, neutrons, pions to dominate, Ref [15] showed to be dominated by proton number fluctuations only. The STAR collaboration has recently exploited this idea and constructed the ratios and from net proton distributions [16].
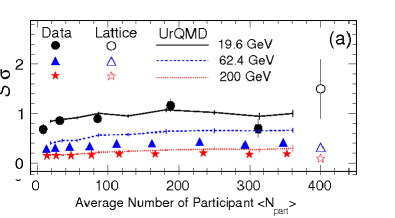
Figure 4 shows their results for against our lattice data. Remarkably, one observes a good agreement with our lattice results. Hopefully, future results from the RHIC energy scan will locate the critical point this way. Similar agreement is also seen for .
4 Summary
The QCD phase diagram in the - plane has begun to emerge using first principles lattice approach. Our finer lattice results for are first to begin the crawling towards continuum limit, suggesting a critical point at 1-2. Ratios of nonlinear susceptibilities appear to be smooth on the freeze-out curve at large colliding energy. Critical point leads to structures in these , which may be accessible in future. STAR results on proton number fluctuations appear to agree with our lattice QCD predictions, making this a unique direct non-perturbative test of hot and dense QCD in experimental tests. So far no signs of a critical point have emerged in the CERN and RHIC experimental results. An interesting question is whether the RHIC energy scan deliver it for us or whether we will need to wait for FAIR at GSI to be operational. At any rate, exciting future awaits these programs and all of us interested in it.
References
- [1] K. Rajagopal and F. Wilczek, in ”At the Frontier of Particle Physics / Handbook of QCD”, Vol. 3, M. Shifman, ed., (World Scientific), p2061.
- [2] J. Bloch and T. Wettig, Phys. Rev. Lett. 97, 012003 (2006) and Phys. Rev. D76, 114511 (2007).
- [3] D. Banerjee, R. V. Gavai and S. Sharma, Phys. Rev. D78, 014506 (2008) and PoS (LATTICE 2008), 177.
- [4] R. V. Gavai and S. Sharma, Phys. Rev. D81, 034501 (2010).
- [5] Z. Fodor & S. Katz, JHEP 0203 (2002) 014.
- [6] Ph. de Forcrand & O. Philipsen, Nucl. Phys. B642 (2002) 290; M. -P. Lombardo & M. D’Elia, Phys. Rev. PR D67 (2003) 014505.
- [7] C. Allton et al.,Phys. Rev. D68 (2003) 014507; R. V. Gavai and S. Gupta, Phys. Rev. D68, 034506 (2003).
- [8] K. -F. Liu, Int. J. Mod. Phys. B16 (2002) 2017; S. Kratochvila and Ph. de Forcrand, PoS LAT2005 (2006) 167.
- [9] G. Aarts, E. Seiler and I. O. Stamatescu, Phys. Rev. D 81 (2010) 054508 and references therein.
- [10] R. V. Gavai and S. Gupta, Phys. Rev. D71, 114014 (2005).
- [11] R. V. Gavai and S. Gupta, Phys. Rev. D78, 114503 (2008).
- [12] R. V. Gavai and S. Sharma, Nucl. Phys. A 862-863CF, 355 (2011) and Bielefeld/TIFR preprint BI-TP 2011/42, TIFR/TH/11-47.
- [13] R. V. Gavai and S. Gupta, Phys. Lett. B 696, 459 (2011) [arXiv:1001.3796 [hep-lat]].
- [14] A. Andronic, P. Braun-Munzinger and J. Stachel, Phys. Lett. , B 673 (2009) 142; H. Oeschler, J. Cleymans, K. Redlich, S. Wheaton, arXiv:0910.2128.
- [15] Y. Hatta and M. A. Stephenov, Phys. Rev. Lett. 91 (2003)102003.
- [16] M. M. Agrawal et al., Phys. Rev. Lett. 105 (2010) 022302 [arXiv : 1004.4959].