Dissecting early-type dwarf galaxies into their multiple components
Abstract
Early-type dwarf galaxies, once believed to be simple systems, have recently been shown to exhibit an intriguing diversity in structure and stellar content. To analyze this further, we started the SMAKCED project111tellar content, ss and inematics of luster arly-type warfs, http://www.smakced.net, and obtained deep -band images for 101 early-type dwarf galaxies in the Virgo cluster in a brightness range of mag, typically reaching a signal-to-noise of 1 per pixel of at surface brightnesses mag/arcsec2 in the -band. Here we present the first results of decomposing their two-dimensional light distributions. This is the first study dedicated to early-type dwarf galaxies using the two-dimensional multi-component decomposition approach, which has been proven to be important for giant galaxies. Armed with this new technique, we find more structural components than previous studies: only a quarter of the galaxies fall into the simplest group, namely those represented by a single Sérsic function, optionally with a nucleus. Furthermore, we find a bar fraction of 18%. We detect also a similar fraction of lenses which appear as shallow structures with sharp outer edges. Galaxies with bars and lenses are found to be more concentrated towards the Virgo galaxy center than the other sample galaxies.
Subject headings:
galaxies: elliptical and lenticular, cD — galaxies: dwarf — galaxies: photometry — galaxies: structure — galaxies: clusters: individual: (Virgo Cluster)1. Introduction
Early-type dwarf (dE) galaxies are the most abundant galaxy population in high-density environments. Their low mass and large number make them ideal probes of the mechanisms that can alter the appearance of galaxies: internal processes as well as environmental influences. Their ubiquity and susceptibility to various physical mechanisms give them a key role in understanding galaxy cluster evolution. The popular belief that dEs were formed from spiral and irregular galaxies at late epochs by the cluster environment (e.g. Moore et al. 1998; Boselli et al. 2008; Kormendy & Bender 2011; Toloba et al. 2011) is contrasted with the formation of dEs in models of a CDM universe, as the descendants of cosmological building blocks. In the latter scenario dEs would be close relatives to their giant counterparts (e.g. de Rijcke et al. 2005; Janz & Lisker 2008, 2009; Weinmann et al. 2011).
Disk structures in dEs have been searched for since the early 1990s (Binggeli & Cameron, 1991; Jerjen et al., 2000; Barazza et al., 2002). The prevailing interpretation was that the disk structures, as imprints of their host galaxy’s history, point at late-type disk galaxies as progenitors for dEs. Subsequent work in recent years has shown that dEs are rather heterogeneous, with their various characteristics depending strongly on the position within the cluster: different subclasses based on morphology and stellar population characteristics were identified (Lisker et al., 2006a, b, 2007, 2008); dEs are not old in general, but cover a large range in age and metallicity (Michielsen et al., 2008; Paudel et al., 2010); the degree of rotational support varies (Toloba et al., 2009, 2011); and their shapes seem to depend even on their orbital characteristics (Lisker et al., 2009). The various results imply that the dEs might be a mixed bag, possibly with multiple formation channels (Lisker, 2009).
Here, we explore the feasibility of revealing detailed structures in dEs using a two-dimensional multi-component decomposition approach. Laurikainen et al. (2010) demonstrated for S0s how morphological information via such detailed decompositions can contribute to unveiling possible formation processes of those galaxies. Surprisingly, we find for the dEs that only a minority of them in the Virgo cluster appears to follow the classical picture of a featureless galaxy.
2. Data
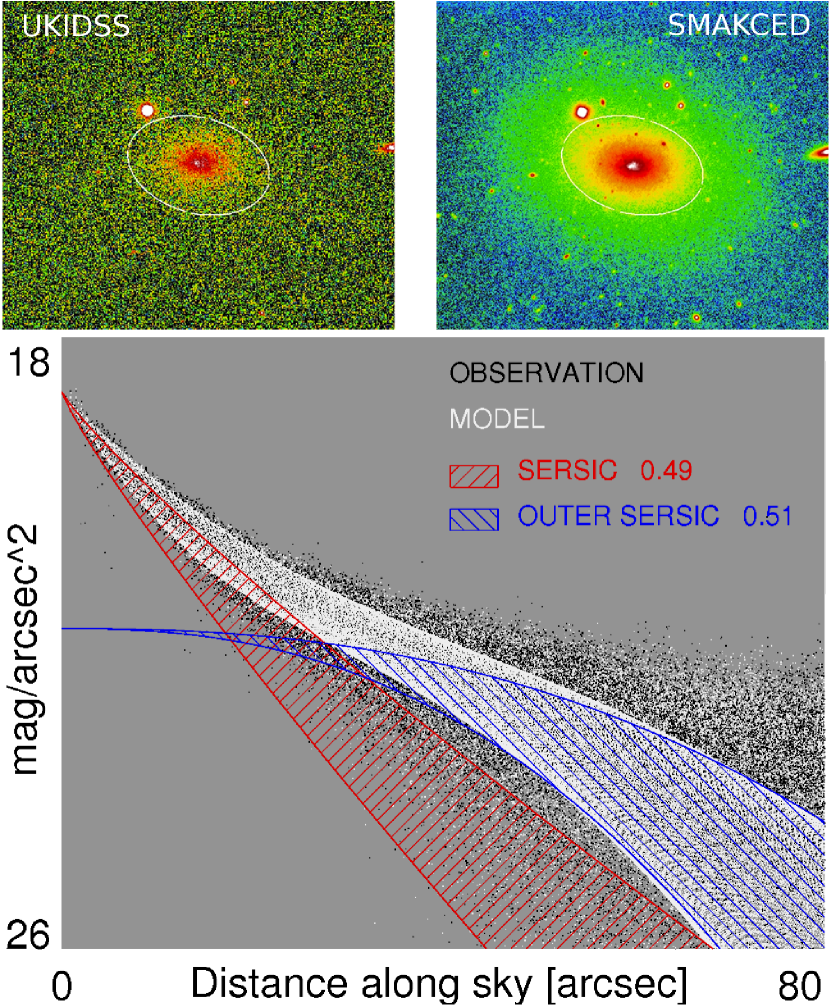
Within the SMAKCED projecta we aim at obtaining deep -band images for a complete sample of 174 early-type galaxies in the Virgo cluster in the brightness range of mag ( mag, Mei et al. 2007). The sample is drawn from the Virgo cluster catalog (VCC, Binggeli et al. 1985, ‘certain members’). Observations in the near-infrared (NIR) allow the most direct characterization of the galaxies’ stellar mass distribution and are much less affected by dust extinction than in the optical. Some dEs contain dust (Peletier, 1993; Lisker et al., 2006b; de Looze et al., 2010), which could mimic complex structures. During 2010-2011 we obtained images for 81 of the 174 galaxies with ESO NTT, TNG, and NOT. Complemented with archival data this yields a sample of 101 galaxies. Our images typically reach a -band surface brightness of 22.2-23.0 mag/arcsec2 at per pixel (scale to ), deeper than in previous works (Fig. 1). The reductions of the on-target dithered observations, done with iraf, included cross-talk removal, flatfielding, sky subtraction, and correction for the field distortions, where necessary.
3. Two-dimensional Decompositions
For decomposing the galaxies’ light into potentially multiple components we employ galfit 3.0 (Peng et al., 2010), which uses a minimization algorithm to find the optimal solution for a given set of functions and starting values. galfit’s solutions were visually evaluated using galfidl111H. Salo, http://sun3.oulu.fi/~hsalo/galfidl.html, a set of idl routines. Fore- and background sources were masked out; the PSF FWHM was determined for several point-like sources using SExtractor on each image (typically ) and the model was convolved with the averaged (gaussian) PSF during the fitting process.
As further input galfit needs the uncertainties of the pixel values, i.e. a -image. We calculate, for each pixel, the standard deviation over the individual images, taking advantage of the large number of exposures for each galaxy. The obtained -image is normalized to correspond to the sky pixel-to-pixel variations in the final coadded image. The model fitting does not incorporate possible systematic large scale background variations. The potential bias by such variations is estimated from the RMS of mean sky values in small boxes distributed on the image. Such a bias could alter the profiles within the shaded area indicated in Fig. 2.
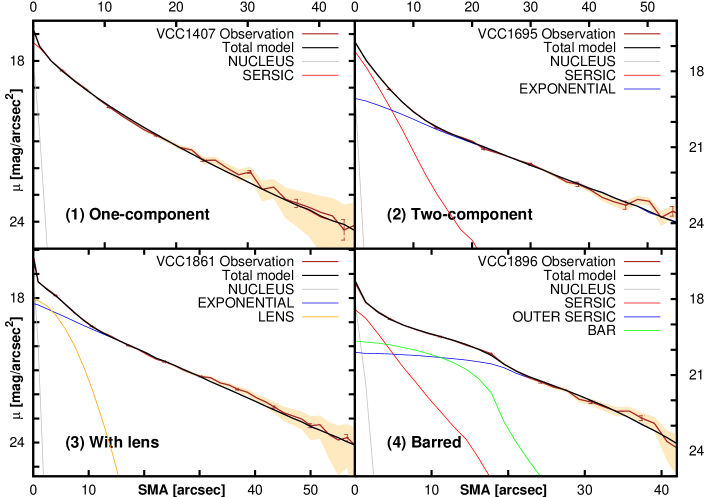
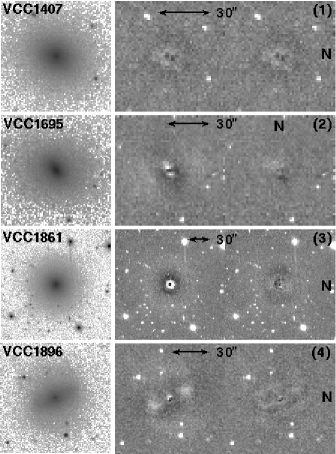
For all galaxies we fitted the following basic models: one-component, one-component+nucleus, and two-component models. Sérsic (1963) functions were used for the components, while the nucleus was modeled by a point source. Subsequently, we visually evaluated the quality of the fit by inspecting the residual structures seen in the model-subtracted images (Fig. 3) and in profile representations showing all observed pixels (Fig. 1). We also inspected the one-dimensional surface brightness profiles and profiles of position angle and ellipticity (obtained by iraf/ellipse fitting). When deemed necessary from the fit residuals and profile representations, we fitted models with additional bar or lens components. Lens, in this context, refers to an inner component with ‘a shallow brightness gradient with a sharp outer edge’ (Kormendy, 1979). In distinction to bars (), lenses have intrinsic axial ratios close to unity ().
The basic models consist of one or two Sérsic functions. The fit of the outer component in the two-component model had a Sérsic index fixed to 1 (i.e. exponential). Its orientation and ellipticity were fixed to the mean of the outer isophotes. For a few galaxies was a free parameter, to account for a steeper drop of the outer profile with (Fig. 1 and panel 4 of Fig. 2). For a substantial number of the two-component galaxies, the Sérsic index of the inner component is ( for 53%). For bars and lenses we chose Ferrers’ function (see Peng et al. 2010) with elliptical isophotes, since it allows for a better treatment of the outer cutoff of the surface brightness (see Laurikainen et al. 2009). In a few cases the fit was considerably improved when the center for each component was left free. Notably most of those galaxies were classified as having residual star formation in the center (dE(bc)s, Lisker et al. 2006b).
4. Results
4.1. Groups of structural types
We order the galaxies by the set of components building up the galaxy’s model and define the following groups: (1) one component, (2) two components (typically Sérsic+exponential), (3) galaxies with lenses, and (4) barred galaxies. Representative examples for the groups are shown in Fig. 2. The final model for a given galaxy, and thus its group assignment, was chosen based on the visually judged improvement of the residual structures (Fig. 3) and profile representations.
In most cases the lens is accompanied by an exponential outer component; however in two cases it is a Sérsic component with . Only 3 of the galaxies with a lens have three components (not counting the nucleus). The galaxies with lenses might be regarded as two-component systems with further complexity (cf. Binggeli & Cameron 1991), but we assign them to their own group. The presence of a nucleus does not affect the group designation. For in-depth analysis of nuclei in dEs we refer to the literature, especially to studies resolving them (i.e. Advanced Camera for Surveys (ACS) Virgo Cluster Survey, Ferrarese et al. 2006). Spiral arms can be clearly seen in the residual image of four galaxies, while for two more galaxies they are at the detection limit. Two of the galaxies with a lens host additionally a small bar.
It is not possible to assign all galaxies unambiguously to one group, since two different models might fit equally well. Uncertainties that would shift the galaxies from the two- to one-component group include: (a1) the improvement of two components over the one-component model is marginal, (a2) the inner component of a galaxy fitted by a Sérsic function is so small that it might be just a nuclear component. If the edge of a lens is less well-defined, the component can be alternatively fitted with a Sérsic function with , which would shift the galaxy from the group with lenses to the two-component group (b). Bars are characterized by high ellipticity and possibly an orientation distinct from the disk component, but they are modeled with the same function as lenses. Especially in more inclined galaxies this distinction can become difficult, the less certain cases being listed as (c).
In Table 1 we summarize the number statistics for the four groups and number the less certain cases among them.
The sample is divided into different bins of galaxy brightness, morphological subclass, and projected clustercentric distance.222We consider the cluster center to be marked by M87.
In total 22 galaxies are not included in any group as their decomposition is unreliable:
14 are more inclined than , i.e. axis ratio ), and for 8 galaxies
no satisfactory fit was achieved due to persistent residuals structures.
4.2. Analysis
First and foremost our analysis separates galaxies that satisfy the simplest one-component models from those with more complex structures. The fraction of simple galaxies is surprisingly low, given the picture of dEs as structureless, red and dead galaxies: only 24% of the galaxies in our analyzed sample exhibit a simple structure (see Table 1, 27% of those with dE classification; 34% when adding the less certain two-component galaxies). Obviously, our low fraction of simple galaxies might even decrease if still deeper images were available.
The largest fractions of simple galaxies are found among those where no disk feature or blue center had been identified previously (Lisker et al., 2007), and among the faintest galaxies. That the fraction of galaxies with multi-component structures increases towards brighter galaxies in Table 1 is not a simple selection effect, since the desired image depth was chosen according to the surface brightness at the half-light radius of each galaxy. Therefore, we do not expect to miss components in dimmer galaxies provided that they contain a similar fraction of light and have similar relative extent. While galaxies of higher mass may be expected to shield their structures more easily against external heating, the increase of the multi-component galaxy fraction with increasing galaxy brightness is not statistically significant: a Kolmogorov-Smirnov (KS)-test yields 7.2% probability for them being drawn from the same brightness distribution.
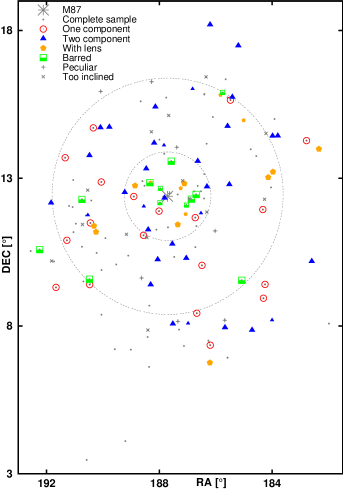
Fig. 4 displays the distribution of galaxies in the different groups inside the Virgo cluster. Simple galaxies appear less centrally concentrated (see also Table 1), but the clustercentric distances of simple and multicomponent galaxies do not differ significantly according to a KS-test. Indeed, simple galaxies are distributed similarly to two-component galaxies, which constitute the major part of the multicomponent ones. On the other hand, barred galaxies are more concentrated towards the projected cluster center than the two-component galaxies (KS-test 1.6%; 4.6% when comparing barred and one-component galaxies).
Bars were fitted in 12 galaxies, 4 of them being classified as less certain. With the two small bars in galaxies with lenses, not fitted in the decompositions, this leads to a bar fraction of 18% (13% without less certain cases). Some galaxies in our sample fall into the dwarf brightness regime, but were previously classified as E or S0. Omitting these galaxies does not change the bar fraction. Lenses were fitted in 14 galaxies (18%). Kormendy (1979) suggested that bars and lenses are evolutionary related, i.e. that lenses are dissolved bars. When we treat barred galaxies and galaxies with a lens as one combined group, we find their projected clustercentric distance distribution to be significantly different from that of the other dEs (KS-test 0.4%).
| Group | 1 | 2 | 3 | 4 | Total | Complete |
|---|---|---|---|---|---|---|
| 1 component | 2 component | w. lens | barred | analyzed | sample | |
| Less certain cases | (a1+a2) | (b) | (c) | |||
| All | 19 / 24% | 34 (7) / 43% | 14 (5) / 18% | 12 (4) / 15% | 79 | 174 |
| 1 / 8% | 5 (0) / 38% | 4 (3) / 31% | 3 (0) / 23% | 13 | 28 | |
| 10 / 21% | 23 (5) / 49% | 7 (1) / 15% | 7 (4) / 15% | 47 | 61 | |
| 8 / 42% | 6 (2) / 32% | 3 (1) / 16% | 2 (0) / 11% | 19 | 85 | |
| dE(all) | 18 / 27% | 29 (5) / 43% | 10 (4) / 15% | 10 (4) / 15% | 67 | 145 |
| dE(N) | 11 / 37% | 8 (1) / 27% | 8 (3) / 27% | 3 (2) / 10% | 30 | 106 |
| dE(nN) | 2 / 40% | 3 (0) / 60% | 0 | 0 | 5 | 27 |
| dE(di) | 4 / 16% | 11 (2) / 44% | 2 (1) / 8% | 8 (2) / 32% | 25 | 33 |
| dE(bc) | 1 / 10% | 9 (2) / 90% | 0 | 0 | 10 | 15 |
| E & S0 | 1 / 8% | 5 (2) / 42% | 4 (1) / 33% | 2 (0) / 17% | 12 | 29 |
| 3 / 13% | 7 (2) / 30% | 6 (3) / 26% | 7 (3) / 30% | 23 | 42 | |
| 9 / 26% | 15 (3) / 44% | 6 (2) / 18% | 4 (1) / 12% | 34 | 84 | |
| 7 / 32% | 12 (2) / 55% | 2 (0) / 9% | 1 (0) / 5% | 22 | 48 |
Note. — We list numbers and fractions of galaxies in each group binned over the brightness, subclass (Lisker et al., 2006a, b, 2007), and angular distance to M87 ( Mpc). The total sum in the subclass binning is larger than the total number of galaxies, since s can belong to multiple subclasses. The less certain cases in each group (, , , and , see Sec. 4.1), shown in parenthesis, are included in the numbers and fractions. Additionally two small bars were visually identified but not fitted and therefore not counted in this table.
5. Discussion
Recent studies of detailed structures in the dEs in the Virgo cluster include McDonald et al. (2011), Ferrarese et al. (2006), and Lisker et al. (2006a). McDonald et al. (2011) fitted Sérsic and Sérsic+exponential models to the one-dimensional light profiles of galaxies in the Virgo cluster, also in the -band. Number statistics of structural components were not given, but taking their decompositions for our sample leads to a very similar fraction of simple galaxies. The agreement in a one-by-one comparison for the galaxies in common is less good, though. A fair comparison for individual cases is hindered, since the algorithm by which their fitting code decides in favor of one or two components has not been described in detail.
Ferrarese et al. focused more on the inner regions with the superior resolution of HST ACS. Lisker et al. (2006a) searched systematically for disk features using Sloan Digital Sky Survey images. They introduced the dE subclass named dE(di) for galaxies, in which such signatures were revealed by unsharp masking. The brightness distribution of the fraction of our galaxies fitted by more than one component is similar to their fraction of galaxies with disk features: up to 50% for the brightest dEs, but decreasing towards fainter brightnesses. Concerning morphological types, we find that 84% of the 25 dE(di)s in our sample have multiple components. In eight of them we fit a bar. Three of the four dE(di)s fitted with only one component show spiral arms in the residual images. Also, 64% of the dE(N)s in our sample (in their terminology, nucleated dEs with no other feature) show more complex morphologies. Already Binggeli & Cameron (1991) noticed visually that two thirds of dEs in our magnitude range show a break in their B-band surface brightness profile, but recent studies did not take this up.
Aguerri et al. (2005) decomposed the azimuthally averaged light profiles for 99 dEs in the Coma cluster, in a magnitude range of mag. Their criterion for the need of two components (Sérsic+exponential) was a deviation of more than 0.15 mag of the simple Sérsic model from the observed profile at any radius, taking into account photometric errors. They found that 34% of their galaxies with reliable photometry are not well fitted by a single Sérsic function. Our fraction for the Virgo cluster is much larger, 82%, for a comparable magnitude range of mag. It would be interesting whether the difference is due to their simpler method and worse physical resolution, or due to a real difference, for example caused by the environment. Hoyos et al. (2011) fitted single Sérsic profiles for galaxies in the Coma cluster region using galfit and gim2d on HST ACS data. Since their physical resolution is comparable to our study, their planned multi-component decompositions will provide an interesting comparison sample.
Even though Coma is more massive, denser and has a larger fraction of red galaxies than Virgo (Weinmann et al. 2011, and references therein), the bar fraction we find in Virgo (and its decrease towards fainter galaxy brightnesses, see Table 1) agrees with the findings of Méndez-Abreu et al. (2010) for the Coma cluster. One may speculate that the increase of the Virgo cluster bar fraction towards the dense cluster center, and yet the similarity of the overall Virgo bar fraction to the denser Coma cluster is due to an interplay between tidal interactions that induce bar formation and heating of the disks that impedes the formation and longevity of bars. Also bars in spiral galaxies in the Virgo cluster (Andersen, 1996), in disk galaxies in the Coma cluster (Thompson, 1981) and in clusters at intermediate redshifts (Barazza et al., 2009) were found to be more frequent towards the cluster centers.
While unsharp masking is sensitive to sharper features like bars, parametric functions fitted to the one-dimensional light profile are sensitive to deviations from a simple form, i.e. the Sérsic profile shape. Our two-dimensional fitting technique accounts for both of them in a quantitative manner. In this sense our smaller fractions of simple galaxies as compared to Lisker et al. (2006a), Aguerri et al. (2005), and earlier studies may well be a consequence of the different methods used.
Paudel et al. (2010) analyzed ages and metallicities of a sample of Virgo dEs using Lick indices. They found that the dE(di)s have younger stellar populations on average than the dE(N)s (see also Toloba et al. 2009), but that also the brighter dEs, for which disk features are more frequent, have younger populations than the fainter ones. They speculate that further disks may be present in the dE(N)s but may have eluded discovery so far, which is interesting given our large fraction of galaxies with complex profiles. If late-type galaxies had been transformed into dEs (Kormendy & Bender, 2011; Boselli et al., 2008), the complex structures could be understood as inherited from the progenitor. At least part of the late-type galaxies with stellar masses between and possess a two component structure (Graham & Worley, 2008). If this structure survived disk thickening, caused by tidal heating (Gnedin, 2003; Smith et al., 2010) and by gas depletion from ram-pressure stripping (Smith et al., 2011), such galaxies may resemble complex dEs today.
6. Summary
For the first time, we have applied a detailed two-dimensional multi-component fitting technique to a large sample of dEs, using deep NIR images. The images typically reach surface brightnesses of 22.2-23.0 mag/arsec2 in the -band. In many galaxies this method has revealed more complex structures than previously known. Only for 27% of the dEs is the light distribution well represented by a single Sérsic function. Of the dE(di)s 16% were fitted by one component, but most of those appear to have disks manifested as spiral arms in the residual images. Bars were detected in 18% and lenses also in 18% of the galaxies. The physical nature of the various components remains to be investigated, ideally with a combined kinematical and stellar population analysis in future studies.
References
- Aguerri et al. (2005) Aguerri, J. A. L., Iglesias-Páramo, J., Vílchez, J. M., Muñoz-Tuñón, C., & Sánchez-Janssen, R. 2005, AJ, 130, 475
- Andersen (1996) Andersen, V. 1996, AJ, 111, 1805
- Barazza et al. (2002) Barazza, F. D., Binggeli, B., & Jerjen, H. 2002, A&A, 391, 823
- Barazza et al. (2009) Barazza, F. D., et al. 2009, A&A, 497, 713
- Binggeli et al. (1985) Binggeli, B., Sandage, A., & Tammann, G. A. 1985, AJ, 90, 1681
- Binggeli & Cameron (1991) Binggeli, B., & Cameron, L. M. 1991, A&A, 252, 27
- Boselli et al. (2008) Boselli, A., Boissier, S., Cortese, L., & Gavazzi, G. 2008, ApJ, 674, 742
- de Looze et al. (2010) de Looze, I. et al. 2010, A&A, 518, 54
- de Rijcke et al. (2005) de Rijcke, S., Michielsen, D., Dejonghe, H., Zeilinger, W. W., & Hau, G. K. T. 2005, A&A, 438, 491
- Ferrarese et al. (2006) Ferrarese, L., et al. 2006, ApJS, 164, 334
- Graham & Worley (2008) Graham, A. W., Worley, C. C., 2008, MNRAS, 388, 1708
- Gnedin (2003) Gnedin, O. Y. 2003, ApJ, 589, 752
- Hoyos et al. (2011) Hoyos, C., et al. 2011, MNRAS, 411, 2439
- Janz & Lisker (2008) Janz, J., & Lisker, T. 2008, ApJ, 689, L25
- Janz & Lisker (2009) —. 2009, ApJ, 696, L102
- Jerjen et al. (2000) Jerjen, H., Kalnajs, A., & Binggeli, B. 2000, A&A, 358, 845
- Kormendy (1979) Kormendy, J. 1979, ApJ, 227, 714
- Kormendy & Bender (2011) Kormendy, J., & Bender, R. 2011, ApJS accepted, arXiv:1110.4384
- Laurikainen et al. (2009) Laurikainen, E., Salo, H., Buta, R., & Knapen, J. H. 2009, ApJ, 692, L34
- Laurikainen et al. (2010) Laurikainen, E., Salo, H., Buta, R., Knapen, J. H., & Comerón, S. 2010, MNRAS, 405, 1089
- Lisker et al. (2006a) Lisker, T., Glatt, K., Westera, P., & Grebel, E. K. 2006a, AJ, 132, 2432
- Lisker et al. (2006b) Lisker, T., Grebel, E. K., & Binggeli, B. 2006b, AJ, 132, 497
- Lisker et al. (2008) —. 2008, AJ, 135, 380
- Lisker et al. (2007) Lisker, T., Grebel, E. K., Binggeli, B., & Glatt, K. 2007, ApJ, 660, 1186
- Lisker (2009) Lisker, T. 2009, AN 330, 1043
- Lisker et al. (2009) Lisker, T., et al. 2009, ApJ, 706, L124
- McDonald et al. (2011) McDonald, M., Courteau, S., Tully, R. B., & Roediger, J. 2011, MNRAS, 414, 2055
- Mei et al. (2007) Mei, S., et al. 2007, ApJ, 655, 144
- Méndez-Abreu et al. (2010) Méndez-Abreu, J.; Sánchez-Janssen, R.; Aguerri, J. A. L. 2010, ApJ, 711, L61
- Michielsen et al. (2008) Michielsen, D., et al. 2008, MNRAS, 385, 1374
- Moore et al. (1998) Moore, B., Lake, G., & Katz, N. 1998, ApJ, 495, 139
- Paudel et al. (2010) Paudel, S., Lisker, T., Kuntschner, H., Grebel, E. K., & Glatt, K. 2010, MNRAS, 405, 800
- Peletier (1993) Peletier, R. F. 1993, A&A, 271, 51
- Peng et al. (2010) Peng, C. Y., Ho, L. C., Impey, C. D., & Rix, H.-W. 2010, AJ, 139, 2097
- Sérsic (1963) Sérsic, J. L. 1963, Bol. Asoc. Argentina Astron. La Plata Argentina, 6, 41
- Smith et al. (2010) Smith, R., Davis, J. I., & Nelson, A. H. 2010, MNRAS, 405, 1723
- Smith et al. (2011) Smith, R., Fellhauer, M., & Assmann, P. 2011, MNRAS accepted, arXiv:1110.5555
- Thompson (1981) Thompson, L. A. 1981, ApJ, 244, L43
- Toloba et al. (2011) Toloba, E., et al. 2011, A&A, 526, 114
- Toloba et al. (2009) —. 2009, ApJ, 707, L17
- Weinmann et al. (2011) Weinmann, S. M., Lisker, T., Guo, Q., Meyer, H. T., & Janz, J. 2011, MNRAS, 416, 1197