∎
Tel.: +33-1-44-32-35-12
Fax: +33-1-44-32-34-34
22email: fadwa.joud@lkb.ens.fr 33institutetext: N. Warnasooriya 44institutetext: Institut Langevin, ESPCI, 10 Rue Vauquelin, 75005 Paris, France
Present address: Dept. of Biomedical Engineering, Texas A&M University, College Station, TX 77843, U.S.A. 55institutetext: P. Bun 66institutetext: Institut Jacques Monod, Université Paris-Diderot, 15 Rue Hélène Brion, 75205 Paris, France 77institutetext: F. Verpillat 88institutetext: Laboratoire Kastler Brossel, École Normale Supérieure, 24 Rue Lhomond, 75005 Paris, France 99institutetext: S. Y. Suck 1010institutetext: Institut Langevin, ESPCI, 10 Rue Vauquelin, 75005 Paris, France
Fondation Pierre-Gilles de Gennes pour la recherche, 29 Rue d’Ulm, 75005 Paris, France 1111institutetext: G. Tessier 1212institutetext: Institut Langevin, ESPCI, 10 Rue Vauquelin, 75005 Paris, France 1313institutetext: M. Atlan 1414institutetext: Institut Langevin, ESPCI, 10 Rue Vauquelin, 75005 Paris, France 1515institutetext: P. Desbiolles 1616institutetext: Laboratoire Kastler Brossel, École Normale Supérieure, 24 Rue Lhomond, 75005 Paris, France 1717institutetext: M. Coppey-Moisan 1818institutetext: Institut Jacques Monod, Université Paris-Diderot, 15 Rue Hélène Brion, 75205 Paris, France 1919institutetext: M. Abboud 2020institutetext: Département de Physique, Faculté des Sciences, Université Saint-Joseph, Beirut, Lebanon 2121institutetext: M. Gross 2222institutetext: Laboratoire Kastler Brossel, École Normale Supérieure, 24 Rue Lhomond, 75005 Paris, France and Laboratoire Charles Coulomb - UMR 5221 CNRS-UM2 Université Montpellier II place Eugène Bataillon 34095 Montpellier
3D exploration of light scattering from live cells in the presence of gold nanomarkers using holographic microscopy
Abstract
In this paper, we explore the 3D structure of light scattering from dark-field illuminated live 3T3 cells in the presence of 40 nm gold nanomarkers. For this purpose, we use a high resolution holographic microscope combining the off-axis heterodyne geometry and the phase-shifting acquisition of the digital holograms. A comparative study of the 3D reconstructions of the scattered fields allows us to locate the gold markers which yield, contrarily to the cell structures, well defined bright scattering patterns that are not angularly tilted and clearly located along the optical axis (z). This characterization is an unambiguous signature of the presence of gold biological nanomarkers, and validates the capability of digital holographic microscopy to discriminate them from background signals in live cells.
Keywords:
Digital Holography Three-dimensional Microscopy Gold Nanoparticles Biological Markers1 Introduction
Gold nanoparticles attract great scientific and technological interest because of their physical and chemical characteristics. In particular, the optical tracking of gold nanoparticles in biology have gained popularity for several reasons. Gold nanoparticles provide high scattering efficiencies (Jain et al (2006)) and they can be detected directly using dark field or total internal reflection (TIR) illumination down to particle diameters of 40 nm as shown by Sönnichsen et al (2000). Unlike fluorescent markers, they are immune to photo bleaching, and they are potentially non-cytotoxic (see West et al (2006)). Because of these properties, the use of gold nanoparticles as biomarkers for live cell imaging using photothermal tracking (see Cognet et al (2002), Boyer et al (2003) and Lasne et al (2006)) has a high potential.
As shown by Atlan et al (2008), holography has proved its ability to image and localize gold nanoparticles in 3D, either for fixed particles spin coated on a glass substrate or in free motion within a water suspension. More recently, Absil et al (2010) have shown that heterodyne holography also allows the photothermal detection of 10 nm gold particles, and Warnasooriya et al (2010) have imaged 40 nm gold particles in a cellular environment. In that last experiment the particle holographic signal is superimposed with the light scattered by the cell refractive index fluctuations, which yield a speckle field. For particles imaging, this induced speckle is a parasitic signal, but in many other situations, like in Dark Field microscopy , or in Differential Interference Contrast (DIC) microscopy (see Goldberg and Burmeister (1986) ) this speckle is the main source of contrast that is used to image the cell itself. It is thus important to discriminate the particle signal from the cell parasitic speckle.
In this paper, we have imaged biological samples (3T3 cells) labeled with 40 nm gold particles using the digital holographic setup described in Warnasooriya et al (2010). We have performed the 3D holographic reconstruction of the wave-field scattered by the samples, which are illuminated at 45∘ in a total internal reflection configuration, and we have shown that these wave-fields are noticeably different for the particle, and the speckle signal. We showed here that important information can be derived not only from the intensity of the bright spots caused by the gold particles, but also from the 3D shape of the light scattering pattern, which is easily accessed using holography. We showed, in particular, that the speckle signal keeps memory of the illumination direction, while the particle signal does not. This result has been confirmed by imaging samples of cells that have not been labeled with gold particles, and samples of free gold particles. The shape of the wave-field scattered by the sample can thus be used as a signature that helps to discriminate the particle signal from the speckle.
2 Materials and Methods
2.1 Biological specimen preparation
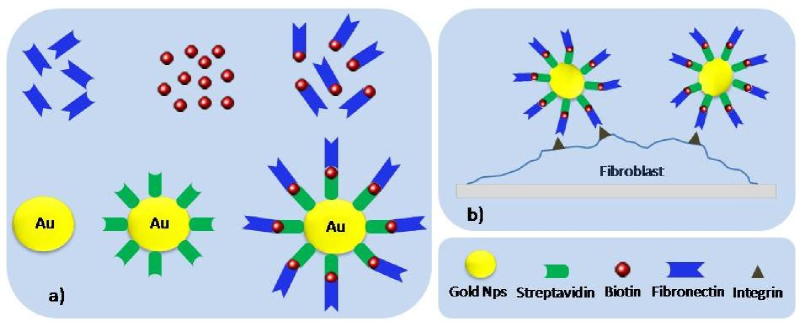 |
The biological specimens that we imaged are monolayers of live NIH 3T3 mouse fibroblasts labeled with 40 nm gold particles via their integrin cellular surface receptors. Streptavidin-coated gold nanoparticles were attached to the surface cellular integrin receptors via biotin and fibronectin proteins: see Fig.1. Streptavidin and biotin are very well known for their strong affinity towards each other, and fibronectin, an extracellular matrix protein, has the property of interacting specifically with cellular surface receptors of integrin family.
Fibronectin proteins (fibronectin from bovine plasma, Sigma, St Louis, MO) were biotinylated using EZ-Link\scriptsizeR⃝Sulfo-NHS-LC-Biotin according to the provider protocol (Pierce, Rockford, IL). The final concentration of biotinylated-fibronectin solution was 0.447 mg/mL. The streptavidin-coated gold conjugates of 40 nm average diameter (BioAssay, Gentaur, France) were rinsed twice with 1X PBS (Phosphate Buffered Saline) (pH = 7.25). We than diluted 10 L of the gold solution in 990 L of the same PBS buffer solution. Then the dilute gold solution was incubated with 50 L of the biotinylated-fibronectin solution for four hours at room temperature to allow the specific streptavidin-biotin bonding. The final functionalized gold particles solution was kept at 4∘C and used within 24 hours after its preparation in order to ensure maximum functionality. Before every use, the functionalized gold particles solution was sonicated.
48 hours before the observation, monolayers of 3T3 cells were cultured in Duelbecco’s modified Eagle’s medium (DMEM Gibco, Invitrogen, Carlsbad, CA) supplemented with 10% fetal calf serum (PAA Laboratories GmbH) on 32 mm diameter fibronectin-coated glass cover slips (fibronectin from bovine plasma, Sigma, St Louis, MO) at 37∘C in a 5% CO2 atmosphere. After 24 hours of incubation, we added to each coverslip a solution composed of DMEM (2 mL) plus 500 L of the functionalized gold particles solution. The binding of integrin and fibronectin occurs at this level allowing the cells to attach, on their surface, the functionalised gold nanoparticles.
The coverslip containing adherent 3T3 cells tagged with 40 nm gold nanoparticles was mounted on a specific observation chamber. In order to maintain the physiological pH condition during the experiments, cells were kept in DMEM-F12 medium (DMEM-F12 without Phenol red, B12 vitamin, Riboflavin, 0.5% fetal calf serum and supplemented with 20 mM of HEPES [(4-(2-hydroxyethyl)-1-piperazineethanesulfonicacid)] and L-Glutamine from PAA Laboratories). We measured the level of biotin incorporation on an HABA [2-(4’ -Hydroxyazobenzene) Benzoic Acid)] quantitation assay to verify the efficiency of the biotinylation protocol. Average number of biotin molecules obtained per fibronectin is 2.5.
2.2 Holographic Microscope Experimental Setup
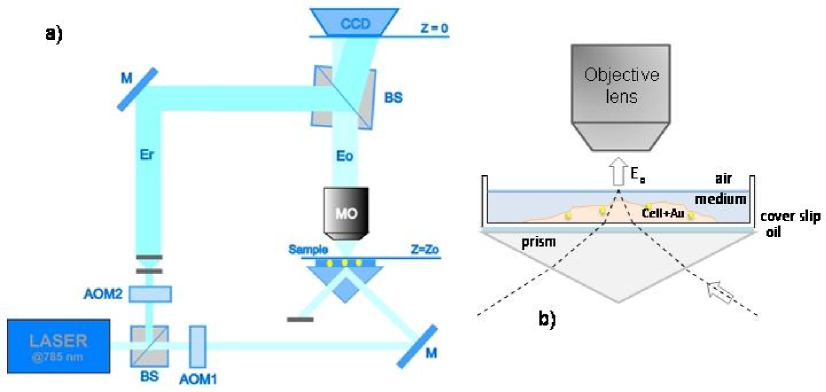 |
Fig.2 illustrates the optical setup. The illumination source is a single-mode near infrared laser diode emitting at nm (DL7140-201S 80 mW Laser Diode 90 mA current). A polarizing beam splitter cube (PBS) is used to split the original illumination laser light into two beams, a reference beam (complex field , frequency ) and an object illumination beam (complex field , frequency ) forming the two arms of a Mach-Zehnder interferometer. A combination of a half wave plate and two neutral density filters is used to prevent the saturation of the detector by controlling the optical power traveling in each arm. Two acousto-optic modulators (AOM1, AOM2) driven around 80 MHz and using the first order of diffraction, shift both frequencies at respectively and .
The object beam illuminates the sample, prepared as described in Section 2.1, by provoking total internal reflection (TIR) at the medium-air interface in order to prevent direct illumination light from entering the system. The evanescent wave locally frustrated and the illumination wave directly scattered by the beads and cells give off a propagating scattered wave (complex field ), which is collected by a microscopic objective (MO, magnification, NA=0.5, air). A beam splitter is then used to combine the scattered object wave and the reference wave which is slightly angularly tilted () with respect to the propagation axis of the object wave in an off-axis configuration. A half wave plate on the object illumination arm aligns the polarization of the corresponding beam ensuring its optimal interference with the reference beam. A CCD camera (Roper Cascade 512F, square pixels of 16 m size, exposure time 100 ms, frame rate = 8 Hz) detects the interference pattern (hologram) and sends it to a computer. The hologram is then numerically treated and the complex field is reconstructed numerically.
2.3 Holographic acquisition
In order to filter out unwanted parasitic signals, we use a heterodyne modulation. A four-phase demodulation method is used to record holograms. This method consists in acquiring a sequence of images with a relative phase shift between two consecutive frames. The reference wave is frequency shifted by tuning the two acousto-optic modulators AOM1 and AOM2 as done by LeClerc et al (2000), and we get, as shown by Atlan et al (2007), an accurate phase shift that simplify the phase shifting digital holography demodulation. The heterodyne beat frequency is thus:
| (1) |
where 8Hz is the frame rate frequency of the CCD camera. The camera records a sequence of 32 frames ,…,, and the object field E on the CCD plane () is given by:
| (2) |
where , and is the number of frames used for the reconstruction. In Eq.2, the coordinates (with ) are integers, which represent the pixel location within the CCD plane. The pixel size is then the physical CCD pixel size, i.e. 16 m.
2.4 Holographic reconstruction
The problem of the reconstruction in the context of holographic microsopy has been discussed in details by Colomb et al (2006a) and Colomb et al (2006b). Nevertheless, the Colomb et al. method refers implicitly to the phase-contrast imaging of Marquet et al (2005), and is not well suited to the reconstruction of the 3D image of a wave-field as done by Grilli et al (2001). Here, to get a 3D image of the wave-field scattered by the gold particle, we have used a slightly different reconstruction method, which is inspired from the reconstruction method used by Mann et al (2005).
First, we considered that the measured hologram represents the field within the CCD conjugate plane with respect to the Microscope Objective (MO), i.e., the plane, whose image is on focus on the CCD detector. Since we image the sample through a microscope objective MO, we must compensate the phase curvature, the phase tilt and the enlargement factor that are related to the presence of MO as disccused by Colomb et al (2006b). We have thus:
| (3) |
where and are the tilt and lens parameters respectively that must be determined.
We measured these parameters (or compensated their effect) by an original method that consists in reconstructing the image of the microscope objective output pupil by the one Fourier transform reconstruction method of Schnars and Jüptner (1994). The lens parameters is then close to the lens parameter that is used in the pupil reconstruction by the Schnars and Jüptner (1994) method. On the other hand the tilt parameters are compensated by translating the pupil Schnars and Jüptner (1994) image in the center of the calculation grid.
The properly compensated measured hologram represents then the field in the conjugate plane . Then, as done by Mann et al (2005) in holographic microscopy, the field in the vicinity of the conjugate plane (i.e. for ) is calculated by the angular spectrum method, which involves two Fourier transforms (see for example LeClerc et al (2000), LeClerc et al (2001) or Yu and Kim (2005)). This method is chosen here since it keeps the pixel size constant whatever the reconstruction distance is.
The pixel size , which must be calibrated to make a quantitative analysis of the holographic data, is measured by imaging with the same setup geometry a calibrated USAF target located in the CCD conjugate plane. We get nm. The reconstruction is then done for 512 different reconstruction distances
| (4) |
where nm and . By this way, we get 3D volume images with voxels, with the same pixel size ( nm) in the 3 directions and .
3 Results and Discussion
We have studied different samples of gold marked cell, unmarked cells and of free 40 nm gold particles.
3.1 Samples of marked cells
|
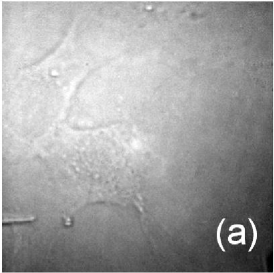
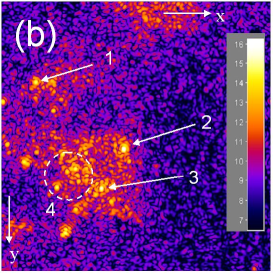
Figures 3 show the images of a first sample, with two cells and several particles. Figure 3(a) shows a direct white light illumination image of the sample. The two cells can be seen, but the contrast is low. Figure 3 (b) shows the intensity holographic image of the same region of the sample reconstructed in the or conjugate plane (here and in the following we will express the , and coordinates by the corresponding pixel index , and ). The display is made in logarithmic color scale.
Because of the variation of the refractive index within the cells, the illumination light is diffracted yielding a speckle pattern that is superimposed with the particle signal. This speckle is visible on Fig. 3 (b), and, from the envelope of the speckled zone, one can guess the shape of the cells. We interpret the brightest points 1, 2 and 3 of Fig. 3 (b), which correspond to maximum intensities , , and and Digital Count (DC) respectively, as being particles signal. Many other bright points are also visible, but it is not simple to determine, which points are particles, and which are speckle hot spots. This is especially true within circle 4, where many bright points, close together, are visible.
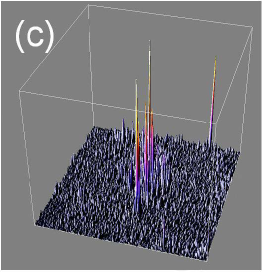
To better visualize the 40 nm gold particles, we have displayed, on Fig. 3 (c), by using the Interactive 3D Surface Plot plug-in of Image J (see Abramoff et al (2004)), a 3D linear surface plot of the region of the sample that is displayed on Fig.3 (b). As seen, the particles that correspond to sharp peaks can be easily visualized, but some ambiguity remains around the meaning of the lower peaks, which could be attributed either to particles, noises, or scattering by biological features of the cell.
|
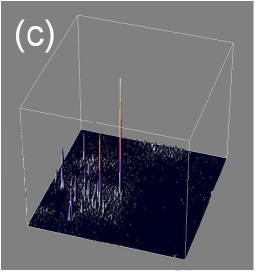
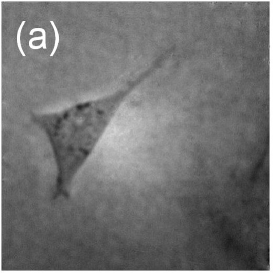
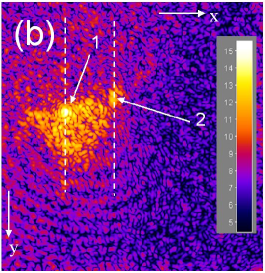
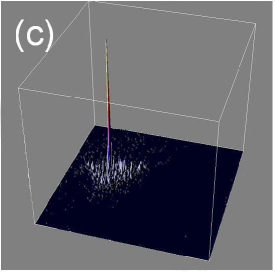
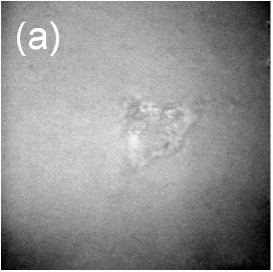
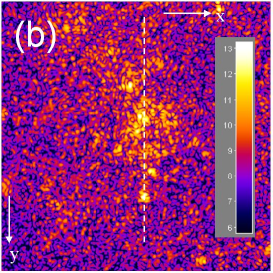
The images of Fig.4 are obtained for a second sample with a single cell, and, as we will see, a single gold particle. Figure 4 (a) shows a white light image of the sample. One can see the cell, whose shape is triangular. Figures 4 (b) shows the intensity holographic image reconstructed for (i.e. 6.93 m above the conjugate plane), with logarithmic color scale display. Here again, the speckle related to the light diffracted by the cell is visible on Fig.4 (b), and one can guess the triangular shape of the cell. The brightest point (arrow 1 on Fig. 4 (b)) is interpreted as a particle. Since the illumination intensity and focusing area is not well controlled, the particle maximum intensity DC obtained here is noticeably lower than for the first sample. Nevertheless, the signal obtained for the bright point marked by arrow 2 is more than 10 times lower (i.e. ), so we can interpret it as a speckle hot spot. This result is confirmed by Fig. 4 (c) that shows a 3D linear surface plot of the sample.
|
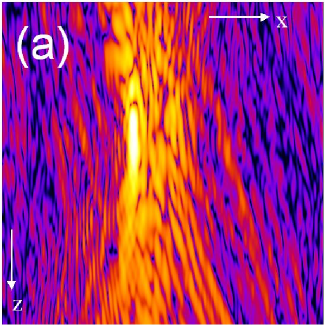
To go further, and to better characterize the particle’s signal with respect to hot spots, we have analyzed the 3D images of the wave-field obtained by performing the holographic reconstruction for the 512 different reconstruction distances of Eq.4. The 3D data were displayed using the Volume Viewer plug-in of Image J, which is able to display cuts of 3D data in arbitrary planes. By using this plug-in, we have performed cuts parallel to the plane of incidence of the sample illumination beam (see Fig.2 (b) ).
Figure 5 (a) shows the image of a cut made in the plane , which intersects the particle signal 1 of Fig.4 (b). The particle is seen as a bright spot on the cut image. We can notice here that the particle signal is located at coordinate, which corresponds to the reconstruction plane of Fig.4 (b). This is expected, since we have chosen to display on Fig.4 (b) the plane where the maximum intensity is reach in 3D, and since this maximum correspond to the particle we consider here.
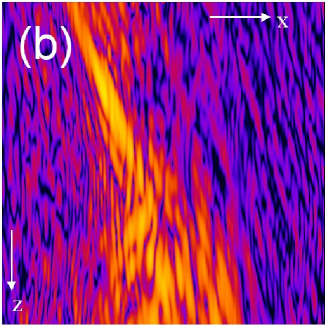
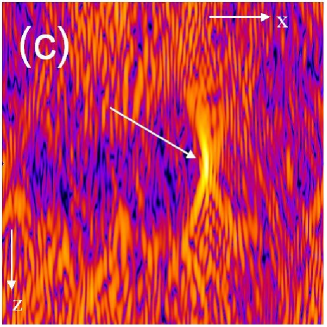
The image of Fig.5 (b) corresponds to i.e. to a cut that intersects the bright spot 2 of Fig.4 (b) we interpret as a speckle hot spot. Contrarily to the particle, the hot spot signal extension along the axis (vertical axis on the Fig.5 images) is quite large. Moreover, the hot spot image is angularly tilted in the plane.
This angular tilt can be simply interpreted by describing how the light propagation is governed in the biological cells. This propagation is dependant on the phase function inside the illuminated cell. Because biological tissues are inhomogeneous, the form of their phase function is not well defined and is thus characterized by the anisotropy coefficient g, which is the average cosine of the phase function. This parameter g describes the asymmetry of the single scattering pattern ; it is thus null when the scattering is isotropic, equals 1 for forward scattering and equals -1 in the case of backward scattering. In our experiments, the illuminated cells are maintained in DMEM medium that consists mainly of water. Since the refractive index of cells is close to that of water, the cell anisotropy factor g is close to one ( in biological tissues as mentioned by Cheong et al (1990)). As a consequence, the light scattered by the cells mainly follows the forward scattering regime and the observed light scattering pattern appears to be tilted by approximately 45∘ since the incident illumination laser beam is initially tilted by 45∘ in conformity with the TIR illumination geometry (see Fig.2 (b)).
The exact shape of the hot spot’s wave-field can be calculated, but it is quite complicated. It involves the calculation of the angular distribution of the scattered light, which depends on the cell anisotropy factor . One must then calculate the refraction of the scattered light on the medium-air interface, and take into consideration the collection of light by the microscope objective. The quantitative analysis of the wave-field’s shape, which yields the angular tilt, is thus out of the scope in the present paper, and one can simply say that the hot spot signal keeps some memory of the illumination direction, and is thus angularly tilted in the plane.
One can notice that a similar angular tilt effect has been observed recently on the photothermal signal of 50 nm and 10 nm gold particles by Absil et al (2010).
3.2 Control experiments performed on free particles or on unmarked-cells
In order to confirm our interpretation of the angular tilt seen on Fig.5 (b), we have performed some control experiments by imaging an unmarked cell sample and another sample of free gold particles.
3.2.1 Unmarked cell sample
|
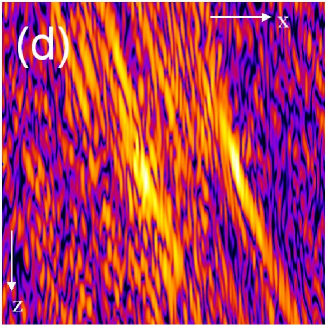 |
Fig.6 shows the results obtained with a cell sample without particle. The direct white light image is shown in Fig. 6(a). Figure 6(b) shows the holographic intensity reconstructed image that shows the light scattered by the cell refractive index inhomogeneities. This scattered light, which has a speckle structure, exhibits several hot spots that correspond to bright points on Fig.6(b), and we have chosen to image on Fig.6(b) the reconstruction plane that corresponds to the maximum hot spot intensity ( DC).
The image we get here without particles is visually quite similar to Fig.3(b) which is obtained with several particles. The 3D linear surface plot shown in Fig.3(c) does not help since it is visually similar to Fig.3(c). Nevertheless, the maximum of the bead signal ( DC) in Fig.3(b) and (c) is much higher than the maximum of the hot spot signal ( DC) in Fig.6(b) and (c). This makes the background noise visually higher in Fig.6(c).
Figure 6(d) shows the image obtained by performing a cut in the plane that intersects the two brightest speckle hot spots of the sample. Now the image obtained in Fig. 6(d) without particle is qualitatively different than with a particle in Fig. 5(a). The signal is angularly tilted like in Fig. 5(b), and its extension in the direction (vertical axis) is larger.
3.2.2 Free particles sample
|
 |
The images of Fig.7 are obtained for free particles (uncoupled to cells) in brownian motion in a water and agarose suspension. Here, we used agarose to slow down the motion of the particles enough to make the displacement of the particles negligible during the time of acquisition of the sequence of frames.
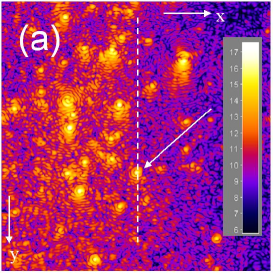
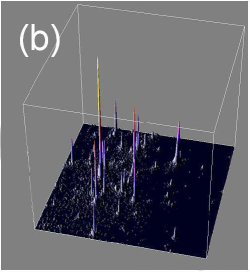
Figure 6(a) is the holographic intensity reconstructed image. The brightest points correspond to particles that are located within the reconstruction plane, while the less bright points are interpreted as out of focus particles. Reconstruction is made here in the plane which corresponds to the maximum intensity ( DC) for the brightest spot (marked by a white arrow on Fig.6(a)). Many particles can be seen on Fig. 6(a) and on Fig. 6(b) that displays the holographic data with 3D linear surface plot.
Figure 6(c) shows the image in the plane that intersects the brightest particle and corresponds to the white dashed line on Fig.6(a). As expected, the image of the particle (white arrow) has a smaller extension along the direction (vertical direction) and does not exhibit the angular tilt we get with speckle hot spot in Fig.5(b) and Fig.6(d). This result confirms our interpretation of the angular tilt observed with the speckle hot spots.
4 Conclusion
To summarize, we have shown that heterodyne holographic microscopy, in the off-axis geometry, is well adapted to the detection of weakly scattering objects. The sensitivity, signal to noise ratio and selectivity of the technique allow the localization of light-scattering gold nanoparticles of a few tens of nanometers, which are good candidates of non-toxic and perennial markers. Biological environments, however, are difficult to address since cell features generate strong parasitic speckle. Here, we have reported the detection of 40 nm particles attached to the surface of live 3T3 mouse fibroblasts. A comparison of these signals with either non-labelled cells or simple gold particles in solution allowed us to unambiguously discriminate particles. We show that, in addition to a stronger scattering signal, gold particles induce a relatively isotropic scattering, whereas biological features are characterized by mostly forward scattering. This dissimilarity in the scattering patterns, explained by the inconsistency of the refractive indexes and anisotropy parameters g, is easily characterized by digital holography, making it an excellent tool for the 3D detection of gold labels in biological environments.
Acknowledgements.
Authors wish to acknowledge the French Agence Naionale de la Recherche (ANR) and the Centre de Compétence NanoSciences Ile de France (C’nano IdF) for their financial support.References
- Abramoff et al (2004) Abramoff M, Magalhaes P, Ram S (2004) Image processing with ImageJ. Biophotonics International 11(7):36–43
- Absil et al (2010) Absil E, Tessier G, Gross M, Atlan M, Warnasooriya N, Suck S, Coppey-Moisan M, Fournier D (2010) Photothermal heterodyne holography of gold nanoparticles. Opt Express 18:780–786
- Atlan et al (2007) Atlan M, Gross M, Absil E (2007) Accurate phase-shifting digital interferometry. Opt Lett 32:1456–1458
- Atlan et al (2008) Atlan M, Gross M, Desbiolles P, Absil É, Tessier G, Coppey-Moisan M (2008) Heterodyne holographic microscopy of gold particles. Optics letters 33(5):500–502
- Boyer et al (2003) Boyer D, Tamarat P, Maali A, Lounis B, Orrit M (2003) Photothermal imaging of nanometer-sized metal particles among scatterers. Science 297:1160–1163
- Cheong et al (1990) Cheong W, Prahl S, Welch A (1990) A review of the optical properties of biological tissues. IEEE journal of quantum electronics 26(12):2166–2185
- Cognet et al (2002) Cognet L, C Tardin C, Boyer D, Choquet D, Tamarat P, Lounis B (2002) Single metallic nanoparticles imaging for protein detection in cells. Proc Natl Acad Sci 100:11,350–11,355
- Colomb et al (2006a) Colomb T, Cuche E, Charrière F, Kühn J, Aspert N, Montfort F, Marquet P, Depeursinge C (2006a) Automatic procedure for aberration compensation in digital holographic microscopy and applications to specimen shape compensation. Applied optics 45(5):851–863
- Colomb et al (2006b) Colomb T, Montfort F, Kuehn J, Aspert N, Cuche E, Marian A, Charriére F, Bourquin S, Marquet P, Depeursinge C (2006b) Numerical parametric lens for shifting, magnification, and complete aberration compensation in digital holographic microscopy. J Opt Soc Am A 23:3177–3190
- Goldberg and Burmeister (1986) Goldberg D, Burmeister D (1986) Stages in axon formation: observations of growth of Aplysia axons in culture using video-enhanced contrast-differential interference contrast microscopy. Journal of Cell Biology 103(5):1921
- Grilli et al (2001) Grilli S, Ferraro P, De Nicola S, Finizio A, Pierattini G, Meucci R (2001) Whole optical wavefields reconstruction by digital holography. Optics Express 9(6):294–302
- Jain et al (2006) Jain P, Lee K, El-Sayed I, El-Sayed M (2006) Calculated absorption and scattering properties of gold nanoparticles of different size, shape, and composition: applications in biological imaging and biomedicine. J Phys Chem B 110(14):7238–7248
- Lasne et al (2006) Lasne D, Blab GA, Berciaud S, Heine M, Groc L, Choquet D, Cognet L, Lounis B (2006) Single nanoparticle photothermal tracking (SNaPT) of 5-nm gold beads in live cells. Biophys J 91:4598–4604
- LeClerc et al (2000) LeClerc F, Collot L, Gross M (2000) Numerical heterodyne holography with two-dimensional photo-detector arrays. Opt Lett 25:716–718
- LeClerc et al (2001) LeClerc F, Gross M, Collot L (2001) Synthetic-aperture experiment in the visible with on-axis digital heterodyne holography. Opt Lett 26:1550–1552
- Mann et al (2005) Mann CJ, Yu L, Lo CM, Kim MK (2005) High resolution quantitative phase-contrast microscopy by digital holography. Opt Express 13:8693–8698
- Marquet et al (2005) Marquet P, Rappaz B, Magistretti P, Cuche E, Emery Y, Colomb T, Depeursinge C (2005) Digital holographic microscopy: a noninvasive contrast imaging technique allowing quantitative visualization of living cells with subwavelength axial accuracy. Optics letters 30(5):468–470
- Schnars and Jüptner (1994) Schnars U, Jüptner W (1994) Direct recording of holograms by a CCD target and numerical reconstruction. Applied Optics 33(2):179–181
- Sönnichsen et al (2000) Sönnichsen C, Geier S, Hecker N, Von Plessen G, Feldmann J, Ditlbacher H, Lamprecht B, Krenn J, Aussenegg F, Chan V, et al (2000) Spectroscopy of single metallic nanoparticles using total internal reflection microscopy. Applied Physics Letters 77:2949
- Warnasooriya et al (2010) Warnasooriya N, Joud F, Bun P, Tessier G, Coppey-Moisan M, Desbiolles P, Atlan M, Abboud M, Gross M (2010) Imaging gold nanoparticles in living cell environments using heterodyne digital holographic microscopy. Opt Express 18:3264–3273
- West et al (2006) West JL, Drezek RA, J HN (2006) Nanotechnology provides new tools for biomedical optics. In: Bronzino JD (ed) Tissue Engineering and Artifical Organs, 3rd Edition, CRC Press, pp 25–1–25–9
- Yu and Kim (2005) Yu L, Kim M (2005) Wavelength-scanning digital interference holography for tomographic three-dimensional imaging by use of the angular spectrum method. Opt Lett 30:2092–2094