Highly focused supersonic microjets
Abstract
The paper describes the production of thin, focused microjets with velocities up to 850 m/s by the rapid vaporization of a small mass of liquid in an open liquid-filled capillary. The vaporization is caused by the absorption of a low-energy laser pulse. A likely explanation of the observed phenomenon is based on the impingement of the shock wave caused by the nearly-instantaneous vaporization on the free surface of the liquid. An experimental study of the dependence of the jet velocity on several parameters is conducted, and a semi-empirical relation for its prediction is developed. The coherence of the jets, their high velocity and good reproducibility and controllability are unique features of the system described. A possible application is to the development of needle-free drug injection systems which are of great importance for global health care.
- Subject Areas
-
Fluid dynamics
pacs:
Valid PACS appear hereI Introduction
Transient liquid jets produced by flow focusing have been studied from various perspectives due to fundamental interest and their widespread occurence (see e.g. the review article by Eggers and Villermaux (2008)).
Common instances include bubbles bursting at a liquid surface Duchemin et al. (2002); Longuet-Higgins (1983), high amplitude Faraday waves Longuet-Higgins (2001); Longuet-Higgins & Dommermuth (2001b, a); Zeff et al. (2000); Goodridge et al. (1999), jets generated by the impulsive acceleration of a liquid surface Antkowiak et al. (2007), shaped charges, and others.
In all these cases, the jet is produced when a liquid surface concave towards the gas is impulsively accelerated.
The resulting “kinematic focusing” of the liquid, which converges towards the center of the curvature, is responsible for the peculiarly high-speed jets generated in this way.
In shaped charges this convergence is caused by a detonation wave investing the free surface. The early history of these devices and the principle on which they operate is described by Birkhoff et al. (1948), followed by many works, e.g., Curtis and Kelly (1994); Petit et al. (2005) in more recent years.
The focusing, however, can also be caused by geometrical effects simply due to the concave shape of the interface without reliance on liquid compressibility (see e.g. Longuet-Higgins & Oguz (1995); Bergmann et al. (2006, 2009); Thoroddsen et al. (2007); Gekle (2009); Gekle and Gordillo (2010)).
In this study we describe yet another way for the generation of such a jet. We use a microtube in which the impulsive acceleration of the interface is due to the abrupt vaporization of a small mass of liquid caused by the absorption of a laser pulse.
Bubble generation by the absorption of a focused laser pulse in the bulk of a
liquid volume has been an established experimental technique for a long time
(see e.g. Laterborn et al. (1999); Vogel et al. (2003)). More
recently, the same technique has been used to generate bubbles in the
proximity of the free surface of a liquid Apitz et al. (2005); Obreschkow et al. (2006); Robert et al. (2007); Thoroddsen et al. (2009).
In this case, strong jets are often observed. For example, Thoroddsen et al. (2009), who focused a laser pulse into a drop resting on a glass surface, report jet maximum velocities of 250 m/s produced by small bubbles near the free surface, but without the ability to control the number, size and location of these bubbles.
In the present work we also use a laser pulse to create a bubble near a free
surface, but the geometry of the system and condition of the experiment
are quite different from those of earlier workers. Furthermore, the microjet
that we describe has extraordinary characteristics: it is created under
controlled condition with good reproducibility; its maximum velocity reaches
850 m/s, namely a Mach number in air approaching 3; its diameter is typically one order of magnitude smaller than the diameter
of the capillary tube; its generation requires moderate
laser energies of the order of 10 J, comparable to the
typical energy of a laser pointer.
A potential particularly attractive application of the present supersonic microjets is for needle-free drug injection Mitragotri (2006).
For this application, in which a liquid solution containing a drug is forced to penetrate human or animal tissue through the skin, ultra-high velocities (greater than 200 m/s), fine scales (down to 30 m), and good reproducibility and controllability are essential.
The development of needle-free drug injection systems is of paramount importance in the global fight against the spread of disease as these systems help preventing contamination by needles.
Several methods of microjet generation suitable for this application have been proposed (Han & Yoh (2010); Menezes et al. (2009)), but they all have several shortcomings: the production of each jet requires a siginificant amount of energy, the resulting shape of the ejected liquid mass tends to be diffuse rather than focused, the small size-nozzles are easily clogged and others.
The microjets produced by the method described in this study are free from these problems.
In particular, they are faster and highly focused. Furthurmore, the avoidance of very thin nozzles makes the systems less susceptible to clogging, thus improving the reliability and controllability.
The experimental setup is presented in § II, followed by a description of jet formation and evolution in § III.
The quantitative dependencies of the jet speed on the various control parameters are discussed in § IV, culminating in a scaling law for the jet velocity as a function of the various parameters.
The paper ends with summary and conclusions in § V.
II Experimental setup and control parameters
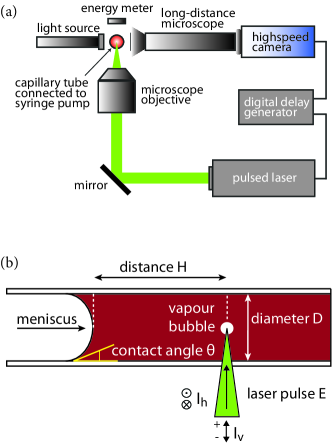
Figure 1(a) shows a sketch of the whole experimental setup, which is similar to that used by Sun et al. (2009). One end of the capillary tube is connected to a syringe pump (Model PHD 2000, Harvard Apparatus, USA) containing a water-based red dye. The other end is open to the air. A 532 nm, 6 ns laser pulse (100 mJ Nd:YAG laser, Solo PIV, New Wave, USA) is focused through a microscope objective to a point inside the capillary. The laser energy is monitored by means of an energy meter (Gentec-eo XLE4 or Gentec-eo QE12SP-S-MT-D0, Canada) placed behind the capillary. The energy absorbed by the liquid was calibrated by measuring the difference between the readings of the meter with the glass tube filled with the dyed and clear water. The jet formation was recorded using high-speed cameras with a frame rate of up to fps (HPV-1, Shimadzu Corporation, Japan and SA1.1 and Photron, USA). The minimum inter-frame and exposure times were 1s and ns respectively. This system enabled us to observe the capillary from below using a microscope (Axiovert 40 CFL, Carl Zeiss, Germany). A long-distance microscope (Model K2, Infinity, USA) with a maximum magnification of was connected to the camera in order to capture the jet formation from the side and vary the field of view by adjusting the magnification.
Illumination for the camera was provided by a fibre lamp (ILP-1, Olympus, Japan) emitting light that passed through the filter protecting the camera. A digital delay generator (Model 555, Berkeley Nucleonics Corporation, USA) was used to synchronise the camera and the laser. Images were analysed with tracking software.
The experimental parameters are indicated in figure 1(b) together with a side view of the capillary. The distance between the meniscus and the laser focus position is , is the absorbed laser energy, is the initial contact angle of the liquid with the glass capillary with diameter ; is the distance offset of the laser focus with respect to the capillary axis along a vertical diameter, positive when the focus is beyond the tube axis; is the focus offset of the laser perpendicular to the tube axis and the diameter along which is measured. Borosilicate glass capillary tubes (Capillary Tube Supplies Limited, UK) of three different sizes were used in the experiments, with inner diameters of 50, 200 and 500m and outer diameters of 80, 220 and 520m, respectively. The tip of the capillary tube was dipped in a hydrophobic solution (1H, 1H, 2H, 2H-Perfluorooctyltrichlorosilane) to pin the contact line and permit a control the contact angle between and . For uncoated tubes, the initial contact angle was found to be , which is similar to the data reported by Sumner et al. (2004) for borosilicate glass. The range of the control parameters is summarised in table I.
| (J) | (m) | (m) | (mm) | (mm) | ||
|---|---|---|---|---|---|---|
| Lower limit | 20∘ | 19 | 50 | -1 | 0 | |
| Upper limit | 90∘ | 880 | 500 | 2.5 | 0.1 |
III Jet formation and evolution
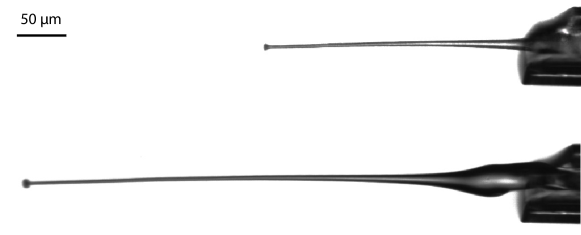
An example of a supersonic jet visualized using the technique of dual-flash illumination by laser-induced fluorescence van der Bos et al. (2011) is shown in figure 2. The capillary is on the right, the jet tip is on the left, and the jet travels from right to left with a speed of 490 m/s. The tip of this jet has grown into an almost spherical mass which will eventually detach as a droplet. At the other end, the jet is thicker and slower.
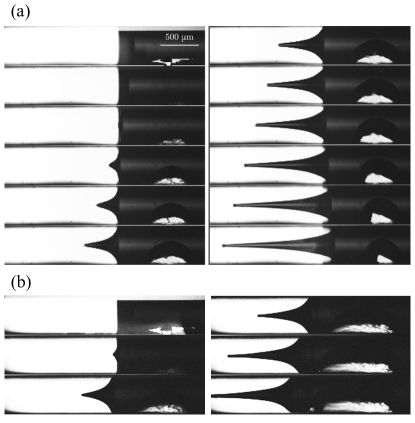
Figures 3(a) and (b) show successive frames taken with the Shimadzu camera of the jet produced in a 500 m tube by using laser energies of 365 J and 650 J.
The bubble growth is larger in the second case and the motion of the liquid column in the tube is more evident.
The use of this larger capillary produces relatively slow jets with asymptotic velocities of 21 m/s and 55 m/s, respectively, which facilitates the visualization.
The open end of the tube is on the left; the other end is connected to the syringe pump as explained before.
The bubble is generated near the lower wall of the capillary and mainly expands in the direction of the open end.
In spite of this off-center position and asymmetric growth, the jet maintains an axisymmetric shape with a sharp tip.
Its diameter is always much smaller than that of the capillary.
In this instance, it is 50 m, about 10 times smaller than the capillary.
The beginning of the instability which eventually leads to droplet pinch off can be discerned.
We have always found that, unless the bubble is generated less than one diameter away from the free surface (), the asymmetry of its growth does not affect the axial symmetry of the jet.
This observation supports the hypothesis that the cause of the thin jet is the sudden onset of a high pressure rather than the bubble expansion per se.
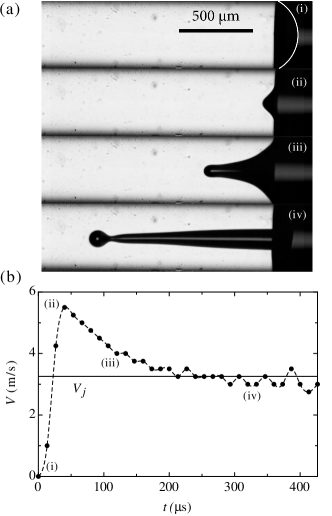
Figure 4(a) shows another typical sequence of jet evolution. The corresponding history of the jet tip velocity is shown in Figure 4(b) and it is seen to be non-monotonic.
Immediately after the laser pulse, the interface sets into motion (i).
The maximum velocity occurs when a well formed jet just begins to appear as shown in image (ii), by which time the meniscus has lost the initial concave shape. This feature is observed irrespective of the jet speed, and is therefore compatible with the hypothesis of kinematic focusing due to the initial concave shape of the interface.
The subsequent deceleration (iii) is due to surface tension as suggested by the fact that the deceleration is suppressed at higher velocities, i.e., higher Weber numbers. As the jet becomes thinner, the rate of new surface generation decreases, surface tension becomes less important, and the jet tip velocity reaches an asymptotic value ; shortly thereafter a drop starts to form at the tip (iv) and it eventually detaches.
It is worth mentioning that a very small fraction of the liquid receiving the initial impulse and focusing into the jet is in contact with the wall, and therefore its motion is not significantly affected by contact line phenomena.
In any event, since the process is very rapid, such phenomena can only affect a thin liquid layer of the order of the viscous penetration length, which can be estimated as less than 5 m.
Most of the liquid is therefore essentially in an inertia-dominated, nearly inviscid motion and is not significantly affected by contact line phenomena.
IV Parameter dependence
In this section, we study the dependence of the jet speed on various control parameters.
IV.1 Contact angle
Since the concavity of the meniscus is crucial for the jet formation, the first parameter we investigated is the initial radius of curvature of the free surface. This quantity, which was determined by fitting a circle to the image of the free surface, is related to the contact angle of the liquid with the capillary by the formula
| (1) |
which is valid because the effect of gravity in this system is negligible as shown by the smallness of the Bond number (where is the liquid density, surface tension coefficient, and the acceleration of gravity) typically of the order of 10-3.
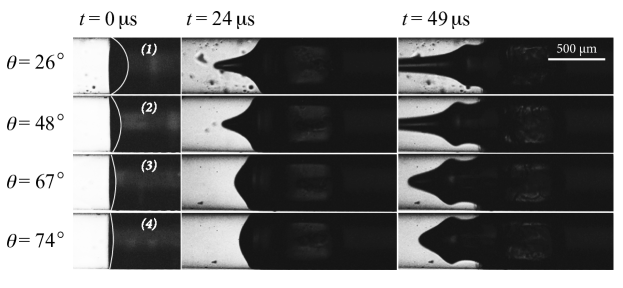
The initial radius of curvature is varied by minor adjustments of the liquid volume by means of the syringe. For these tests, the laser focus was on the tube axis and the energy and the distance between focus position and meniscus are kept constant at J and m, respectively; experiments are carried on 500 m diameter tubes.
Figure 5 shows four sequences taken with different initial contact angles, with three snapshots per sequence. The shape of the jet is significantly influenced by the radius of curvature. These results show that the more curved the meniscus shape (smaller radius of curvature and lower initial contact angle), the higher the jet velocity due to the increased focusing. For increasing initial contact angles, the jet becomes thicker and less focused. Eventually, when the initial contact angle is 90 degrees or larger, the focusing is lost, no jet is formed and the liquid is only pushed out as a plug by the expanding bubble.
These results confirm that the initial shape of the meniscus plays an important role for the acceleration of the jet as discussed in section III.
For a quantitative analysis, we derive a scaling of the velocity increment due to the flow focusing as follows.
We assume that, due to the initial high pressure pulse, the liquid acquires a velocity normal to the initial free surface and the surface tension is negligible.
After a short time , the free surface is still spherical with a smaller radius .
The new velocity acquired due to this geometrical focusing can be estimated from the principle of mass conservation as
| (2) |
Neglecting a higher order term, we obtain the scale of the velocity increment as
| (3) |
Since the focusing effect is caused by the liquid particles approaching the axis of the tube, it occurs on a characteristic length scale of the order of the mean distance between the free surface of the liquid and the axis, which is of the order of the tube diameter . Thus the time scale for the geometrical focusing can be estimated as
| (4) |
This estimate is supported by the fact that, as described in § III, the acceleration due to the focusing occurs approximately until the meniscus loses the concave shape. Thus, upon combining eqs. (1), (3), and (4), the increase in velocity due to flow focusing can be estimated as
| (5) |
Thus, the velocity resulting from the focusing may be expected to be given by
| (6) |
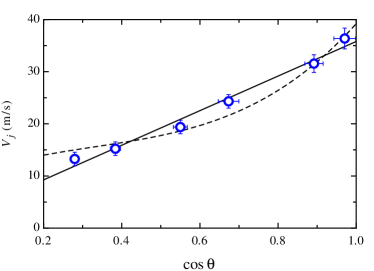
As shown in figure 6, this relation provides a reasonable fit to the data taken in the 500 m tube by taking 13 and 2.5 m/s. A more elaborated model will be described in Peters et al. (2012).
The curve suggested by Antkowiak et al. (2007) is also shown in figure 6.
Although, unlike the previous model which estimates the asymptotic jet velocity, the latter model is aimed to describe the initial velocity of the jet, its trend agrees with the present experimental data.
If the initial velocity is due to the reflection of a shock wave from the free surface, the strength of the shock can be estimated as , where is the speed of sound in the liquid.
With the previous value of we find 20 atm.
The initial velocity for the incompressible model can be estimated by assuming that it is acquired during a short time by the action of an over-pressure .
If the laser focus is at a distance from the free surface, this arguments leads us to
Ory et al. (2000). With = 460 m, = 2.5 m/s, and = 6 ns, this estimate gives 2000 atm, which is larger than the critical pressure of water, 218 atm.
For higher velocity cases, the incompressible pressure estimate increases considerably Peters et al. (2012).
IV.2 Distance between laser focus and free surface
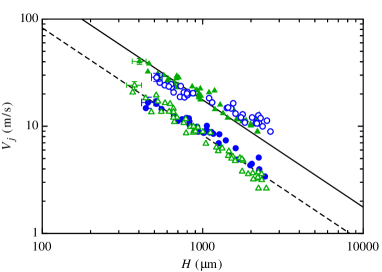
Figure 7 shows the experimental results for the asymptotic jet tip velocity , defined in figure 4, as a function of the distance between the laser spot and the free surface (see figure 1b).
Two different capillary tubes with diameters of 200m and 500m, and two different energy levels for each, 165 J and 232 J, and 305 J and 458 J, respectively, were used.
The data shows that, for both tube diameters, is inversely proportional to the distance over a decade.
This dependence is particularly well satisfied at the lower energy levels.
It seems possible to rationalize this observation both on the basis of the incompressible flow focusing model and of the shock wave model.
In the framework of the former, one may note that the mass of the liquid slug set into motion is approximately proportional to , and therefore so is its inertia.
In the framework of the shock wave mechanism, on the other hand, we recall that the pressure amplitude of a locally generated shock wave in a free fluid decreases inversely with the distance.
In our conditions, the fluid is confined within the tube but the size of the initially vaporized liquid is at least one order of magnitude smaller than the tube diameter so that this geometrical attenuation may play a role.
Another possibility is that there is viscous attenuation of the shock due to the no-slip condition at the tube wall (see e.g. Mirshekari and Brouillette (2009); Ngomo et al. (2010)).
Whatever the reason for the decreasing the shock pressure with increasing distance , since the experiments show that the velocity is inversely proportional to the distance, this suggests that the velocity is proportional to the pressure.
IV.3 Absorbed energy
The next parameter of interest is the energy absorbed by the liquid.
For this part of the study, the laser focus is on the tube axis and its distance from the meniscus was kept constant at m, m, and m for the 50m, 200m, and 500m diameter tubes, respectively.
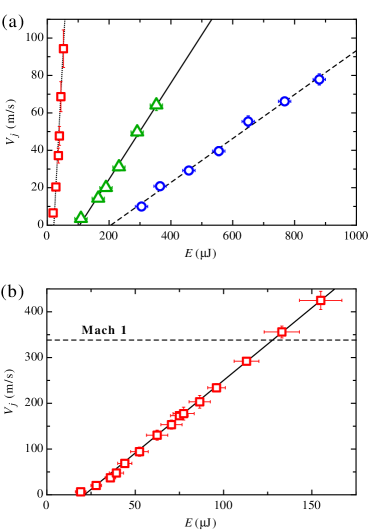
Figure 8(a) shows the asymptotic jet velocity vs. the absorbed energy for different tube diameters.
The data are well fitted by a linear function with a positive intercept at . This feature embodies the existence of a threshold below which no jet is formed.
The threshold values for the 50m, 200m, and 500m capillary tubes are approximately 20J, 100J, and 200J, respectively.
Thus, the threshold value is an increasing function of the tube diameter .
It is interesting to note that, for the 50m capillary tube, the linear relation between and is preserved even when the jet speed becomes supersonic as shown in figure 8 (b).
The absorbed energy for all cases is of the order of 109 J/m3, which is of the same order as the vaporization enthalpy of water at normal conditions.
As noted before, in the framework of the shock wave model, the experimental results of § IV.2 suggest that the velocity is proportional to the pressure.
This linear relation would then imply that the pressure of the shock wave at the meniscus is proportional to the absorbed energy.
From the incompressible viewpoint, one may conclude that the initial impulse imparted to the liquid is proportional to the absorbed energy.
The slopes of the data for the 50m, 200m, and 500m diameter tubes are 3.09, 0.26, and 0.12 m/(sJ), respectively.
Thus, for the same absorbed energy, the jet speed decreases with increasing tube diameter.
The effects of the diameter on the jet velocity are discussed further in § IV.4.
In figure 8(b) no data points at higher could be acquired because in the current configuration the glass tube breaks at the point where the laser focuses when the energy is too high.
IV.4 Diameter of microcapillary
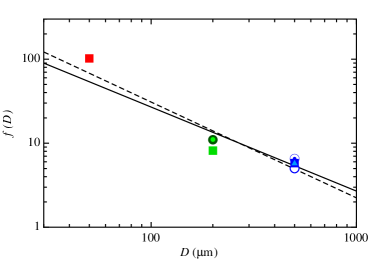
In the study of the dependence of the jet velocity on the tube diameter, it was necessary to adjust the energy ranges depending on the diameter. On the basis of the results reported above, it has been concluded that, to a good accuracy, is proportional to () and () and inversely proportional to . We express this dependency by writing
| (7) |
where the pre-factor embodies the dependence on the diameter. By trying a power law dependence, , the data is best fitted by -1.14, which may be considered close to -1.
Especially the data for the 200m and 500m tubes agrees well with the line of slope -1, while that for 50m is above the line with slope -1.
This could be attributed to the fact that different effects, such as laser focusing, start to play an important role at smaller tube sizes due to the higher curvature of the tube.
According to the impulse pressure description suggested by Antkowiak et al. (2007) and the analysis leading to eq. (5), the diameter of the tube should not play a role.
A possible reason for this dependence is that the same energy delivered to a smaller diameter tube will give rise to a faster jet due to a smaller inertia.
To strengthen this hypothesis it may be noted that, if the kinetic energy is constant for a given absorbed energy , since the mass of the accelerated liquid is approximately proportional to , it follows that the velocity would decrease proportionally to .
From the results that were presented in the previous sections, the following empirical law is then derived:
| (8) |
Calculating by fitting the data in figure 9 we get .
It is interesting to note that has the the dimensions of an inverse dynamic viscosity. This feature appears to be accidental as viscous effects are not expected to play a significant role as noted before.
IV.5 Focus offsets, and
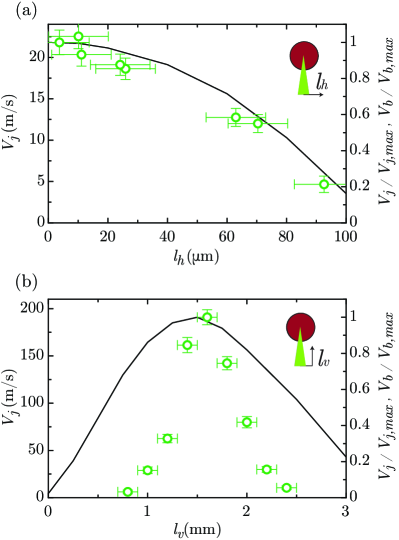
The sensitivity of the jet to the laser focus position relatively to the capillary axis was studied by displacing it in the horizontal () and vertical directions () (see figure 1b). The results are shown in figure 10.
Figure 10(a) indicates that the jet velocity decreases monotonically for increasing all other conditions being held constant. We hypothesize that this trend is explained by a reduced volume of the vaporized liquid. To test this hypothesis, the jet velocity is compared to the initial laser-induced vaporized volume as estimated with the geometrical optics approximation described in Appendix A. As shown in figure 10(a), the jet velocity roughly scales with the calculated volume of the liquid vaporized by the laser pulse.
Figure 10(b) shows the jet speed versus the distance of the focus from the axis of the tube . The jet velocity increases with increasing up to mm, and then decreases for larger .
The rise is likely caused by the larger area of the capillary tube surface illuminated by the laser, which increases as is increased by moving the laser towards the tube. As the vaporization always occurs at the capillary wall, a larger vapor mass will be created by increasing . However, when the laser is moved too close to the capillary, the energy per unit area of the laser beam decreases and eventually drops below the threshold required for bubble formation. This situation was also modeled by geometrical optics. As shown in figure 10(b), the maximum jet speed and maximum bubble size are found at the same offset. Even though the overall trend is the same, the normalized values of the vaporized volume deviate from those of the jet velocity.
This difference is not surprising since there is no reason to think that vaporized volume and jet growth are linearly related to each other. The analysis of these aspects is beyond the scope of this work; they will be studied in future investigations.
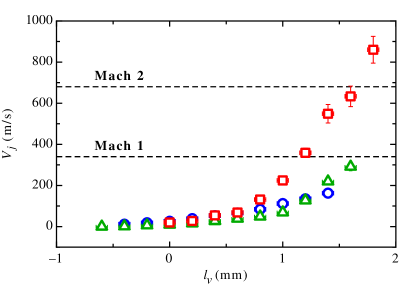
The velocity increase with increasing shown in figure 10(b) is found also for other tube diameters
as shown in figure 11, where the jet speed versus the vertical focus offset is plotted for different diameters down to 50m. Jets with a velocity up to 850 m/s could be consistently produced with the smallest capillaries.
Measurements beyond this velocity could not be obtained, as the gradual increase of the absorbing liquid volume with increasing eventually leads to such a violent bubble expansion that the capillary breaks.
We also observed that, at the higher energies, the wall shear stresses exerted by the liquid pushed out of the capillary by the expanding bubble after the thin jet formation is so large as to shear off the capillary tip. It is possible that, with different materials, the velocity of the jet can be increased. When the jet velocity approaches the speed of sound in water, some limitations to further increases may arise due to the dominance of compressibility effects.
V Summary and conclusions
The dynamics of the high-speed microjet generated by a laser-induced
rapid vaporization of water in a microtube has been studied. It has
been shown that the jets so generated can reach speeds as high
as 850 m/s with good controllability.
The dependence of the jet velocity upon various controlling
parameters has been investigated in a series of experiments the
results of which have been summarised in the empirical relationship
provided in equation (8). This equation shows the
effect of the distance between the laser focus and the liquid meniscus
at the mouth of the micro-tube, the absorbed laser energy, the
liquid-tube initial contact angle and the tube diameter.
The jet velocity exhibits an inverse proportionality to the tube diameter and
to the distance of the laser focus from the free surface, while it is
proportional to the absorbed energy above a threshold value.
The velocity is very strongly dependent on the curvature of the free surface,
which is a function of the tube-liquid initial contact angle.
It is also critically dependent on the amount of liquid vaporized and on its distance from
the free surface, both of which can be varied by varying the position
of the laser focus.
In particular, it has been found that the offset of the laser focus with respect to the tube axis has a strong and
very non-trivial effect.
To elucidate the origin of this result we have
used a geomterical-optics construction coupled with the Beer-Lambert law
to determine approximately the size of the region where vaporization
occurs and the absorbed energy. While still preliminary, the results of this
analysis are in general agreement with the data.
Further theoretical and numerical investigations of the jetting phenomenon will be addressed
in Peters et al. (2012).
A priori results of the paper can be interpreted according to two different scenarios, one in which the shock wave generated by the nearly instantaneous vaporization plays a dominant role, and one in which the phenomenon is essentially incompressible. The estimate of the overpressure provided for the relatively low-velocity case in § IV.3 suggests that, according to the incompressible model, a much higher pressure is necessary to account for the observations as compared to the shock wave model.
For higher velocity cases, the incompressible overpressure becomes even much larger than the critical pressure of water Peters et al. (2012).
These considerations lend support to the shock wave interpretation of the results presented in this paper.
The insights gained through this research and the ability to generate focused, controllable, and high velocity microjets open new doors for the realization, among others, of reliable needle-free drug delivery systems.
Acknowledgments
We thank Rory Dijkink for starting the experiments. We also thank Christophe Clanet, Alexander Klein, and Gerben Morsink for helpful discussions. We gratefully acknowledge the support of this work by FOM (Stichting voor Fundamenteel Onderzoek der Materie).
Appendix A Estimate of the liquid energy absorption by geometrical optics
A geometrical optics approximation was developed to analyze energy absorption of the laser beam energy absorption by the liquid. The three main components of this calculation are: (1) splitting up the Gaussian laser beam into many different rays each one with a representative energy; (2) following the path of each ray through the capillary, including (full or partial) wall-reflections; (3) using the Beer-Lambert law to model the local energy absorbed by the liquid. This law describes the local irradiance , and is given by , with the beam irradiance at the cylinder outer surface of the tube, the absorption coefficient, the arc length along the partial of the ray propagating in the liquid. The absorption coefficient was measured as ; the local energy loss of a ray equals .
The liquid volumes are discretized into cells constituting a grid around the central loss area. The local energy lost by each ray in each cell was calculated from the Beer-Lambert law and add to the liquid in the cell. Subsequently, for each cell, the total energy absorbed over the duration of the light pulse was compared with an estimate of the energy necessary for evaporation at room conditions, namely , with the liquid density, K the difference between the initial liquid temperature and the boiling temperature, J/(kgK) the heat capacity at constant pressure, MJ/kg the vaporization enthalpy, and the cell volume. If the energy absorbed by a cell exceeded , the cell volume was assumed to be vaporized instantaneously. Summation of the vaporized-cell volumes then provided a measure for the initial bubble volume and position.
References
- Eggers and Villermaux (2008) J. Eggers and E. Villermaux, Physics of liquid jets, Reports on Progress in Physics 71, 036601 (2008).
- Duchemin et al. (2002) L. Duchemin, S. Popinet, C. Josserand, and S. Zaleski, Jet formation in bubbles bursting at a free surface, Physics of Fluids 14, 3000 (2002).
- Longuet-Higgins (1983) M.S. Longuet-Higgins, Bubbles, breaking waves and hyperbolic jets at a free surface, Journal of Fluid Mechanics 127, 103 (1983).
- Goodridge et al. (1999) C.L. Goodridge, H.G.E. Hentschel, and D.P. Lathrop, Breaking Faraday Waves: Critical Slowing of Droplet Ejection Rates, Physical Review Letters 82, 3062 (1999).
- Zeff et al. (2000) B.W. Zeff, B. Kleber, J. Fineberg, and D.P. Lathrop, Singularity dynamics in curvature collapse and jet eruption on a fluid surface, Nature 403, 401 (2000).
- Longuet-Higgins (2001) M.S. Longuet-Higgins, Vertical jets from standing waves, Proceedings of the Royal Society of London. Series A: Mathematical, Physical and Engineering Sciences 457, 495 (2001).
- Longuet-Higgins & Dommermuth (2001b) M.S. Longuet-Higgins, and D.G. Dommermuth, Vertical jets from standing waves. II, Proceedings of the Royal Society of London. Series A: Mathematical, Physical and Engineering Sciences 457, 2137 (2001).
- Longuet-Higgins & Dommermuth (2001a) M.S. Longuet-Higgins, and D.G. Dommermuth, On the breaking of standing waves by falling jets, Physics of Fluids 13, 1652 (2001).
- Antkowiak et al. (2007) A. Antkowiak, N. Bremond, S. Le Dizès, and E. Villermaux, Short-term dynamics of a density interface following an impact, Journal of Fluid Mechanics 577, 241 (2007).
- Birkhoff et al. (1948) G. Birkhoff, D.P. MacDougall, E.M. Pugh, and G. Taylor, Explosives with Lined Cavities, Journal of Applied Physics 19, 563 (1948).
- Curtis and Kelly (1994) J.P. Curtis and R.J. Kelly, Circular streamline model of shaped-charge jet and slug formation with asymmetry, Journal of Applied Physics 75, 7700 (1994).
- Petit et al. (2005) J. Petit, V. Jeanclaude, and C. Fressengeas, Breakup of Copper shaped-charge jets: Experiment, numerical simulations, and analytical modeling, Journal of Applied Physics 98, 123521 (2005).
- Gekle (2009) S. Gekle, J.M. Gordillo, D. van der Meer, and D. Lohse, High-Speed Jet Formation after Solid Object Impact, Physical Review Letters 102, 034502 (2009).
- Gekle and Gordillo (2010) S. Gekle and J.M. Gordillo, Generation and breakup of Worthington jets after cavity collapse. Part 1. Jet formation, Journal of Fluid Mechanics 663, 293 (2010).
- Bergmann et al. (2006) R. Bergmann, D. van der Meer, M. Stijnman, M. Sandtke, A. Prosperetti, and D. Lohse, Giant Bubble Pinch-Off, Physical Review Letters 96, 154505 (2006).
- Longuet-Higgins & Oguz (1995) M.S. Longuet-Higgins, and H. Oguz, Critical microjets in collapsing cavities, Journal of Fluid Mechanics 290, 183 (1995).
- Bergmann et al. (2009) R. Bergmann, D. van der Meer, S. Gekle, A. van der Bos, and D. Lohse, Controlled impact of a disk on a water surface: cavity dynamics, Journal of Fluid Mechanics 633, 381 (2009).
- Thoroddsen et al. (2007) S.T. Thoroddsen, T.G. Etoh, and K. Takehara, Experiments on bubble pinch-off, Physics of Fluids 19, 042101 (2007).
- Laterborn et al. (1999) W. Lauterborn, T. Kurz, R. Mettin, and C.D. Ohl, Experimental and theoretical bubble dynamics, Advances in Chemical Physics 110, 295-380 (1999).
- Vogel et al. (2003) A. Vogel, and V. Venugopalan Mechanisms of pulsed laser ablation of biological tissues, Chemical Reviews 103, 577-644 (2003).
- Apitz et al. (2005) I. Apitz, and A. Vogel, Material ejection in nanosecond Er:YAG laser ablation of water, liver, and skin, Applied Physics A 81, 329-338 (2005).
- Obreschkow et al. (2006) D. Obreschkow, P. Kobel, N. Dorsaz, A. de Bosset, C. Nicollier, and M. Farhat, Cavitation bubble dynamics inside liquid drops in microgravity, Physical Review Lettters 97, 094502 (2006).
- Robert et al. (2007) E. Robert, J. Lettry, M. Farhat, P. A. Monkewits, and F. Avellan, Cavitation bubble behavior inside a liquid jet, Physics of Fluids 19, 067106 (2007).
- Thoroddsen et al. (2009) S.T. Thoroddsen, K. Takehara, T.G. Etoh, and C.D. Ohl, Spray and microjets produced by focusing a laser pulse into a hemispherical drop, Physics of Fluids 21, 112101 (2009).
- Mitragotri (2006) S. Mitragotri, Current status and future prospects of needle-free liquid jet injectors, Nature Reviews Drug Discovery 5, 543 (2006).
- Han & Yoh (2010) T. Han, and J.J. Yoh, A laser based reusable microjet injector for transdermal drug delivery, Journal of Applied Physics 107, 103110 (2010).
- Menezes et al. (2009) V. Menezes, S. Kumar, and K. Takayama, Shock wave driven liquid microjets for drug delivery, Journal of Applied Physics 106, 086102 (2009).
- Sun et al. (2009) C. Sun, E. Can, R. Dijkink, D. Lohse, and A. Prosperetti, Growth and collapse of a vapour bubble in a microtube: the role of thermal effects, Journal of Fluid Mechanics 632, 5 (2009).
- Sumner et al. (2004) A.L. Sumner, E.J. Menke, Y. Dubowski, J.T. Newberg, R.M. Penner, J.C. Hemminger, L.M. Wingen, T. Brauers, and B.J. Finlayson-Pitts, The nature of water on surfaces of laboratory systems and implications for heterogeneous chemistry in the troposphere, Physical Chemistry Chemical Physics 6, 604 (2004).
- van der Bos et al. (2011) A. van der Bos, A. Zijlstra, E. Gelderblom, and M. Versluis, iLIF: illumination by Laser-Induced Fluorescence for single flash imaging on a nanoseconds timescale, Experiments in Fluids 51, 1283 (2011).
- Peters et al. (2012) I.R. Peters, Y. Tagawa, N. Oudalov, C. Sun, D. van der Meer, A. Prosperetti, and D. Lohse, to be submitted (2012).
- Ory et al. (2000) E. Ory, H. Yuan, A. Prosperetti, S. Popinet, and S. Zaleski, Growth and collapse of a vapor bubble in a narrow tube, Physics of Fluids 12, 1268 (2000).
- Mirshekari and Brouillette (2009) G. Mirshekari and M. Brouillette, One-dimensional model for microscale shock tube flow, Shock Waves 19, 25 (2009).
- Ngomo et al. (2010) D. Ngomo, A. Chaudhuri, A. Chinnayya, and A. Hadjadj, Numerical study of shock propagation and attenuation in narrow tubes including friction and heat losses, Computers & Fluids 39, 1711 (2010)