The connection between 3.3 µm PAH emission and AGN activity
Abstract
We investigate the connection between starburst and active galactic nucleus (AGN) activity by comparing the 3.3 µm polycyclic aromatic hydrocarbon (PAH) emission with AGN properties. Utilizing the slit-less spectroscopic capability of the AKARI space telescope, we observe moderate-luminosity Type I AGN at z0.4 to measure global starburst activity. The 3.3 µm PAH emissions are detected for 7 out of 26 target galaxies. We find no strong correlation between the 3.3 µm PAH emission and AGN luminosity in the limited range of the observed AGN luminosity, suggesting that global star formation may not be closely related to AGN activity. Combining our measurements with the previous 3.3 µm measurements of low redshift Type I AGN in the literature, we investigate the connection between nuclear starburst and AGN activity. In contrast to global star formation, the 3.3 µm PAH luminosity measured from the central part of galaxies correlates with AGN luminosity, implying that starburst and AGN activity are directly connected in the nuclear region.
Subject headings:
accretion, accretion disks – black hole physics – accretion – galaxies:active – galaxies: nuclei1. Introduction
The correlations of black hole mass with galaxy properties imply a close link between black hole growth and galaxy evolution (Ferrarese & Merritt, 2000; Gebhardt et al., 2000; Gültekin et al., 2009; Woo et al., 2010). Numerous theoretical and observational studies have been dedicated to revealing the nature of the connection (e.g., Kauffmann & Haehnelt 2000; Springel et al. 2005; Croton et al. 2006; Woo et al. 2006, 2008; Hopkins et al. 2007; Merloni et al. 2010; Bennert et al. 2011).
Probing the direct connection between starburst and active galactic nuclei (AGN) can shed light on how black hole growth and bulge growth are inter-connected. However, it is challenging to observationally measure both the starburst rate and AGN activity for given galaxies. Optically-identified broad-line AGNs are the best objects for measuring black hole mass and AGN accretion rate. On the other hand the star formation rate of host galaxies is difficult to measure since AGN flux dominates in the UV continuum and hydrogen recombination lines, i.e., H, which are generally used as a star formation indicator in non-AGN galaxies. In the case of Type II AGN, it is relatively easy to measure star formation rate while black hole mass and accretion rate are difficult to determine owing to the dust obscuration of accretion disk and broad-line region.
The polycyclic aromatic hydrocarbon (PAH) emission features emitted by small carbon grains are one of the star formation indicators. Thus, PAH emissions have been used to constrain star formation activity in the host galaxies of Type 1 AGN (e.g., Ogle et al. 2006; Schweitzer et al. 2006; Shi et al. 2007). Based on the ground-based and space observations, various PAH emission features, i.e., 3.3, 6.2, 7.7, 8.6, 11.3, and 12.7 µm lines, have been detected in many local Seyfert 1 galaxies and distant QSOs although not all AGN show PAH emission features (e.g., Clavel et al., 2000; Rodríguez-Ardila & Viegas, 2003; Imanishi & Wada, 2004; Netzer et al., 2007; Lutz et al., 2007, 2008; Shi et al., 2009; Imanishi et al., 2010; Oi et al., 2010; Imanishi et al., 2011).
Among PAH-detected AGN, there seems to be a correlation between nuclear starburst and AGN activity. Using a sample of low-redshift Palomar-Green (PG) QSOs observed with the Spitzer Infrared Spectrograph (IRS), Netzer et al. (2007) showed that 7.7 µm PAH luminosity increases with AGN continuum luminosity at 5100Å (L5100Å), indicating the starburst-AGN connection. High-redshift QSOs seem to follow the same trend, extending the correlation to much higher luminosity range (Lutz et al., 2008). The starburst-AGN connection is supported by a number of theoretical studies, demonstrating that both nuclear starburst events and AGN activity can be triggered by gas inflow through galaxy interactions (e.g., Kauffmann & Haehnelt 2000; Robertson et al. 2006; Ciotti & Ostriker 2007; Hopkins et al. 2009).
For lower luminosity AGNs it is less clear how AGN activity is connected to starburst since AGN power is more difficult to measure owing to increasing host galaxy contribution in lower luminosity AGN. Based on the ground-based L-band slit spectra, Imanishi & Wada (2004) measured the 3.3 µm PAH luminosity of local Seyfert 1 and 2 galaxies, showing a positive correlation between starburst and AGN activity although the correlation is not tight with a large scatter. In their study, radio luminosity and N-band luminosity within 1.5” of the host galaxies are used as an indicator of AGN power. Using 2-10 kev X-ray luminosity, Watabe et al. (2008) showed a similar trend between AGN power and the 3.3 µm PAH luminosity for a larger sample of local Seyfert 1 and 2 galaxies.
Most previous observational studies on PAH features with ground based long-slit spectroscopy or Spitzer IRS observations have probed the inner part of galaxies, indicating a connection between nuclear starburst within a few kpc and AGN activity (e.g., Watabe et al., 2008). In contrast, whether global star formation over entire galaxies is related with AGN activity it is not well studied since most previous studies, particularly for local and low-redshift galaxies, have used a relatively small aperture to extract PAH emission features, measuring nuclear PAH emissions. Based on the spatially resolved mid-IR spectroscopy of nearby active galaxies, several studies have reported that PAH emissions are mainly from the disk (e.g., Laurent et al., 2000; Le Floc’h et al., 2001), suggesting that the global PAH luminosity measured over entire galaxies may be much larger than nuclear PAH luminosity.
In this paper, we investigate global and nuclear star formation in the host galaxies of Type 1 AGN, using the 3.3 µm PAH emission measurements based on our new observations with the AKARI space telescope and collected data from the literature. The AKARI telescope provides a unique capability of slit-less spectroscopy to measure global star formation over entire galaxies (e.g., Imanishi et al. 2010). This paper is organized as follows. In §2, we describe sample selection, observations and data reduction of the AKARI observations. We present 3.3 µm PAH emission measurements in §3. Main results on the starburst-AGN connection are presented in §4. Discussion and conclusions are followed in § 5. Throughout the paper, we assume a Hubble constant of Ho = 70 km s-1 Mpc-1, , and .
2. Observations and Data Reduction
2.1. Sample Selection
We selected a sample of 27 moderate-luminosity AGN (L5100Å 0.1-3 1044 erg s-1) at 0.35 z 0.36 from the Sloan Digital Sky Survey Data Release 7 to study star formation activity based on the PAH feature at 3.3 µm. The sample was initially selected for investigating the evolution of the black hole mass-stellar velocity dispersion (M) relation. Details of sample selection can be found in Woo et al. (2006) and Treu et al. (2007). In summary, we selected broad-line AGNs with the H equivalent width (EW) 5 Å to properly estimate black hole masses based on the kinematics of broad-line region gas. The specific redshift range was selected to avoid sky emission lines on the stellar absorption features, from which stellar velocity dispersions were directly measured. The spectral energy distribution of 24 objects in the sample was in detail investigated by (Szathmary et al., 2011) based on the multi-wavelength data including Chandra X-ray observations, HST imaging, and Spitzer IRAC and MIPS imaging as well as the archival data of GALEX and Two Micron All-Sky Survey (2MASS). From the spectral energy distribution (SED) fitting analysis, AGN SED was separated from galaxy SED, leading to accurate measurements of AGN bolometric luminosities. Black hole mass of each AGN was estimated by the single-epoch virial method, which combines the line width of H and the optical luminosity at 5100Å(L5100), utilizing the size-luminosity relation of the reverberation sample (Bentz et al. 2009) and the most recent calibration of the virial factor by Woo et al. (2010) (see Table 1). The black hole mass of the sample covers an order of magnitude, i.e., MBH/M⊙ . Combining black hole mass estimates with the bolometric luminosities measured from the SED fitting, we obtained the Eddington ratios, ranging from a few to 50% of the Eddington limit. The basic properties of the sample are listed in Table 1.
| Name | RA (J2000) | DEC (J2000) | redshift | log Lbol | L5100,nuc | log LX | log MBH | pointings | |
|---|---|---|---|---|---|---|---|---|---|
| (erg/s) | (erg/s) | (erg/s) | (M⊙) | ||||||
| (1) | (2) | (3) | (4) | (5) | (6) | (7) | (8) | (9) | (10) |
| S01 | 15 39 16.23 | +03 23 22.1 | 0.3592 | 45.23 | 0.72 | 0.29 | 44.48 | 8.20 | 1 |
| S02 | 16 11 11.67 | +51 31 31.1 | 0.3544 | 45.13 | 0.34 | 0.22 | 44.60 | 7.98 | 4 |
| S03 | 17 32 03.11 | +61 17 52.0 | 0.3583 | 45.50 | 1.64 | 0.39 | 44.95 | 8.28 | 4 |
| S04 | 21 02 11.51 | -06 46 45.0 | 0.3578 | 45.27 | 1.33 | 0.36 | 44.55 | 8.44 | 4 |
| S05 | 21 04 51.85 | -07 12 09.4 | 0.3530 | 45.44 | 1.85 | 0.47 | 44.84 | 8.74 | 4 |
| S06 | 21 20 34.19 | -06 41 22.2 | 0.3684 | 45.05 | 0.51 | 0.18 | 44.25 | 8.16 | 4 |
| S07 | 23 09 46.14 | +00 00 48.9 | 0.3518 | 45.47 | 2.10 | 0.45 | 44.80 | 8.53 | 2 |
| S08 | 23 59 53.44 | -09 36 55.5 | 0.3585 | 45.23 | 1.22 | 0.40 | 44.55 | 8.10 | 4 |
| S09 | 00 59 16.11 | +15 38 16.1 | 0.3542 | 45.37 | 0.71 | 0.22 | 44.78 | 8.13 | 4 |
| S10 | 01 01 12.07 | -09 45 00.8 | 0.3506 | 45.48 | 1.02 | 0.27 | 44.93 | 8.25 | 4 |
| S11 | 01 07 15.97 | -08 34 29.4 | 0.3557 | 45.34 | 0.52 | 0.14 | 44.85 | 8.00 | 4 |
| S12 | 02 13 40.60 | +13 47 43.3 | 0.3570 | 45.43 | 0.97 | 0.28 | 44.62 | 8.67 | 4 |
| S21 | 11 05 56.18 | +03 12 43.3 | 0.3534 | 45.88 | 2.15 | 0.34 | 44.06 | 8.79 | 1 |
| S23 | 14 00 16.66 | -01 08 22.2 | 0.3510 | 45.42 | 1.11 | 0.29 | 44.75 | 8.70 | 3 |
| S26 | 15 29 22.26 | +59 28 54.6 | 0.3691 | 45.13 | 0.52 | 0.27 | 44.38 | 8.02 | 4 |
| S27 | 15 36 51.28 | +54 14 42.7 | 0.3667 | 45.23 | 0.95 | 0.36 | 44.74 | 8.10 | 4 |
| S28 | 16 11 56.30 | +45 16 11.0 | 0.3680 | 45.13 | 0.76 | 0.03 | 44.66 | 7.90 | 4 |
| S29 | 21 58 41.93 | -01 15 00.3 | 0.3575 | 45.43 | 0.59 | 0.10 | 44.54 | 7.94 | 4 |
| S31 | 10 15 27.26 | +62 59 11.5 | 0.3504 | 45.38 | 0.29 | 0.08 | 44.58 | 7.94 | 2 |
| SS1 | 08 04 27.99 | +52 23 06.2 | 0.3566 | 45.41 | 0.39 | 0.11 | 44.89 | 7.75 | 4 |
| SS2 | 09 34 55.60 | +05 14 09.1 | 0.3675 | 45.21 | 0.33 | 0.13 | 44.54 | 7.72 | 3 |
| SS9 | 12 58 38.71 | +45 55 15.5 | 0.3704 | 44.92a | 0.93 | 0.26 | 8.05 | 4 | |
| SS10 | 13 34 14.84 | +11 42 21.5 | 0.3658 | 45.30a | 2.26 | 0.43 | 7.94 | 4 | |
| SS11 | 13 52 26.90 | +39 24 26.8 | 0.3732 | 44.66a | 0.51 | 0.15 | 8.11 | 4 | |
| SS12 | 15 01 16.83 | +53 31 02.4 | 0.3626 | 45.46a | 3.24 | 0.52 | 8.15 | 4 | |
| SS13 | 15 05 41.79 | +49 35 20.0 | 0.3745 | 44.94a | 0.98 | 0.38 | 7.63 | 4 |
Note. — Col. (1): Object name. Col. (2): RA. Col. (3): DEC. Col. (4): redshift Col. (5): AGN bolometric luminosity measured from multi-wavelength data, adopted from Szathmary et al. (2011). Col. (6): AGN monochromatic luminosity at 5100Å in 1044 erg s-1 units, corrected for host galaxy starlight based on the HST images, taken from Treu et al. (2007); Bennert et al. (2010). Col. (7): AGN fraction in the observed flux at 5100Å, adopted from Treu et al. (2007); Bennert et al. (2010). Col. (8): AGN X-ray luminosity from Szathmary et al. (2011). Col. (9): Black hole mass estimated from H line width and L5100 adopted from Woo et al. (2006); Bennert et al. (2010). Col. (10): Number of pointings for AKARI observation
2.2. AKARI Observations
To detect the PAH features at the rest-frame 3.3 µm, we carried out spectroscopic observations using the Infrared Camera (IRC) on board the AKARI space telescope (Onaka et al., 2007). The field of view of IRC is roughly 10’ 10’ with a spatial scale of 1.45”/pixel. The full-width-at-half-maximum of the point spread function is 3.2 pixels, corresponding to 4.64”. The NIR grism mode (NG) was adopted for most of the observations, providing spectral resolution of R 120 at 3.6 µm for a point source (Onaka et al., 2007). A unique capability of IRC is the slit-less spectroscopic mode. With 1’ by 1’ aperture used for pointing mode, the photons from the entire galaxies in our sample can be detected. Thus, the measured 3.3 µm PAH luminosities represent the global star formation.
The exposure time for each AGN host galaxy was determined in order to achieve signal-to-noise ratio S/N 10 in the continuum. We assigned 4 pointings (6 minute exposure per pointing) for each target based on the exposure time calculation using the K-band magnitudes from the 2MASS archive. Owing to the complexity of scheduling of the sun-synchronous polar orbit of the AKARI, a couple of objects were observed with less than 4 points. In summary, we obtained a total of 93 pointings for 27 target galaxies (see 1).
2.3. Data Reduction
We carried out data reduction using the IRC spectroscopy pipeline111 http://www.ir.isas.jaxa.jp/ASTRO-F/Observation/DataReduction/IRC/. The data reduction procedures with the IRC spectroscopy pipeline is described in detail by Ohyama et al. (2007). In summary, the reduction steps include standard procedures: dark subtraction, linearity correction, flat-fielding, background subtraction, extraction of 2-dimensional spectra, wavelength calibration, and flux calibration. Before extracting 1-dimensional spectra, we applied additional cosmic ray removal using L.A.Cosmic (van Dokkum, 2001) to remove hot pixels, which significantly increased in Phase 3 (post liquid-He warm mission cooled by the onboard cryocooler). To extract 1-dimensional spectra, we used five pixels along the spatial direction as recommended by Ohyama et al. (2007). As a consistency check, we compared the spectra extracted from larger aperture sizes and found no difference in the extracted spectra. Finally, we combine the extracted 1-dimensional spectra from each pointing while applying additional sigma-clipping. In order to improve signal-to-noise ratio, we apply three pixels binning along the wavelength direction. We were not able to extract a spectrum for one object (S10) due to the low quality of the observed spectral images. Thus, this target is excluded for the following analysis.

3. 3.3 µm PAH measurements
3.1. Individual galaxies
In Figure 1 we present the reduced spectra of 7 galaxies with the 3.3 µm PAH emission detection. Due to the low signal-to-noise ratio of the observed spectra, it is necessary to assume an intrinsic profile of the 3.3 µm PAH emission line in order to confirm the detection of the line and measure its strength. In measuring the line strength of the PAH emission lines, several different fitting schemes with various line profiles, i.g., Gaussian, Lorentzian, Drude profiles, and Spline functions have been devised. For example, Galliano et al. (2008) applied Spline functions and Lorentz profiles for fitting PAH emission lines in various sources and found no systematic difference in the measured PAH fluxes while Smith et al. (2007) applied Drude profile to mid-IR spectra obtained from the IRS. We chose a Gaussian profile, which is generally adopted for the 3.3 µm PAH emission lines observed in starburst galaxies (Type-A sources in Tokunaga et al. 1991). In practice, we applied a Gaussian profile with a fixed width in the rest-frame for modeling the 3.3 µm PAH line. We adopted 21 nm as a fixed width of the line profile, which has been determined from the PAH line profile of M82 (Tokunaga et al. 1991) and used for our previous studies of the 3.3µm PAH line based on the AKARI IRC spectra (Imanishi et al. 2008, 2010).
Continuum subtraction is the largest source of uncertainty in measuring PAH emission line flux since absorption features are abundant in the near- and mid-IR spectral ranges. The vicinity of the 3.3 PAH feature is not an exception: There is a plethora of absorption features in the rest-frame 2 - 5 µm range. We applied a linear fit to the continuum in the 3.0 - 3.6 µm range with two-pixel binning, after masking the location of the PAH feature around the 3.3 , as similarly practiced in other studies (e.g. Imanishi & Wada, 2004; Imanishi et al., 2010; Oi et al., 2010; Imanishi et al., 2011).
While fitting the 3.3 PAH feature by a Gaussian profile, we determined the peak and the central wavelength of the profile based on the minimization. Then, the line flux and the equivalent width were determined from the fit (see Table 2). The typical error of the measured flux density is erg s-1 cm-2 .
We detected the 3.3 µm PAH feature from 7 out of 26 observed galaxies, resulting in a detection rate of 27%. Compared to higher luminosity AGN, the 3.3 µm PAH detection rate of our lower-luminosity AGN is slightly higher although the difference is not easy to interpret owing to the different exposure time and flux limits. For example, Imanishi et al. (2011) investigated the PAH emission features of 30 PG QSOs based on the ground-based observations, and detected the 3.3µm PAH emission from 5 QSOs, resulting in a 17% detection rate. If we exclude S3 and SS12, for which 3.3µm PAH emission is marginally detected, then the detection rate of our lower-luminosity AGN decreases to 19%, suggesting that the detection rate is similar to that of PG QSOs.
Compared to the detection rate of other PAH lines at longer wavelength (e.g., 6.7, 7.7, 8.6, 11.2 µm) in local Seyfert galaxies, the detection rate of the 3.3µm PAH line in our sample seems to be much lower (see Sales et al. 2010). This difference may be due to the fact that 3.3µm PAH is much weaker than other lines at longer wavelength, thus more difficult to be detected. For better understanding of the relation among various PAH lines, spectroscopic studies with a large spectral range including 3.3µm and other PAH lines are required.
The detected 3.3 µm PAH line luminosity (L) ranges from erg s-1 while the upper limit of the PAH luminosity of the undetected galaxies is close to erg s-1. Compared to the 3.3 µm PAH luminosity range of Type I AGN host galaxies measured from ground-based observations (L=1039 - 1042 erg s-1), the 3.3 µm PAH luminosities from the AKARI slit-less spectroscopy are more than a factor of 10 higher. This is probably due to the aperture effect, reflecting the difference between nuclear and global star formation. Ground-based observations generally used a narrow-slit to probe nuclear starburst while AKARI slit-less spectroscopy provides the global star formation rate over entire galaxies. A direct comparison between ground-based and AKARI observations supports this interpretation. For example, a recent AKARI study by Imanishi et al. (2010) reported the 3.3 µm PAH luminosity of NGC 7469 as erg s-1 while the ground-based spectroscopy with a 1.6” slit width by Imanishi & Wada (2004) presented an upper limit of erg s-1, indicating that the nuclear PAH emission is a small fraction of the global PAH emission.
For galaxies with no 3.3 PAH emission detection, we measured the upper limits. First, we averaged the 1 errors at the wavelength range of the expected 3.3 µm PAH line. Then, we assumed a Gaussian profile with a peak flux, which is 3 times larger than the average 1 error. In the case of the line width of the profile, we used a constant width of 21 nm in the rest-frame. The measurements and upper limits of the 3.3 µm PAH luminosity are listed in Table 2.
3.2. Combined Spectra
In order to construct the representative spectra of the sample and to recover the undetected 3.3 µm PAH in individual galaxies, we constructed two combined spectra respectively for the entire sample and the galaxies with no 3.3 µm PAH emission detection. To construct stacked spectra, we used a wavelength range between 3.1 - 3.5 µm in the rest frame and normalized individual spectra by a continuum fit. Then, we summed individual spectra without weighting. We also applied two-pixel binning to the data points outside of the 3.3 µm PAH line to smooth the continuum. The stacked spectra of the entire sample and the galaxies with no 3.3 µm PAH detection are presented in Figure 2.
The combined spectrum of the entire sample clearly shows the 3.3 PAH emission. By fitting the PAH emission using a Gaussian profile with a width of 21 nm, we measured the EW of the 3.3 PAH line. The EW of PAH in our sample is larger than that of QSOs. For example, based on a sample of PG QSOs, Imanishi et al. (2011) reported that the EWs of the 3.3 µm PAH emission of individual galaxies are typically less than 10 nm while the EW of the 3.3 µm PAH emission measured from their combined spectrum is only 1 nm. The smaller EW of PAH emission in higher luminosity AGN may be interpreted to mean that PAH lines are diluted by higher AGN continuum. However, a larger sample is required to reveal the origin of the trend.

| Object | f3.3μm | L3.3μm | EW3.3μm |
|---|---|---|---|
| (10-15 erg s-1 cm-2) | (1042 erg s-1) | (nm) | |
| (1) | (2) | (3) | (4) |
| S01 | ¡ 5.09 | ¡2.19 | …. |
| S02 | ¡ 10.47 | ¡4.36 | …. |
| S03 | 3.10 | 1.33 | 9 |
| S04 | ¡ 1.55 | ¡0.66 | …. |
| S05 | ¡ 2.00 | ¡0.83 | …. |
| S06 | ¡ 2.03 | ¡0.93 | …. |
| S07 | ¡ 2.76 | ¡1.13 | …. |
| S08 | 3.80 | 1.63 | 87 |
| S09 | ¡ 31.41 | ¡ 13.07 | …. |
| S10 | …. | …. | …. |
| S11 | 4.40 | 1.85 | 21 |
| S12 | ¡ 1.77 | ¡ 0.75 | …. |
| S21 | ¡ 12.73 | ¡5.27 | …. |
| S23 | ¡ 1.97 | ¡0.80 | …. |
| S26 | 12.50 | 5.73 | 206 |
| S27 | ¡ 1.69 | ¡0.76 | …. |
| S28 | 6.65 | 3.03 | 43 |
| S29 | ¡ 1.51 | ¡0.64 | …. |
| S31 | ¡ 1.43 | ¡0.58 | …. |
| SS1 | ¡ 1.77 | ¡0.74 | …. |
| SS2 | ¡ 1.84 | ¡0.83 | …. |
| SS3 | ¡ 1.57 | ¡0.66 | …. |
| SS9 | ¡ 1.72 | ¡0.79 | …. |
| SS10 | ¡ 1.56 | ¡0.70 | …. |
| SS11 | 7.15 | 3.36 | 77 |
| SS12 | 2.00 | 0.88 | 3 |
| SS13 | ¡ 1.74 | ¡0.82 | …. |
| Stacked | 21 |
Note. — Col. (1): Object name. Col. (2): 3.3 µm PAH line flux. Col. (3). 3.3 µm PAH line luminosity. Col. (4). Equivalent width of the 3.3 µm PAH emission line.
4. Starburst-AGN Connection
In this section, we investigate how starburst and AGN activity is related. First, we compare AGN activity with the global star formation rate measured from the AKARI observations (§ 4.1). Then, we investigate the correlation between nuclear starburst and AGN activity based on the collected data from the literature (§ 4.2).
4.1. Global PAH emission and AGN activity
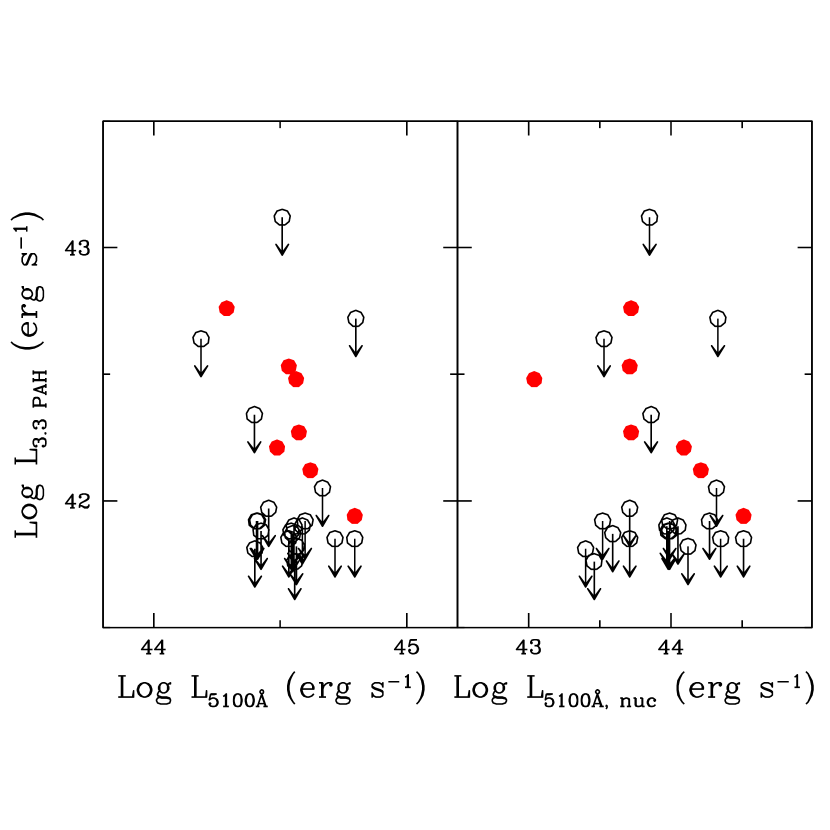
To investigate the relation between global star formation and AGN activity, we compare the luminosity of the 3.3 µm PAH emission (L) with various AGN properties, i.e., optical, X-ray, and bolometric luminosities. First, in Figure 3 (left) we compare the L with AGN continuum luminosity at 5100Å (L5100Å) measured from high S/N optical spectra obtained with the Low Resolution Imaging Spectrograph at the Keck Telescope (Woo et al., 2006; Bennert et al., 2010). Although the optical luminosity range is rather limited, we find no strong positive correlation. Instead, a weak negative correlation between L and the optical luminosity seems to be present among PAH-detected objects. Assuming that the strengths of the 3.3 and 7.7µm PAH emissions are correlated, this result is inconsistent with previous studies (e.g., Netzer et al., 2007; Lutz et al., 2008), which reported a positive correlation between 7.7µm PAH luminosity and 5100Å luminosity. One potential bias is the contribution from host galaxy starlight to L5100Å since for low luminosity AGN, such as the sample considered here, the amount of starlight can be comparable to the AGN flux in the optical range (e.g., Woo et al., 2006; Bennert et al., 2010).
To correct for the host galaxy contribution, we measured the nuclear luminosity at 5100Å based on the 2-dimensional AGN-host galaxy decomposition analysis using high-resolution images obtained with the Hubble Space Telescope (for details, see Treu et al. 2007; Bennert et al. 2010). The mean AGN-to-total flux ratio of our sample is 0.26 (see Table 1), indicating that the correction for the host galaxy contribution at 5100Å is necessary. After correcting for the host galaxy contribution, we compare the pure AGN optical luminosity at 5100Å with the PAH luminosity as shown in Figure 3 (right). The nuclear luminosity (L5100,nuc) becomes significantly smaller than the observed luminosity at 5100Å. However, this correction does not significantly change the trend between L and AGN continuum luminosity.
These results are rather contradictory to the previous studies that claimed positive correlations between AGN activity and various starburst indicators, i.e., L and far-IR luminosity (e.g. Netzer et al., 2007; Watabe et al., 2008; Oi et al., 2010). Note that there are many Type 1 AGN without PAH detections in the previous studies as well as our observation. By including these upper limits, the correlation between PAH and AGN luminosities can substantially weaken. On the other hand, since the luminosity range of our sample is rather limited, we cannot conclude whether or not there is a correlation between L and L5100Å in a larger luminosity range.
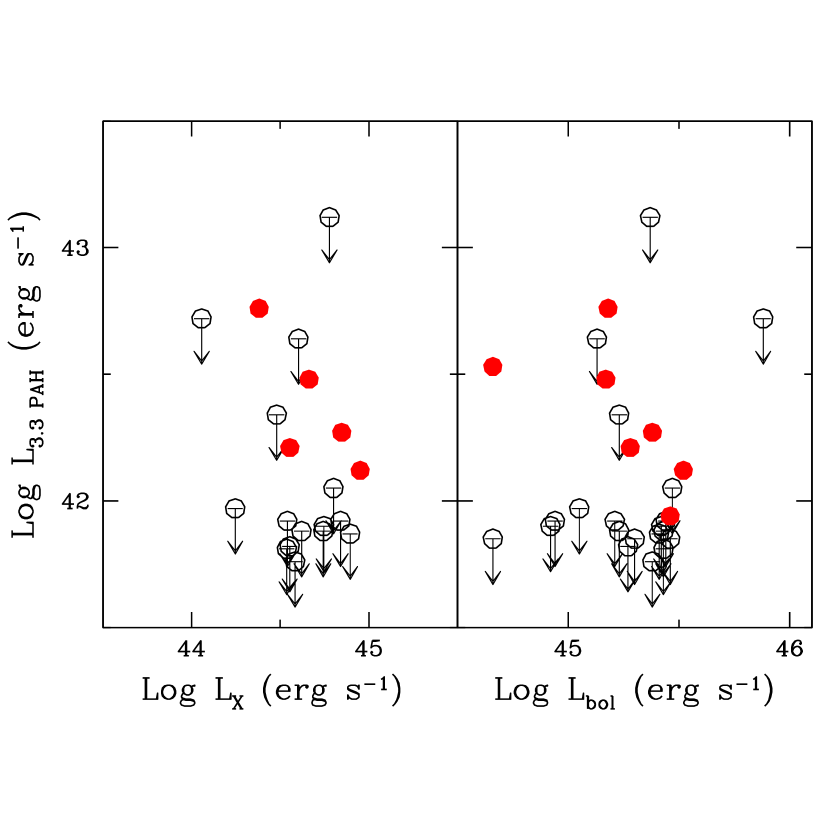
Instead of optical luminosities, we can use X-ray luminosity, which is a good indicator of AGN activity since X-ray is dominantly radiated from accretion disk in Type I AGN. In Figure 4 (left), we compare L with AGN X-ray luminosity integrated over the 0.5 to 8 keV range, measured from Chandra X-ray images (Szathmary et al., 2011). Within the order of magnitude range of the X-ray luminosity, we see no strong positive correlation. We also used the bolometric luminosity of AGN determined from multi-wavelength SED fitting analysis (for details, see Szathmary et al., 2011) to compare with L. As shown in Figure 4 (right), we see no strong correlation between L and the AGN bolometric luminosity within the limited range of the observed luminosity.
| Object | z | log LPAH3.3 | Ref. | log MBH | Method | Ref. | log L5100,nuc | Method | Ref. |
|---|---|---|---|---|---|---|---|---|---|
| (erg/s) | (M⊙) | (erg/s) | |||||||
| (1) | (2) | (3) | (4) | (5) | (6) | (7) | (8) | (9) | (10) |
| NGC 3227 | 0.0039 | 39.36 | 2 | 7.60 | reverberation | 2 | 42.48 | bulge-disk decomposition | 2 |
| NGC 4235 | 0.0008 | 39.64 | 1 | 7.71 | single-epoch virial | this work | 42.08 | from LHα | this work |
| NGC 4748 (MCG-2-33-34) | 0.0146 | 40.18 | 1 | 6.39 | reverberation | 1 | 42.74 | from spectral fitting | 1 |
| NGC 5273 | 0.0036 | 39.30 | 4 | 6.85 | single-epoch virial | this work | 41.45 | from LHα | this work |
| NGC 5940 | 0.0339 | 40.80 | 1 | 7.95 | single-epoch virial | this work | 43.37 | from LHα | this work |
| Mrk 335 | 0.0258 | 40.49 | 1 | 7.13 | reverberation | 2 | 43.78 | bulge-disk decompositoin | 2 |
| Mrk 509 | 0.0344 | 41.00 | 1 | 8.14 | reverberation | 2 | 44.16 | bulge-disk decompositoin | 2 |
| Mrk 530 | 0.0295 | 40.88 | 1 | 8.06 | M relation | 3 | 43.71 | from Lbol. | 3 |
| Mrk 618 | 0.0356 | 40.85 | 1 | 8.34 | MBH-Lbulge relation | 4 | 44.03 | from MBH and Eq. 1 | 4 |
| Mrk 766 (NGC 4253) | 0.0129 | 40.32 | 2 | 6.23 | reverberation | 1 | 42.81 | from spectral fitting | 1 |
| Mrk 817 | 0.0315 | 41.00 | 1 | 7.67 | reverberation | 2 | 43.64 | bulge-disk decomposition | 2 |
| 3C 120 | 0.0330 | 41.04 | 1 | 7.72 | reverberation | 2 | 44.09 | bulge-disk decomposition | 2 |
| PG 0157+001 (Mrk 1014) | 0.1631 | 42.32 | 3 | 8.31 | single-epoch virial | 5 | 44.89 | spectral fitting | 5 |
| PG 1211+143 | 0.0809 | 41.43 | 3 | 8.14 | reverberation | 2 | 44.70 | bulge-disk decomposition | 2 |
| PG 1411+442 | 0.0896 | 41.49 | 3 | 8.63 | reverberation | 2 | 44.52 | bulge-disk decomposition | 2 |
| PG 1416-129 | 0.1289 | 41.40 | 3 | 8.83 | single-epoch virial | 5 | 44.55 | spectral fitting | 5 |
| PG 1440+356 | 0.0791 | 41.51 | 3 | 7.80 | single-epoch virial | 6 | 44.54 | spectral fitting | 6 |
Note. — Col. (1): Object name. Col. (2): Redshift. Col. (3): 3.3µm PAH luminosity Col. (4): reference for L. 1. Imanishi & Wada (2004). 2. Rodríguez-Ardila & Viegas (2003) 3. Imanishi et al. (2011). 4. Oi et al. (2010). 5. Imanishi et al. (2010). Col. (5): Black hole mass Col. (6): reference for black hole mass 1. Bentz et al. (2009b). 2. Peterson et al. (2004). 3. Nelson & Whittle (1995). 4. Ryan et al. (2007). 3. Col. (7): AGN monochromatic luminosity at 5100Å, Col. (8): reference for L5100. 1. Park et al. (2011). 2. Bentz et al. (2009a). 3. Woo & Urry (2002). 4. Ryan et al. (2007). 5. Ho & Kim (2009). 6. Shang et al. (2007).
4.2. Nuclear PAH emission and AGN activity
In this section, we investigate how the nuclear 3.3µm PAH emission is related to AGN activity. We collected from the literature all 3.3µm PAH measurements of Type I AGN, for which AGN luminosity and black hole mass can be compared. We found 3.3µm PAH measurements for 20 local Seyfert 1 galaxies and PG QSOs based on the previous ground-based long-slit observations (Rodríguez-Ardila & Viegas, 2003; Imanishi & Wada, 2004; Watabe et al., 2008; Oi et al., 2010; Imanishi et al., 2011). These measurements based on the long-slit spectroscopy with a narrow slit represent the strength of the nuclear 3.3µm PAH emission. Except for 3 AGN without necessary measurements of AGN properties in the literature, we determined black hole mass and AGN continuum luminosity at 5100Å. Thus, we have a sample of 17 local Type I AGN as listed in Table 3.
For black hole masses, we adopted the reverberation mapping measurements from Peterson et al. (2004) and Bentz et al. (2009b), after calibrating with the most recent determination of the virial factor from Woo et al. (2010). When reverberation mapping results were not available, we used the single-epoch virial method as used for the moderate-luminosity AGN sample. In practice we use the following equation to estimate black hole masses (Park et al. 2011):
| (1) |
where is the line dispersion of the H line and L5100,nuc is the AGN continuum luminosity at 5100Å corrected for the host galaxy starlight contribution. For NGC 4235, NGC 5273, and NGC5940 with no line width measurements in the literature, we fit the broad H emission line and measured the line width and luminosity using the spectra from the Sloan Digital Sky Survey. For two objects (Mrk 530 and Mrk 618) without any available spectra, we used the black hole mass -galaxy property relations, i.e., Mand MBH-Lbulge relations (Gültekin et al., 2009) to calculate black hole masses (see Table 3 for details).
In the case of AGN power, we collect AGN continuum luminosity at 5100Å as a proxy for the bolometric luminosity of AGN. For high luminosity QSOs, i.e., PG QSOs, it is not necessary to correct for the host galaxy starlight contribution. In contrast, for low luminosity AGN, L5100Å should be corrected for the host galaxy contamination. In general we obtained L5100Å,nuc measurements from previous studies, which were based on either bulge-disk decomposition analysis using HST images or spectral fitting analysis using high quality spectra. For 3 objects, namely NGC 4235, NGC5273, and NGC 5940, we determined AGN continuum luminosity from H line luminosity using the tight correlation between L5100Å,nuc and LHα (see Eq. 1 and 2 in Greene & Ho, 2005).
In contrast to the ground-based observations, L measured from AKARI observations represents the global starburst as discussed in § 3.1. Thus, in order to include the PAH emission measurements from AKARI observations, it was necessary to calibrate them for representing nuclear starburst. The relation between nuclear and global starburst for Type I AGN has not been studied in detail (Imanishi et al., 2010). Although the nuclear-to-global starburst ratio can vary for individual objects, we used the case of NGC 7469 to estimate the difference. As discussed in § 3.1, NGC 7469 was observed with a ground-based spectrograph with a narrow-slit and the AKARI IRC, respectively. The flux ratio between nuclear L and the upper limit of the global L is 0.04. Thus we took this ratio as a calibration factor and scale down the AKARI measurements by a factor of 0.04.
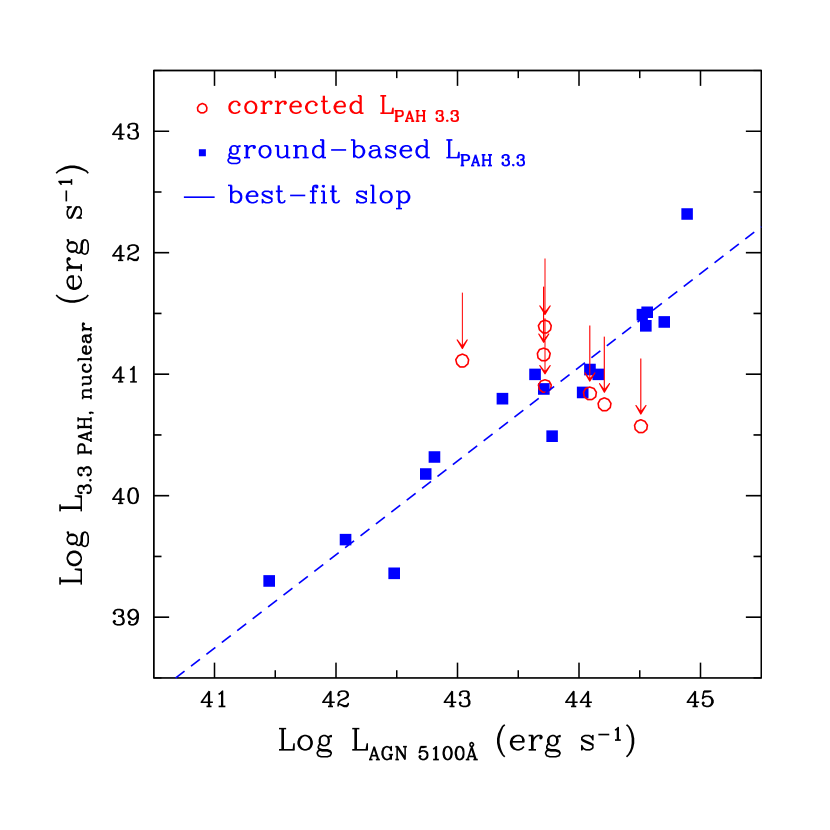
In Figure 5, we present the correlation between the nuclear 3.3µm PAH luminosity and AGN optical luminosity at 5100Å for the combined sample. The Type I AGN from ground-based observations clearly show a correlation, suggesting the nuclear starburst-AGN connection. The L of the moderate-luminosity AGN at z0.4, which are calibrated for representing the nuclear PAH emission, are consistent with the trend found by nuclear L measurements although they are more scattered probably due to the uncertainty of the calibration.
Using the nuclear L measurements from ground-based spectroscopy, we fit the relation between L and AGN luminosity. Since most of the L measurements in the literature do not have error estimates, we fit the best-slope without accounting for the measurement uncertainties. The best-fit relation is:
| (2) |
The best-fit slope of 0.8 indicates that the correlation is not linear. This implies that for higher luminosity AGN, the nuclear starburst-to-AGN luminosity ratio is smaller, albeit with the small sample size.
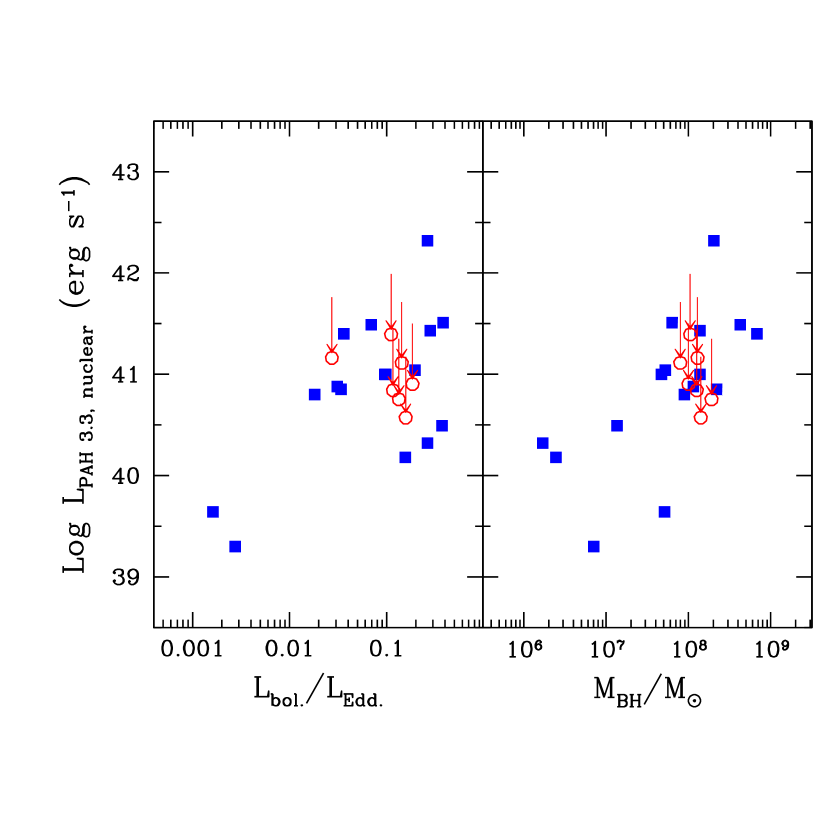
In Figure 6, we compare nuclear L with the Eddington ratio and black hole mass to test whether the accretion rate and black hole mass correlates with starburst activity. We estimate the Eddington ratio by multiplying a factor of 9 to the AGN optical luminosity. In the case of the Eddington ratio, there is a general trend that higher Eddington ratio objects show higher nuclear starburst activity although there is a large scatter. Black hole mass shows a similar trend with L in that the host galaxies of higher mass AGN show higher nuclear starburst luminosity. This can be interpreted as the trend that higher mass AGN in the sample are generally higher luminosity AGN, i.e., PG QSOs. Thus, the relation between black hole mass and PAH luminosity reflects the correlation between AGN power and L.
5. Discussion and Conclusions
To investigate the starburst-AGN connection, we compared the global and nuclear 3.3 µm PAH emission with AGN luminosity using a sample of Type I AGN. The global 3.3 µm PAH emission luminosities are measured for moderate-luminosity AGN at z0.4, based on our new AKARI slit-less spectroscopy, which covers the entire host galaxies. We find no strong correlation between 3.3 µm PAH and AGN optical luminosities within the limited AGN luminosity range 1044 - 1045 erg s-1. This result may imply that the global star formation is not strongly related with AGN activity although we cannot rule out a weak correlation with a considerable scatter. We note that since the AGN luminosity range is very limited, whether the global star formation rate correlates with AGN activity is inconclusive.
In contrast, when we compare AGN luminosity of the local Seyfert 1 galaxies and PG QSOs with their nuclear 3.3 µm PAH emission luminosity, we detect a strong correlation, suggesting that that AGN activity is related to the nuclear starburst. These results are consistent with the findings of previous studies on the starburst-AGN connection (Imanishi, 2003; Imanishi & Wada, 2004; Netzer et al., 2007; Lutz et al., 2008; Oi et al., 2010).
The slope of the L correlation with AGN luminosity in Figure 5 shows that the L to AGN luminosity ratio decreases toward higher AGN luminosity. At face value, it implies that the nuclear starburst activity is slightly suppressed in the host galaxies of high luminosity AGN (for different predictions on the starburst-to-accretion ratios, see e.g., Kawakatu & Wada 2008; Ballantyne 2008). A similar trend was noted by Lutz et al. (2008) in comparing 7.7 µm PAH emission and AGN luminosities. In their study, high luminosity AGN with L5100Å 1046 erg s-1 show a much lower starburst-to-AGN ratio (see Figure 6 in Lutz et al., 2008), implying that the black hole growth rate normalized by the starburst rate is a factor of 10 higher in their high redshift QSOs than in the local AGN. In our local sample the decrease of the starburst-to-AGN ratio with increasing AGN luminosity is not as dramatic as in high redshift QSOs, but if confirmed, it implies that for low-luminosity AGN the growth of galaxy centers is faster than black hole growth in the present-day universe. However, it is not clear whether black hole growth is slower or faster than the total host galaxy growth since only nuclear starbursts are compared in our analysis.
We note that there are many AGN with no PAH emission detection. Including the upper limits of these objects significantly weakens the correlation between L and AGN luminosity. Although the true PAH luminosities of these objects may be close to the upper limits within a factor of few, a detailed investigation using a large sample with lower flux limits is necessary to probe the slope and scatter of the correlation.
References
- Ballantyne (2008) Ballantyne, D. R. 2008, ApJ, 685, 787
- Bennert et al. (2010) Bennert, V. N., Treu, T., Woo, J.-H., Malkan, M. A., Le Bris, A., Auger, M. W., Gallagher, S., & Blandford, R. D. 2010, ApJ, 708, 1507
- Bennert et al. (2011) Bennert, V. N., et al. 2011, ApJ, submitted
- Bentz et al. (2009b) Bentz, M. C., Peterson, B. M., Netzer, H., Pogge, R. W., & Vestergaard, M. 2009b, ApJ, 697, 160
- Bentz et al. (2009a) Bentz, M. C., et al. 2009a, ApJ, 705, 199
- Ciotti & Ostriker (2007) Ciotti, L., & Ostriker, J. P. 2007, ApJ, 665, 1038
- Clavel et al. (2000) Clavel, J., et al. 2000, A&A, 357, 83
- Croton et al. (2006) Croton, D. J., et al. 2006, MNRAS, 365, 11
- Ferrarese & Merritt (2000) Ferrarese, L., & Merritt, D. 2000, ApJ, 539, L9
- Galliano et al. (2008) Galliano, F., Madden, S. C., Tielens, A. G. G. M., Peeters, E., & Jones, A. P. 2008, ApJ, 679, 310
- Gebhardt et al. (2000) Gebhardt, K., et al. 2000, ApJ, 539, L13
- Greene & Ho (2005) Greene, J. E., & Ho, L. C. 2005, ApJ, 630, 122
- Gültekin et al. (2009) Gültekin, K., et al. 2009, ApJ, 698, 198
- Ho & Kim (2009) Ho, L. C., & Kim, M. 2009, ApJS, 184, 398
- Hopkins et al. (2006) Hopkins, P. F., Hernquist, L., Cox, T. J., Di Matteo, T., Robertson, B., & Springel, V. 2006, ApJS, 163, 1
- Hopkins et al. (2007) Hopkins, P. F., Hernquist, L., Cox, T. J., Robertson, B., & Krause, E. 2007, ApJ, 669, 45
- Hopkins et al. (2009) Hopkins, P. F., Hernquist, L., Cox, T. J., Keres, D., & Wuyts, S. 2009, ApJ, 691, 1424
- Imanishi (2003) Imanishi, M. 2003, ApJ, 599, 918
- Imanishi & Alonso-Herrero (2004) Imanishi, M., & Alonso-Herrero, A. 2004, ApJ, 614, 122
- Imanishi & Wada (2004) Imanishi, M., & Wada, K. 2004, ApJ, 617, 214
- Imanishi et al. (2008) Imanishi, M., Nakagawa, T., Ohyama, Y., Shirahata, M., Wada, T., Onaka, T., & Oi, N. 2008, PASJ, 60, 489
- Imanishi et al. (2010) Imanishi, M., Nakagawa, T., Shirahata, M., Ohyama, Y., & Onaka, T. 2010, ApJ, 721, 1233
- Imanishi et al. (2011) Imanishi, M., Ichikawa, K., Takeuchi, T., Kawakatu, N., Oi, N., & Imase, K. 2011, PASJ, 63, 447
- Kauffmann & Haehnelt (2000) Kauffmann, G., & Haehnelt, M. 2000, MNRAS, 311, 576
- Kawakatu & Umemura (2004) Kawakatu, N., & Umemura, M. 2004, ApJ, 601, L21
- Kawakatu & Wada (2008) Kawakatu, N., & Wada, K. 2008, ApJ, 681, 73
- Laurent et al. (2000) Laurent, O., Mirabel, I. F., Charmandaris, V., Gallais, P., Madden, S. C., Sauvage, M., Vigroux, L., & Cesarsky, C. 2000, A&A, 359, 887
- Le Floc’h et al. (2001) Le Floc’h, E., Mirabel, I. F., Laurent, O., Charmandaris, V., Gallais, P., Sauvage, M., Vigroux, L., & Cesarsky, C. 2001, A&A, 367, 487
- Lutz et al. (2007) Lutz, D., et al. 2007, ApJ, 661, L25
- Lutz et al. (2008) Lutz, D., et al. 2008, ApJ, 684, 853
- Merloni et al. (2010) Merloni, A., Bongiorno, A., Bolzonella, M., et al. 2010, ApJ, 708, 137
- Nelson & Whittle (1995) Nelson, C. H., & Whittle, M. 1995, ApJS, 99, 67
- Netzer et al. (2007) Netzer, H., et al. 2007, ApJ, 666, 806
- Netzer (2009) Netzer, H. 2009, ApJ, 695, 793
- Ogle et al. (2006) Ogle, P., Whysong, D., & Antonucci, R. 2006, ApJ, 647, 161
- Ohyama et al. (2007) Ohyama, Y., et al. 2007, PASJ, 59, 411
- Oi et al. (2010) Oi, N., Imanishi, M., & Imase, K. 2010, PASJ, 62, 1509
- Onaka et al. (2007) Onaka, T., et al. 2007, PASJ, 59, 401
- Park et al. (2011) Park, D., et al. 2011, ApJ, submitted
- Peterson et al. (2004) Peterson, B. M., Ferrarese, L., Gilbert, K. M., et al. 2004, ApJ, 613, 682
- Rodríguez-Ardila & Viegas (2003) Rodríguez-Ardila, A., & Viegas, S. M. 2003, MNRAS, 340, L33
- Ryan et al. (2007) Ryan, C. J., De Robertis, M. M., Virani, S., Laor, A., & Dawson, P. C. 2007, ApJ, 654, 799
- Sales et al. (2010) Sales, D. A., Pastoriza, M. G., & Riffel, R. 2010, ApJ, 725, 605
- Schweitzer et al. (2006) Schweitzer, M., et al. 2006, ApJ, 649, 79
- Shi et al. (2007) Shi, Y., Ogle, P., Rieke, G. H., et al. 2007, ApJ, 669, 841
- Shi et al. (2009) Shi, Y., Rieke, G. H., Ogle, P., Jiang, L., & Diamond-Stanic, A. M. 2009, ApJ, 703, 1107
- Smith et al. (2007) Smith, J. D. T., et al. 2007, ApJ, 656, 770
- Springel et al. (2005) Springel, V., Di Matteo, T., & Hernquist, L. 2005, MNRAS, 361, 776
- Szathmary et al. (2011) Szathmary, D. et al. 2011, ApJ, submitted
- Tokunaga et al. (1991) Tokunaga, A. T., Sellgren, K., Smith, R. G., Nagata, T., Sakata, A., & Nakada, Y. 1991, ApJ, 380, 452
- Treu et al. (2004) Treu, T., Malkan, M. A., & Blandford, R. D. 2004, ApJ, 615, L97
- Treu et al. (2007) Treu, T., Woo, J.-H., Malkan, M. A., & Blandford, R. D. 2007, ApJ, 667, 117
- van Dokkum (2001) van Dokkum, P. G. 2001, PASP, 113, 1420
- Watabe et al. (2008) Watabe, Y., Kawakatu, N., & Imanishi, M. 2008, ApJ, 677, 895
- Woo & Urry (2002) Woo, J.-H., & Urry, C. M. 2002, ApJ, 579, 530
- Woo et al. (2006) Woo, J.-H., Treu, T., Malkan, M. A., & Blandford, R. D. 2006, ApJ, 645, 900
- Woo et al. (2008) Woo, J.-H., Treu, T., Malkan, M. A., & Blandford, R. D. 2008, ApJ, 681, 925
- Woo et al. (2010) Woo, J.-H., et al. 2010, ApJ, 716, 269