Higher harmonic anisotropic flow measurements of charged particles at 2.76 TeV with the ALICE detector ††thanks: Presented at the conference Strangeness in Quark Matter 2011, Cracow, Poland
Abstract
We report the measurements of elliptic flow , as well as higher harmonics triangular flow and quadrangular flow , in 2.76 TeV Pb–Pb collisions, measured with the ALICE detector. We show that the measured elliptic and triangular flow can be understood from the initial spatial anisotropy and its event–by–event fluctuations. The resulting fluctuations of and are also discussed.
1 Introduction
Anisotropic flow is an good observable to study hot and dense matter created in heavy-ion collisions. The second order harmonic anisotropic flow [1], was studied from SPS to LHC energies [2, 3, 4] as summarized in [5]. Recently it has been argued that due to initial event–by–event geometry fluctuations the third harmonic , called triangular flow, is finite [6]. In these proceedings, we will discuss the anisotropic flow and its fluctuations measured for charged particles in 2.76 TeV Pb–Pb collisions.
2 Data sample and analysis
For this analysis in these proceedings the ALICE Inner Tracking System (ITS) and the Time Projection Chamber (TPC) were used to reconstruct charged particle tracks within 0.8 and 0.2 5.0 GeV/. The VZERO counters and the Silicon Pixel Detector (SPD) were used for the trigger. Only the events whose primary vertex was found within 7 cm from the centre of the detector along the beam direction were selected. The tracks are required to have at least 70 reconstructed points in the TPC and a per TPC cluster 4. The collision centrality determination utilized the VZERO detectors. From the study of the collision centrality determined by different detectors [7], ZDC, TPC, SPD and VZERO, the centrality resolution is found to be 0.5 rms for the most central collisions, while it increases to 2 rms for peripheral collisions.
3 Results and discussion
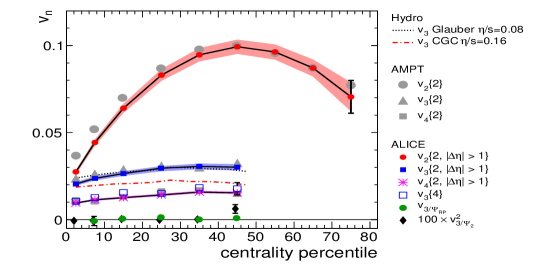
Figure 1 shows the centrality dependence of , and integrated over the interval 0.2 5.0 GeV/. To suppress non–flow effects on the 2–particle cumulant analysis, a minimum gap of one unit was used between the correlated particles. We correct for the estimated remaining non–flow contributions by using HIJING [9]. We observe that the magnitude of is much smaller than (except for the most central collisions) and does not show a strong centrality dependence. These measurements are described by hydrodynamic calculations based on Glauber initial conditions and , while they are underestimated by hydrodynamic calculations with MC–KLN initial conditions and [10]. The comparison suggests a small value of for the produced matter. The measured from the 4–particle cumulant is about a factor 2 smaller than the 2–particle cumulant estimate, which can be understood if originates predominantly from event–by–event fluctuations of the initial spatial geometry [11]. At the same time, we evaluate the correlation between and the reaction plane via . In addition the correlation of and also can be studied by a 5–particle correlator . In Fig. 1 we observe that and are consistent with zero within uncertainties. Based on these results, we conclude that develops as a correlation of all particles with respect to the third order participant plane , while there is no (or very weak) correlations between the (also for ) and the . Finally, from the comparison of AMPT model calculations with our measurements, we find that this model can describe the experimental data very well; there is only a slight overestimation of in the most central collisions [12].
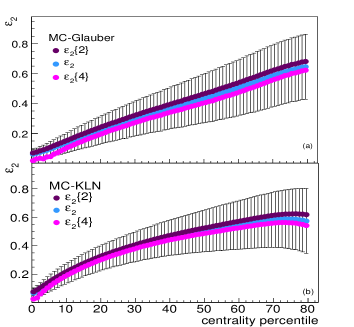
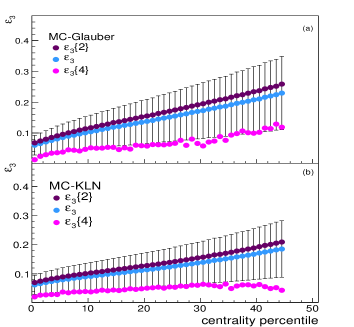
To investigate the role of viscosity on anisotropic flow measurements, we calculate the ratio and . Here and are the eccentricity and triangularity of the initial spatial geometry which are defined by
| (1) |
The definition of (also ) can be found in [13].
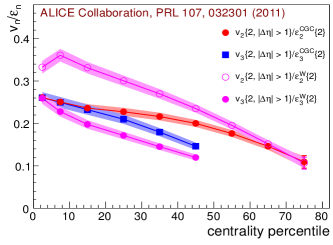
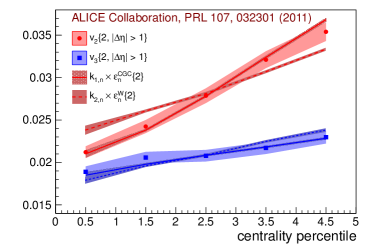
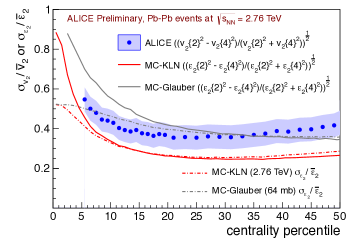
Figure 2 (left) shows the centrality dependence of the ratio . The are extracted from the MC–Glauber model (using the number of wounded nucleons) and the MC–KLN CGC model, denoted by and , respectively. Based on the assumption that , we get [13]. We observe that the is larger than in all centrality bins, which indicates significant viscous corrections. However, for the MC–KLN CGC model the magnitude of equals to in the most central collisions, which might be expected for an almost ideal fluid [10]. The ratio of decreases faster than from central to peripheral collisions, which is consistent with larger viscous corrections to . The collective flow should be directly sensitive to the change of the initial spatial geometry since the viscous effects do not change too much in the small centrality range. In Fig. 2 (right) we observe that in this centrality range does not show a strong centrality dependence while the increases significantly. The comparison of the scaled initial eccentricity shows that and can only be simultaneously described by and from the MC–KLN model.
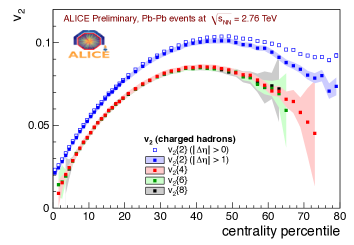
In order to reduce the event–by–event fluctuations within a centrality bin, we plot the integrated as a function of centrality in narrow bins, 1 centrality bins for 0–20 and 2 bins for 20–80 [7]. Elliptic flow estimated from 2–particle azimuthal correlations, , was obtained by using two different pseudorapidity gaps ( and ). The difference between the two measurements can be understood as resulting from non–flow effects. At the same time, the results of 4–, 6– and 8–particle cumulants estimates are shown in Fig. 3 (left). The good agreement of the multi-particle cumulants indicates that with 4–particle cumulants non–flow is strongly suppressed, so that there is little gain in suppressing it further by higher order cumulants (like 6– and 8–particle).
As shown by Gaussian fluctuations studies [14], in the limit of small fluctuations (), we can estimate the participant plane flow and its fluctuations with:
| (2) |
However, in the case of only fluctuations [14], we have
| (3) |
Also based on the assumption that is proportional to , the centrality dependence of eccentricity and its fluctuations should show behavior similar to that of flow. In Fig. 4 (left) we indeed observe a similar centrality dependence of with and the following equations are valid
| (4) |
with the exception of the most central collisions (for which does not hold).
The centrality dependence of the relative flow fluctuations are plotted in Fig. 3 (right). We find that the magnitude of relative flow fluctuations is around 40. Also we show the comparison of the relative flow fluctuations to (extracted from Eqs. (4)) from both the MC–Glauber model and the MC–KLN model. In mid-central and mid-peripheral collisions, the MC–Glauber model can describe the flow fluctuations while the MC–KLN model underestimates the measurements. In the more central collisions, neither the MC–Glauber nor the MC–KLN can describe the data. At the same time, we notice that from both the MC–Glauber model and the MC–KLN model reach in the most central collisions, which is consistent with the predictions if there are only fluctuations [14].
Assuming that originates from the initial geometry fluctuations (there are only flow fluctuations), we expect that . However, as we have shown in Fig. 1, the has a finite magnitude. In order to understand the fluctuations of , we look at the centrality dependence of triangularity . In Fig. 4 we observe that is still valid (or the ratio equals to ), but it seems that in the centrality bins we present here. Whether the fluctuations of are the dominant contribution to the fluctuations of is currently unknown.
4 Summary
In these proceedings we have presented the results on anisotropic flow measured in Pb–Pb collisions at =2.76 TeV by ALICE at the LHC. The measurements of higher harmonic anisotropic flow, in particular , provide new constraints on the initial anisotropy as well as the shear viscosity to entropy density ratio .
References
- [1] J.Y. Ollitrault, Phys. Rev. D 46 229 (1992)
- [2] C. Alt et al. (NA49 Collaboration), Phys. Rev. C 68, 034903 (2003)
- [3] K.H. Ackermann et al. (STAR Collaboration), Phys. Rev. Lett. 86, 402 (2001)
- [4] K. Aamodt et al. (ALICE Collaboration), Phys. Rev. Lett. 105, 252302 (2010)
- [5] S.A. Voloshin, A.M. Poskanzer and R. Snellings, in Landolt-Boernstein, Relativistic Heavy Ion Physics, Vol. 1/23, p 5-54 (Springer-Verlag, 2010)
- [6] B. Alver and G. Roland, Phys. Rev. C 81, 054905 (2010)
- [7] A. Toia, QM proceedings (2011)
- [8] K. Aamodt et al. (ALICE Collaboration), Phys. Rev. Lett. 107, 032301 (2011)
- [9] X.N. Wang, Phys. Rev. Lett. 86 3496 (2001)
- [10] B. Alver et al., Phys. Rev. C 82, 034901 (2010)
- [11] R.S. Bhalerao, M. Luzum and J.Y. Ollitrault, Phys. Rev. C 84, 034910 (2011)
- [12] J. Xu and C.M. Ko, Phys. Rev. C 84, 044907 (2011)
- [13] M. Miller and R. Snellings, arXiv:nucl-ex/0312008
- [14] S. Voloshin et al., Phys. Lett. B 659, 537 (2008)