1–12
Spectral models of stellar populations resolved in chemical abundances
Abstract
We present model spectra of stellar populations with variable chemical composition. We derived the [/Fe] abundance ratio of the stars of the most important libraries (ELODIE, CFLIB and MILES) using full spectrum fitting and we generated PEGASE.HR models resolved in [/Fe]. We used a semi-empirical approach that combines the observed spectra with synthetic stellar spectra. We tested the models using them to derive [/Fe] in galaxies and star clusters using full spectrum fitting. The present models are available from http://ulyss.univ-lyon1.fr
keywords:
galaxies: stellar content, galaxies: abundances, stars: fundamental parameters1 Introduction
The comparison between models and observations is the key to derive the metallicity, age and star formation history of galaxies and star clusters. The evolutionary synthesis of galaxies consists in choosing an initial mass function (IMF) and following the evolution of the population over the time according to some theoretical evolutionary tracks. This approach predicts the distribution of the stars in the effective temperature () vs. surface gravity (log g) plan at any epoch, and the final step is to draw spectra from a library to assemble the integrated spectrum.
The modelling of stellar populations steadily progressed since the first attempts in the 80s (e.g. Bruzual, 1983). Beside the metallicity, age and history, the detailed chemical composition became an important parameter to measure. This allows one to trace the source of metal enrichment, because of the different yields of type ia and ii supernovae. In turn, since both SN types correspond to different time-scales, this informs about the duration of the enrichment process. A population that produced its metal and formed its stars before the SNia onset will be deficient in Fe (or as more commonly said, over-abundant in -elements, like O and Mg). To vary the yield in the models, both the stellar library and the evolutionary tracks have in principle to be changed. However, Dotter et al. (2007) have shown that the tracks essentially depend on the total metallicity, rather than of the actual mixture. Therefore, the scaled-solar tracks can reasonably be used for any composition, provided they are associated with stellar spectra of the same total metallicity.
The models predict colours, used for SED fitting, spectra, and line-strength indices. Indices are equivalent-widths defined for a number of prominent spectral features and their study brings an approximate handle on the physical parameters (age, metallicity and/or detailed composition).
Several authors modeled indices with variable abundances of -elements relative to Fe (Weiss et al., 1995; Trager et al., 2000; Thomas et al., 2003). The approach consisted in evaluating the response of individual indices to changes of composition using theoretical spectra (Tripicco & Bell, 1995). Then, assuming that the abundance pattern in the library is matching that of the solar neighborhood (justified by the fact that the observed libraries consist of nearby stars), the indices could be estimated for any log g, [Fe/H] and [/Fe]. In the visible region of the spectrum, the variation of [/Fe] results in a prominent change of the Mgb index near 5175 Å, and therefore a combination of this index with some Fe indices could be used to derive the [/Fe] in galaxies and clusters.
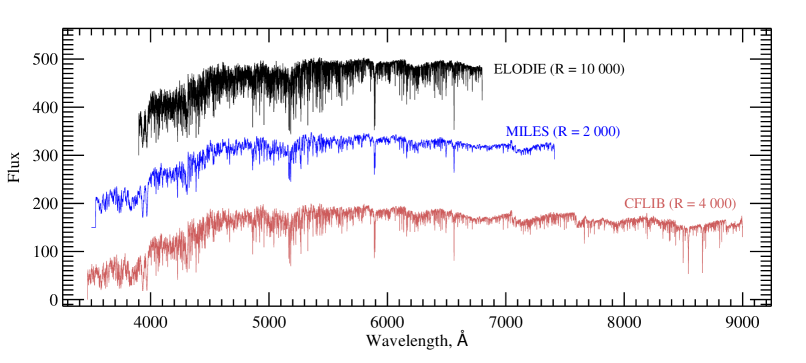
Models of indices were developing faster and further than the spectral predictions, because of the lack of stellar libraries calibrated in relative flux. However, the quality of the libraries also progressed. Libraries of about 1000 stars covering a wide range of the parameter space, with an extended coverage of the optical spectrum at mediun spectral resolution and a fair flux calibration became available. The three most important are ELODIE (Prugniel et al., 2007b, R=10000, Å), CFLIB (Valdes et al., 2004, R4000, Å) and MILES (Sánchez-Blázquez et al., 2006, R2000, Å).
In this paper, we present the first spectral models with variable [/Fe] based on these libraries and on precise measurements of [/Fe] in their stars.
2 Method
Previous attempts to produce semi-empirical spectral models with variable [/Fe] were made in Prugniel et al. (2007a), and Walcher et al. (2009). The latter one uses population models based on synthetic spectra to predict the differential change of each spectral element when [/Fe] is varied. This differential effect is then used to ‘correct’ empirical models to the desired -elements enrichment. The former method determines the differential changes of the stellar spectra and ‘correct’ the library before computing models at different [/Fe]. Both approachs are equivalent, and are based on the assumption that the libraries follow the abundance pattern of the solar neighborhood (i.e. they adopt a functional dependence of [/Fe] as a function of [Fe/H]). Models of Lick indices also make the same assumption.
Although the assumption of a relation between [/Fe] and [Fe/H] is statistically verified, [/Fe] present a significant dispersion at a given [Fe/H] (e.g. Milone et al., 2011). When the library is interpolated to extract the spectra entering in the synthesis, the stochastic effects can become significant. For example, for a local interpolation only a small number of library stars are used near a given location in the , log g and [Fe/H] space, and their mean [/Fe] may be biased. In order to avoid this effect, the improvement introduced in the present work is to determine [/Fe] in the individual stars of the library. Each stellar spectrum is then corrected to a set of given [/Fe] applying differential effects inferred from a theoretical library. An alternative may have been to measure [/Fe] and directly interpolate the spectra in the four-dimensional space. This would have avoided the dependency toward a theoretical library, but required some extrapolations, because of the non-uniform distribution of the stars in the [Fe/H] vs. [/Fe] plan,,
The approach is finally the following:
-
-
Measure [/Fe] in the spectra of the libraries.
-
-
Correct the library to some given values of [/Fe] using differential effects computed in a theoretical library.
-
-
Build interpolators for these corrected libraries. (these are functions returning a spectrum for given , log g, and [Fe/H].
-
-
Make model predictions at the chosen [/Fe].
3 Determination of [/Fe] in the stars
We used full-spectrum fitting with the ULySS package (Koleva et al., 2009) to measure [/Fe]. Full-spectrum fitting was successful to measure the other atmospheric parameters in the various libraries (Wu et al., 2011; Prugniel et al., 2011; Koleva & Vazdekis, 2011), and the precision and reliability was found consistent with detailed analysis using high-resolution spectroscopy.
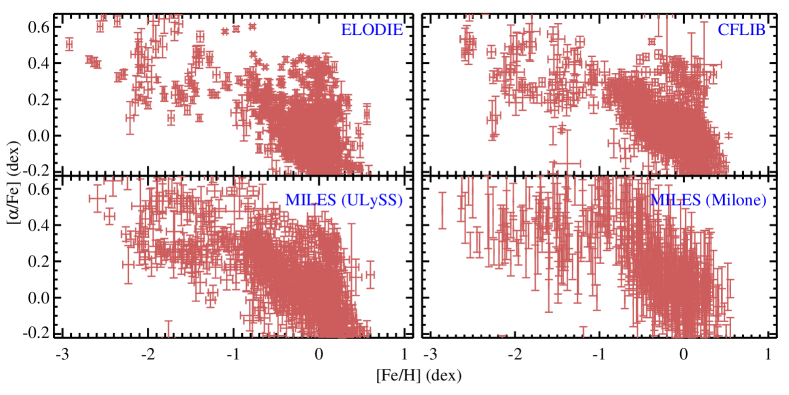
We measured [/Fe] by comparing the ELODIE spectra to the grid of Coelho et al. (2005). We minimized the residuals to derive the four atmospheric parameters. We measured [/Fe] only for , because of the limits of the grid of synthetic spectra. We assumed that the remaining stars follow the solar neighborhood abundance pattern. Then, we used the ELODIE library as a reference to measure [/Fe] in the other libraries, using the same full-spectrum fitting method.
The measurements compare well with the most precise measurements from the compilation of Milone et al. (2011). The distribution of [/Fe] vs. [Fe/H] is presented in Fig. 1 for the three libraries and compared to Milone et al. (2011).
4 Population models resolved in [/Fe]
We generated pairs of interpopators for [/Fe] dex, and computed grids of single stellar populations (SSPs) models with PEGASE.HR (Le Borgne et al., 2004). These pairs of grids were then grouped together to make four dimensional arrays (wavelength, age, [Fe/H] and [/Fe]) that can be used with ULySS to determine the three SSP-equivalent parameters. Figure 2 is a snapshot of models made with the three libraries.
We used these models to analyze Galactic globular clusters spectra as in Koleva et al. (2008), and we found results consistent with the determinations based on spectroscopy of resolved stars. We also applied the method to study spectra of galaxies from Koleva et al. (2011) and we found that the results are consistent with those from Lick indices, but they are more precise. The gain in precision reflects the better usage of the information. Mgb accounts for less than 20 % of the total opacity change in the optical range ( Å) when [/Fe] varies, and using the whole spectral range with full-spectrum fitting is a clear advantage.
5 Prospective
This semi-empirical method, used to build models of stellar populations resolved in [/Fe], can straightforwardly be applied to resolve other individual elements. The key point is to have reliable synthetic grids of spectra to determine the differential effects. The Coelho et al. (2005) grid already resolve Ca independently of the -elements, and other grids, varying other elements will be computed in the future.
The models presented here are available at http://ulyss.uly-lyon1.fr. They can be used with the ULySS package to measure [/Fe] in galaxies and clusters.
References
- Bruzual (1983) Bruzual, G. 1983, ApJ, 273, 105
- Coelho et al. (2005) Coelho, P., Barbuy, B., Meléndez, J., Schiavon, R. P., & Castilho, B. V. 2005, A&A, 443, 735
- Dotter et al. (2007) Dotter, A., Chaboyer, B., Ferguson, J. W., et al. 2007, ApJ, 666, 403
- Koleva et al. (2008) Koleva, M., Gupta, R., Prugniel, P., & Singh, H. 2008, in Astronomical Society of the Pacific Conference Series, Vol. 390, Pathways Through an Eclectic Universe, ed. J. H. Knapen, T. J. Mahoney, & A. Vazdekis, 302
- Koleva et al. (2009) Koleva, M., Prugniel, P., Bouchard, A., & Wu, Y. 2009, A&A, 501, 1269
- Koleva et al. (2011) Koleva, M., Prugniel, P., de Rijcke, S., & Zeilinger, W. W. 2011, MNRAS, 417, 1643
- Koleva & Vazdekis (2011) Koleva, M. & Vazdekis, A. 2011, ArXiv e-prints, 1111.5449
- Le Borgne et al. (2004) Le Borgne, D., Rocca-Volmerange, B., Prugniel, P., et al. 2004, A&A, 425, 881
- Milone et al. (2011) Milone, A. D. C., Sansom, A. E., & Sánchez-Blázquez, P. 2011, MNRAS, 414, 1227
- Prugniel et al. (2007a) Prugniel, P., Koleva, M., Ocvirk, P., Le Borgne, D., & Soubiran, C. 2007a, in IAU Symposium, Vol. 241, IAU Symposium, ed. A. Vazdekis & R. F. Peletier, 68–72
- Prugniel et al. (2007b) Prugniel, P., Soubiran, C., Koleva, M., & Le Borgne, D. 2007b, arXiv:astro-ph/0703658
- Prugniel et al. (2011) Prugniel, P., Vauglin, I., & Koleva, M. 2011, A&A, 531, A165
- Sánchez-Blázquez et al. (2006) Sánchez-Blázquez, P., Peletier, R. F., Jiménez-Vicente, J., et al. 2006, MNRAS, 371, 703
- Thomas et al. (2003) Thomas, D., Maraston, C., & Bender, R. 2003, MNRAS, 339, 897
- Trager et al. (2000) Trager, S. C., Faber, S. M., Worthey, G., & González, J. J. 2000, AJ, 119, 1645
- Tripicco & Bell (1995) Tripicco, M. J. & Bell, R. A. 1995, AJ, 110, 3035
- Valdes et al. (2004) Valdes, F., Gupta, R., Rose, J. A., Singh, H. P., & Bell, D. J. 2004, ApJS, 152, 251
- Walcher et al. (2009) Walcher, C. J., Coelho, P., Gallazzi, A., & Charlot, S. 2009, MNRAS, 398, L44
- Weiss et al. (1995) Weiss, A., Peletier, R. F., & Matteucci, F. 1995, A&A, 296, 73
- Wu et al. (2011) Wu, Y., Singh, H. P., Prugniel, P., Gupta, R., & Koleva, M. 2011, A&A, 525, A71