Magnetism and superconductivity in Eu0.2Sr0.8(Fe0.86Co0.14)2As2 probed by 75As NMR
Abstract
We report bulk superconductivity (SC) in Eu0.2Sr0.8(Fe0.86Co0.14)2As2 single crystals by means of electrical resistivity, magnetic susceptibility, and specific heat measurements with c 20 K with an antiferromagnetic (AFM) ordering of Eu2+ moments at N 2.0 K in zero field. 75As NMR experiments have been performed in the two external field directions (H) and (H). 75As-NMR spectra are analyzed in terms of first order quadrupolar interaction. Spin-lattice relaxation rates (1/) follow a law in the temperature range 4.2-15 K. There is no signature of Hebel-Slichter coherence peak just below the SC transition indicating a non -wave or s± type of superconductivity. The increase of 1/ with lowering the temperature in the range 160-18 K following law reflecting 2D AFM spin fluctuations.
1 Introduction
The recent discovery of superconductivity (SC) in Fe based pnictides has attracted considerable attention in the condensed matter physics community to understand the microscopic origin of the SC and its relation to the Fe based magnetism [1, 2, 3, 4, 5, 6, 7]. In this diverse branch of pnictides one family of materials AFe2As2(A=Ca, Sr, Ba, Eu) (abbreviated as 122 series) with the crystal structure of ThCr2Si2 type exhibits the SC with the transition temperatures ’s as high as 38 K[8, 9, 10]. Interestingly in this 122 family, EuFe2As2 is the only member which has a rare earth moment Eu2+ (S=7/2) corresponding to a theoretical effective moment of 7.94 . Here the antiferromagnetic (AFM) ordering of Eu2+ moments take place at 19 K and Fe order AFM (SDW type) at 190 K, which is the highest reported SDW transition temperature among the pnictide family [11, 12, 14]. The SC could be found in this compound with the suppression of the Fe ordering by the K substitution (hole doping) at the Eu2+ site with ’s upto 32 K [8]. In addition to that SC has been observed in chemically pressurized EuFe2(As1-xPx)2 alloys accompanied by the Eu2+ ordering [15, 16].
In contrast to the other 122 systems, in EuFe2As2, on suppression of the AF order of iron with pressure or Co doping, the onset of SC was observed, however seem to be hindered to reach zero resistivity because of the magnetic ordering of Eu2+ [17, 18, 19]. Nevertheless by substituting 80 Sr at the Eu2+ and optimal Co doping at the Fe site one can suppress the AFM ordering of Eu2+, and Fe SDW ordering, respectively. Eventually, SC with the ’s 20 K is being observed [20]. Apart from the SC, this system could be also interesting to study the interplay between Fe- and Eu- magnetism. Especially if there is any coupling present between the two subsystem (Fe- and Eu-). Here it is worth to mention the Eu2+ ordering at 19 K in EuFe2As2 perhaps makes this system much more interesting, because this could additionally opens up the opportunity to clarify the mechanism of the interplay between the and magnetism and also the influence of Eu2+ magnetism on the SC. It has been already suggested from different experiments that there is coupling between the localized Eu2+ moments and the conduction electrons of the two dimensional Fe2As2 layers [21, 22, 23].
In this paper we present the electrical resistivity (), magnetic susceptibility (), and heat capacity () measurements on superconducting Eu0.2Sr0.8(Fe0.86Co0.14)2As2 (abbreviated as ESFCA) single crystal. All these experiments are complemented by 75As NMR measurements to shed light on the microscopic properties. Here it is worth emphasizing numerous NMR investigations have been done to understand the microscopic mechanism of the 122 (Ca, Sr, Ba) based superconductors, for instance [Ref[24, 25, 26, 27, 28]]. However, to the best of our knowledge there is only one reported NMR investigation on this Eu based 122 system, namely EuFe1.9Co0.1As2. Guguchia et. al. have suggested, there is strong coupling between the Eu2+ moments and the Fe1.9Co0.1As2 layers [29]. However, authors have not focused on the superconducting region. Therefore still there is a scope to investigate the Eu based pnictides superconductors to simplify the superconducting mechanism and the possible role of Eu magnetism on the supeconducting state. We believe our present investigations will answer this questions adequately.
2 Experimental details
Single crystals of Eu0.2Sr0.8Fe2As2 and ESFCA were synthesized using Sn flux method. Nominal stoichiometric amounts (0.8:0.2:2:2 for Sr0.8Eu0.2Fe2As2 and 0.8:0.2:1.4:0.6:2 for ESFCA) of the respective starting elements were taken in a alumina crucibles, sealed in a quartz tube under Ar atmosphere. The batches were heated to 1300 ∘C at a rate of 100 ∘C/h and stayed for 6h and then cooled to 900 ∘C with the rate 3∘C/h. Crystals were extracted by etching in diluted HCl acid. The stoichiometry of a representative crystals was confirmed by semiquantitative energy-dispersive x-ray (EDX) microanalysis. Zero field cooled (ZFC) and field cooled (FC) magnetic susceptibility () as a function of temperature was measured using a commercial Quantum Design SQUID magnetometer with field applied along the direction () and in the plane () of the crystal. Temperature dependent (T) and (T) measurements were performed using a Quantum Design Physical Property Measurement System (PPMS) for only. All the above measurements were carried out down to 1.8 K except that (T) was measured down to 0.37 K by using an additional 3He cooling system. The NMR measurements were carried out using the conventional pulsed NMR technique on 75As (nuclear spin and gyromagnetic ratio MHz/T) nuclei in a temperature range K K. The measurements were done at a radio frequency of 48 MHz in single crystals with external magnetic field H applied along the c direction () and within the plane (). For this purpose we have taken five single crystals and glued them on top of each other to make a stack of single crystals. The field sweep NMR spectra were obtained by integrating the spin-echo in the time domain and plotting the resulting intensity as a function of the field. The spin lattice relaxation rate () measurements were also performed at 48 MHz in both the field directions ( and ) following the standard saturation recovery method by exciting the central transition of 75As spectra.
3 Results and Discussion
3.1 Electrical Resistivity, Magnetic Susceptibility and Specific Heat
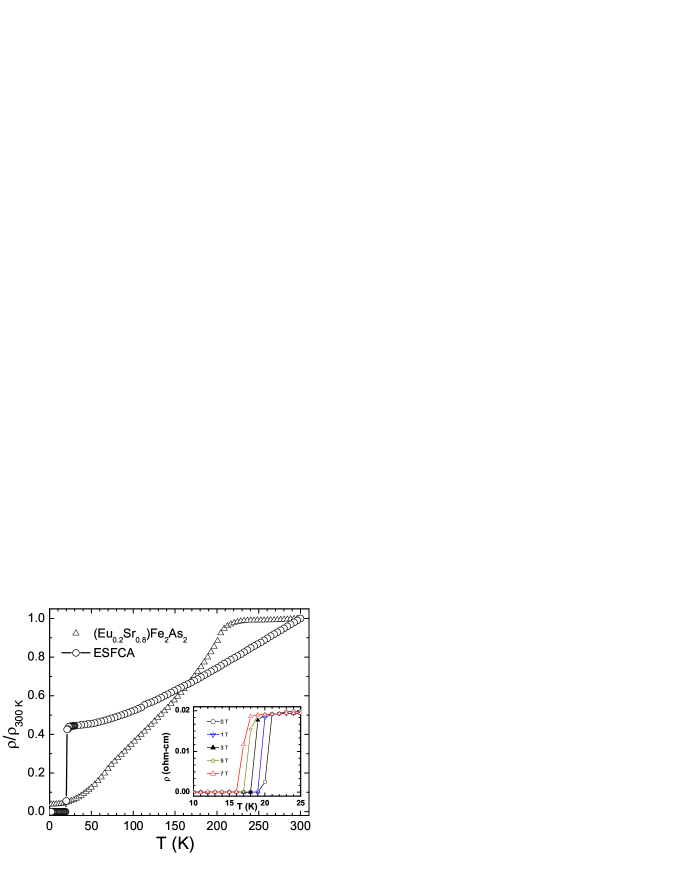
The results of the electrical resistivity normalized by the room temperature value ((T)) as a function of temperature is presented in Fig. 1 for (Eu0.2Sr0.8)Fe2As2 and ESFCA crystals. (T) for (Eu0.2Sr0.8)Fe2As2 is weakly temperature dependent at high temperatures, shows a broad hump at 210 K, and then decreases almost linearly with decrease in temperature for K before it attains a saturation value at 20 K. The broad hump at 210 K is an indication of the SDW transition which is about 15 K higher than the transition temperature reported for the parent compound EuFe2As2 [12]. The linear decrease of (T) points towards the metallic nature of the compound. No trace of superconductivity or Eu2+ordering was found down to 2 K suggesting that the Eu2+ ordering at 19 K reported for EuFe2As2 is suppressed below 2 K after 80% Sr doping at the Eu site. The overall behaviour of (T) is identical to the previous report on the parent compound EuFe2As2[12] except that the SDW transition temperature is enhanced and the Eu2+ ordering is suppressed. At 300 K and 2 K the values of are about 16 m-cm and 0.59 m-cm, respectively yielding a residual resistivity ratio () of 27. Such a high value of is indicative of a high quality sample with only small amount of disorder present in the material. As shown in Fig. 1 for 14% Co substitution at the Fe site, the SDW transition is suppressed completely, and shows a linear decrease with temperature down to 25 K. At K, (T) drops abruptly and reaches zero value by 20 K due to the onset of superconductivity. The low- part of measured at various applied fields () is plotted in the inset of Fig. 1 to highlight the variation of superconducting transition temperature () with H. As the field increases, the decreases gradually.
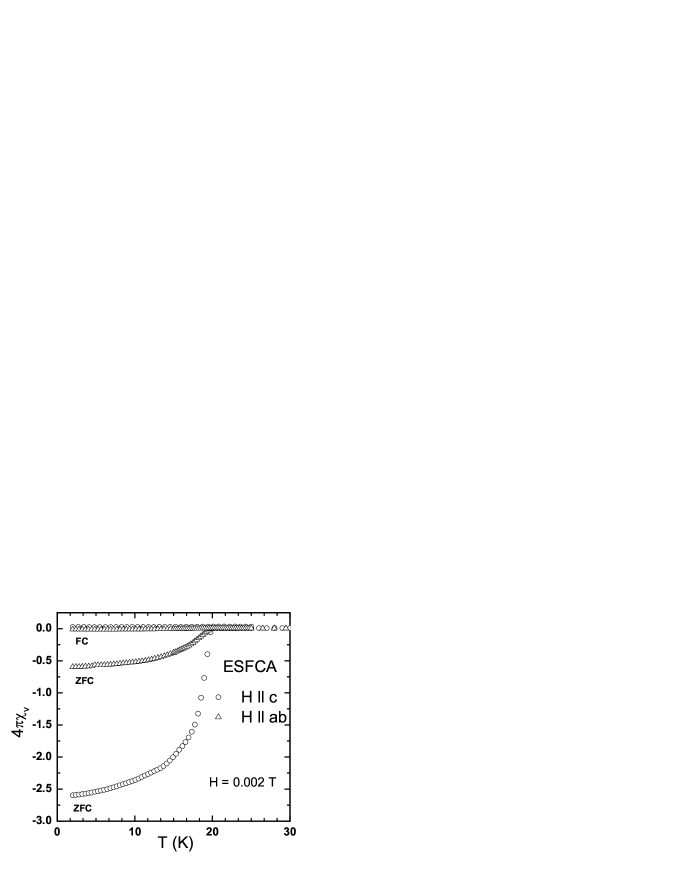
Beside the transport measurements magnetic measurements are performed to probe the superconducting transition. Figure 2 shows the ZFC and FC dc susceptibility for the two directions. The field applied is 0.002 T and (T) is plotted in units of where indicate complete diamagnetic behaviour. The superconducting transition at about 20 K is confirmed by the ZFC signal. Here for is strongly enhanced for the H direction which could be assigned to the demagnetization effect. Furthermore the finite size of the crystal in relation to the superconducting penetration depth also influence the magnetization. The a and b dimension are larger than the c dimension which strongly increases the demagnetization factor resulting to an enhanced magnetization for that direction. Down to 1.8 K, no signature of Eu2+ ordering was observed in the ZFC and FC (T) measurements. Nevertheless an AFM transition superimposed by a large response from a superconducting transition is not easy to resolve in the SQUID.
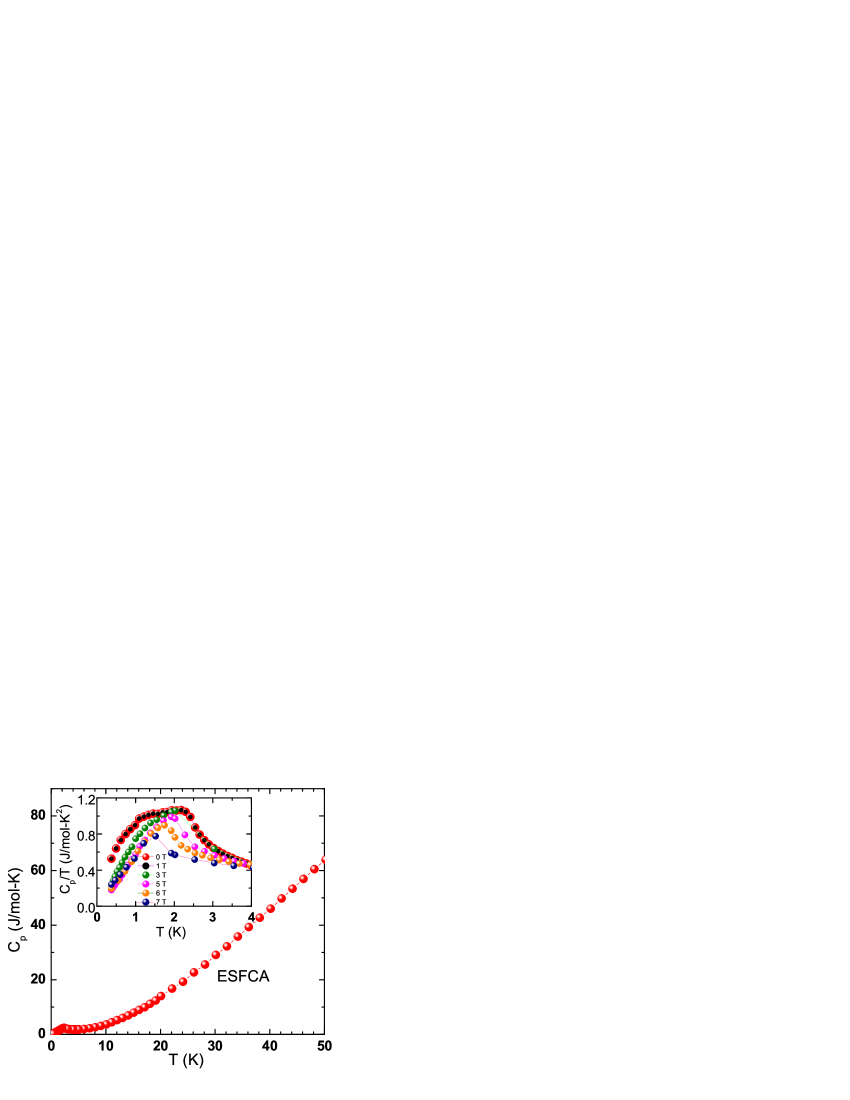
As a final proof we carried out specific heat measurements on single crystals, to check whether there exists the heat capacity jump associate with and how far the Eu2+ ordering is suppressed, over the temperature range . Figure 3 shows the (T) data measured at zero field. The SC transition is not visible because the small jump of 0.8 J/mol-K at 20 K could not be easy to extract from the phonon dominate specific heat[13]. Nonetheless the magnetic ordering of Eu2+ could be clearly identified. A sharp anomaly however was observed at about 2 K which can be attributed to the Eu2+ ordering (). To understand the nature of the magnetic ordering we measured (T) at different applied fields upto 7 T in the low- regime and vs. is presented in the inset of Fig. 3. With increase in field the height of the anomaly decreases and was found to move towards low temperatures as is expected for an AFM ordering. Furthermore integrating over temperature range 0.37-6 K associated with the anomaly reveals an entropy gain S=4, which is 23 of Rln8.
3.2 75As NMR
75As-NMR measurements are performed on the two different
crystallographic directions (H and
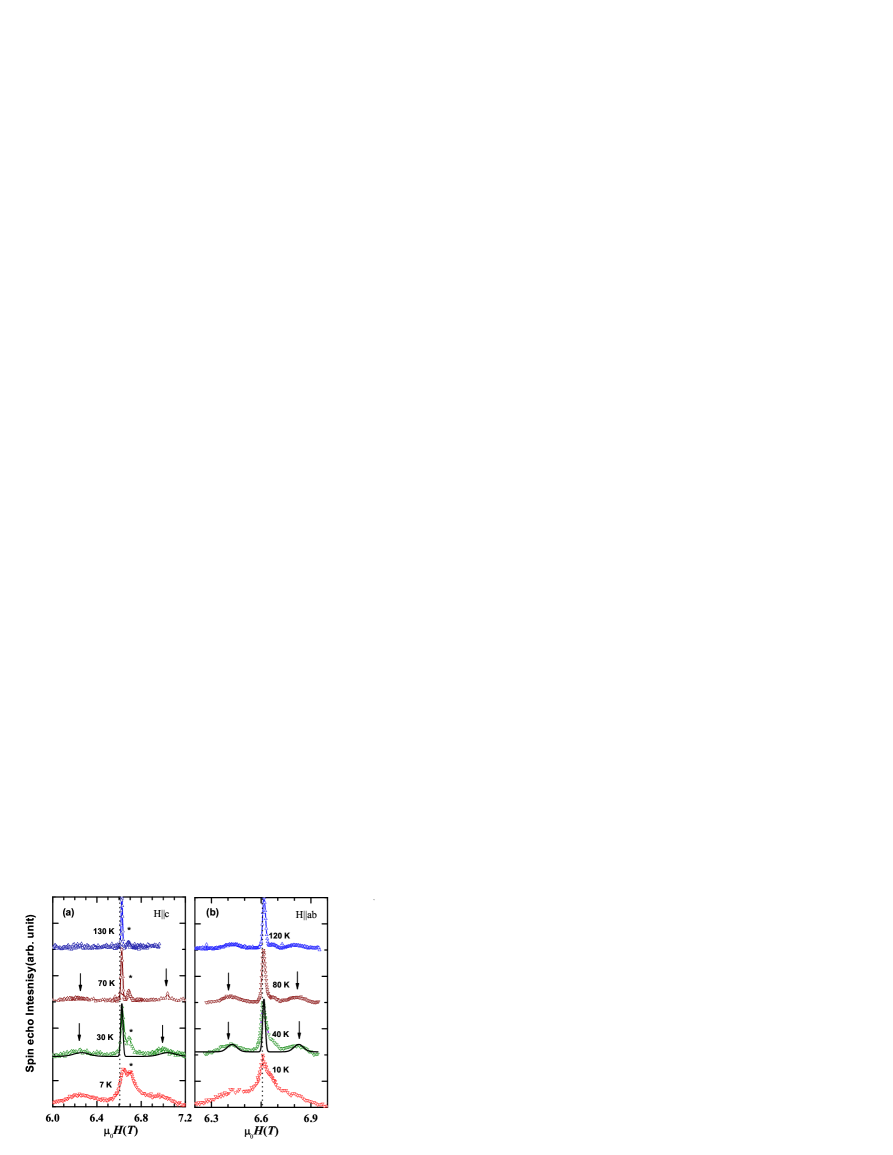
H). 75As-field sweep NMR spectra are shown in
Fig. 4. For both configurations, along with the most
intense central line the spectrum contains extra shoulder-like
features on either side. 75As has an electric quadrupolar
moment that interacts with the local electric field gradient
(EFG) in the crystal giving rise to the splitting of the NMR
line. Therefore in principle, in case of lower crystal symmetry
system (for example tetragonal and orthorhombic symmetry), one
should see in the 75As spectra three allowed transitions:
central transition, and
the two satellite
transitions. Thus the extra shoulders in the experimental spectra
correspond to the first order splitting satellite transitions as
indicated by the downward arrows in Fig. 4. In an attempt
to fit the experimental spectra taking into account both the EFG
and the Knight shift effects in different axes, we find that the
spectra 30 K (H) and 40 K (H) can be
fitted reasonably well with the parameters (Knight-shift , quadrupolar frequency
MHz, width of central peak kHz, width of satellite
kHz, and EFG asymmetry parameter )
and (, MHz,
width of central peak kHz, width of satellite
kHz, and ), respectively (see
Fig. 4) These values are slightly higher than
that reported for single crystalline SrFe2As2 compound
[30]. The central line position is found to be
almost temperature independent or shifting very weakly. At low
temperatures, the NMR line is found to be broaden abruptly. As
seen from the (T) measurements Eu2+ orders
antiferromagnetically below 2 K. Thus our NMR line broadening
possibly arising due to the persistent magnetic correlation while
approaching the Eu2+ ordering.
Rather broad satellite transitions are observed in
comparison to the sharp central transition indicating a
distribution of EFG. Due to the doping of Sr and Co, the
disorderness has been inevitably introduced in this system,
resulting a rather distribution of EFG. In Fig. 4(a)
apart from the central and satellite transition another small
peak is observed at around 6.65 T (assigned as ). The small
peak is originated because of the substitution of 14 Co at
the Fe site which essentially modify the As neighbors
[25]. By lowering the temperature the central
transition and the line marked by the , broadens and
shifted concurrently to some equal extent. This perhaps indicates
that As in the midst of different nearest neighbors have sensed
the same magnetism. The perceptible line broadening could be
described by two possibilities. First with lowering of the
temperature the inevitable disorderness of this alloy have
sponsored some additional line broadening and the second one
could be associated with Eu2+ AFM ordering at low
temperature. Nevertheless, the second argument is more likely as
this supports field dependent specific heat scenario. Usually
when a system is approaching towards the (AFM/FM) long range
ordering due to the development of internal field associated with
the magnetism the spectra broadens. Being a local probe NMR can
sense this effect well above the ordering.
Spin-lattice relaxation rate was measured by saturating the central line in the two field directions i.e. H and H by the standard saturation recovery method. The recovery curves could be fitted consistently with single component using the following equation down to 18 K,
| (1) |
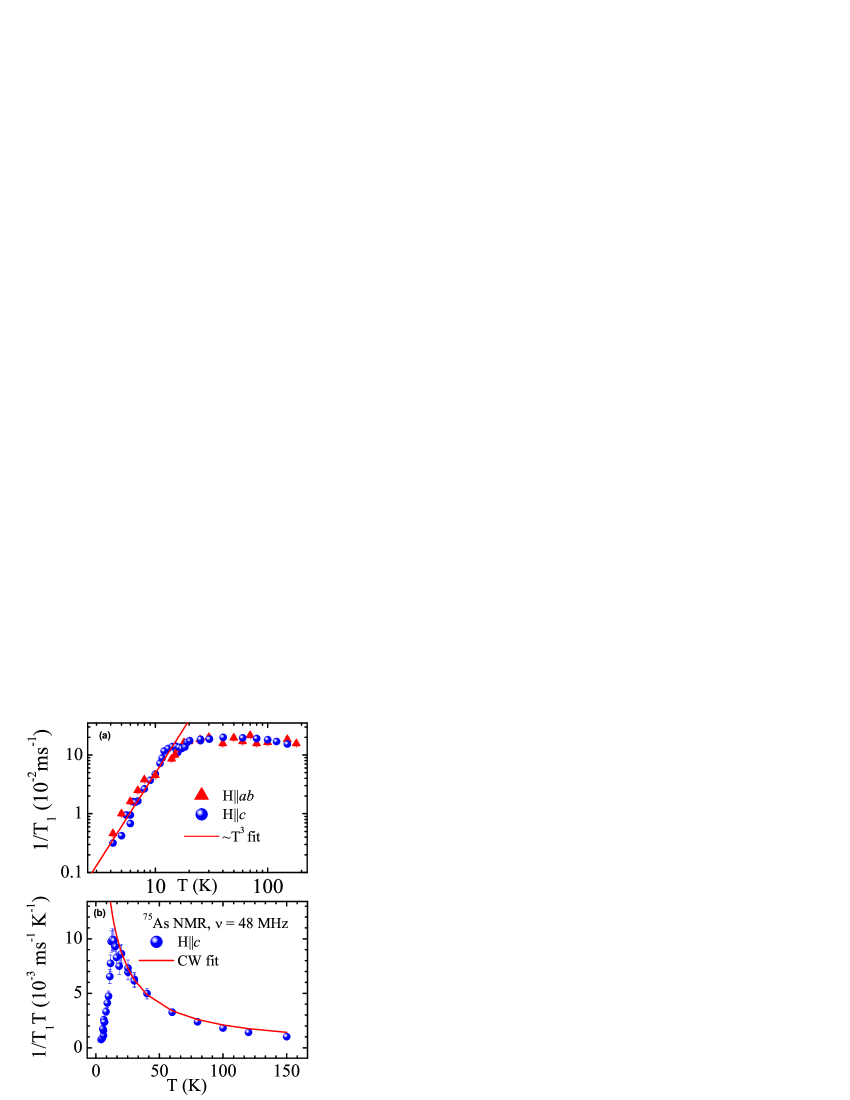
where is the nuclear magnetization at a time after the saturation pulse and is the equilibrium magnetization. For K, another short component is required to fit the recovery curves. As seen from Fig. 4, the extra peak close to the central line become more pronounce at low temperatures. Since was measured at the central line position, we possibly saturate a fraction of that extra peak which is having a short component. Another possibility could be the low temperature Eu2+ AFM ordering. The temperature dependence of is presented in Fig. 5 measured for and directions. For both the directions, the over all behaviour and magnitude of (T) almost remains same. This indicates there is no significant anisotropy in the spin dynamics. At high-s, is almost -independent. With decrease in (18 K), shows a gradual decrease without showing Hebel-Slichter coherence peak, benchmark for the -wave type superconductivity. Here it is important to mention that the absence of Hebel-Slichter peak could be because of the extended s-wave scenarios, to which s± state also belongs [31]. The change of slope in at K is likely due to the onset of superconductivity and is consistent with the data at H=7 T which exhibit a sharp drop nearly at the same temperature (see Fig. 1). In the superconductive regime ( 15 K), follows a behavior. This possibly is an indication of non -wave type superconductivity and/or line nodes in superconductivity gap.
The nuclear spin-lattice relaxation rate, , is related to the dynamic susceptibility per mole of electronic spins[32, 33] as
| (2) |
where the sum is over wave vectors within the first Brillouin zone, is the form factor of the hyperfine interactions as a function of in units of Oe/, and is the imaginary part of the dynamic susceptibility at the nuclear Larmor frequency in units of /Oe. The uniform static molar susceptibility corresponds to the real component with and . According to the mean-field theory, when the relaxation process is dominated by the two-dimensional(2D) and three dimensional(3D) AFM fluctuations, Eq. 2 reduces to (Curie-Weiss law) and , respectively.[32] In the Fig.5(b), we have plotted vs. . It increases with decrease in temperature down to 18 K following a Curie-Weiss (CW) law in the temperature range 18 K 150 K. The solid line shows the CW fit with parameters 0.22 (ms)-1, and Weiss temperature 5 K. We interpret this feature as arising from two dimensional AFM fluctuations.
The positive Weiss temperature indicates that SC is observed with the complete suppression of magnetic order. This scenario is similar to the case of LaFeAs(O1-xFx), F doped system where Nakai et. al. observed the positive Weiss temperature [34] and has been predicted that the SC emerges when a magnetic ordering is suppressed. This tendency is similar to that in of Cu in underdoped La2-xSrxCuO4, [35] where superconductivity also observed with a positive Weiss temperature.
4 Conclusions
The presented results point to a bulk SC with a transition at =20 K at zero field. With field the is shifted towards lower temperature. The field dependent study suggests the AFM ordering of Eu2+ moment at =2 K. This AFM ordering is shifted towards lower temperature from 19 K due to the Sr2+ substitution at the Eu2+ site in EuFe2As2.
In order to get a deeper microscopic insight we have performed 75As NMR investigations on single crystals of ESFCA in the external field and directions. 75As field sweep NMR spectra broadens with lowering the temperature and the obtained value of is somewhat higher than that has been obtained for SrFe2As2 single crystals. This line broadening phenomena is associated with the low temperature Eu2+ AFM ordering and could be too some extent due to the disorder. The spin-lattice relaxation rate results in the two crystallographic directions indicate the absence of substantial anisotropy in the spin dynamics. The temperature dependence of exhibits decrement below the SC transition following a behaviour without any Hebel-Slichter coherence peak. This feature indicate the non s wave type SC and possibly could be explained within the framework of s± model with impurity effect[36]. Moreover, the strong increase of following CW law arising from two dimensional AFM fluctuations.
NMR line broadening gives the supportive evidence of Eu2+ AFM ordering. On the other hand the drop of following a behaviour below 18 K is a signature of bulk SC. To illuminate this picture one could have possibly consider the coupling between the Eu2+ moment and the SC. Essentially Eu2+ moment polarizes the conduction electrons (CE), and they are coupled with the 75As nuclei via the Fermi contact interaction, as a result, the line broadening showed up in the 75As NMR spectra. On the other hand is the measure of low energy electronic spin fluctuations and in the SC arena this is modified by the electron pairing. Therefore there is a possibility of coupling between the SC and the Eu2+ magnetism. Furthermore it is important to mention that at 20 K nearly -independent behaviour of is observed in both directions. This constant value possibly indicates, is dominated by the relaxation process to the spin fluctuations of localized Eu2+ moments [37].
Acknowledgments
RN would like to acknowledge MPG and DST India for financial support through MPG-DST fellowship. Work at Göttingen University is supported by DFG-SPP 1458.
References
References
- [1] Kamihara Y, Watanabe T, Hirano M and Hosono H 2008 J. Am. Chem. Soc. 130, 3296
- [2] Chen X H, Wu T, Wu G, Liu R H, Chen H, Fang D F 2008 Nature 453, 1224
- [3] Ren Z A, Yang J, Lu W, Yi W, Che G C, Dong X L, Sun L L and Zhao Z X 2008 Mater. Res. Innovations 12,105
- [4] Chen G F, Li Z, Wu D, Li G, Hu W Z, Dong J, Zheng P, Luo J L and Wang N L 2008 Phys. Rev. Lett. 100, 247002
- [5] Yang J, Li Z C, Lu W, Yi W, Shen X L, Ren Z A, Che G C, Dong X L, Sun L L, Zhou F and Zhao Z X 2008 Supercond. Sci. Technol. 21, 082001
- [6] Bos J G, Penny G B S, Rodgers J A, Sokolov D A, Huxley A D and Attfield A P 2008 Chem. Commun. (Cambridge) 31, 3634
- [7] Rotter M, Tegel M and Johrendt D 2008 Phys. Rev. Lett. 101, 107006
- [8] Jeevan H S, Hossain Z, Kasinathan D, Rosner H, Geibel C and Gegenwart P 2008 Phys. Rev. B 78, 092406
- [9] Sefat A S, Jin R, McGuire M A, Sales B C, Singh D J and Mandrus D 2008 Phys. Rev. Lett. 101, 117004
- [10] Leithe-Jasper A, Schnelle W, Geibel C and Rosner H 2008 Phys. Rev. Lett. 101, 207004
- [11] Raffius H, Morsen M, Mosel B D, M ller-Warmuth W, Jeitschko W, Terb chte L and Vomhof T 1993 J. Phys. Chem. Solids 54, 135
- [12] Jeevan H S, Hossain Z, Kasinathan D, Rosner H, Geibel C and Gegenwart P 2008 Phys. Rev. B 78, 052502
- [13] Zaanen J 2009 Phys. Rev. B 80, 212502
- [14] Wu D, Barisic N, Drichko N, Kaiser S, Faridian A, Dressel M, Jiang S, Ren Z, Li L J, Cao G H, Xu Z A, Jeevan H S and Gegenwart P 2009 Phys. Rev. B 79, 155103
- [15] Ren Z, Tao Q, Jiang S, Feng C, Wang C, Dai J, Cao G and Xu Z 2009 Phys. Rev. Lett. 102, 137002
- [16] Jeevan H S, Kasinathan D, Rosner H and Gegenwart P 2011 Phys. Rev. B 83, 054511
- [17] Miclea C F, Nicklas M, Jeevan H S, Kasinathan D, Hossain Z, Rosner H, Gegenwart P, Geibel C and Steglich F 2009 Phys. Rev. B 79, 212509
- [18] Nicklas M, Kumar M, Lengyel E, Schnelle W and Leithe- Jasper A 2011 J. Phys.: Conf. Ser. 273, 012101
- [19] Zheng Q, He Y, Wu T, Wu G, Chen H, Ying J, Liu R, Wang X, Xie Y, Yan Y, Li Q and Chen X 2009 arXiv:0907.5547
- [20] Hu R, Bud ko S L, Straszheim W E and Canfield P C 2011 Phys. Rev. B 83, 094520
- [21] Ren Z, Lin X, Tao Q, Jiang S, Zhu Z, Wang C, Cao G and Xu Z 2009 Phys. Rev. B 79, 094426
- [22] Jiang S, Luo Y, Ren Z, Zhu Z, Wang C, Xu X, Tao Q, Cao G and Xu Z 2009 New Journal of Physics 11, 025007
- [23] Dengler E, Deisenhofer J, Krug von Nidda H A, Khim S, Kim J S, Kim K H, Casper F, Felser C and Loidl A 2010 Phys. Rev. B 81, 024406
- [24] Ning F L, Ahilan K, Imai T, Sefat A S, Jin R, McGuire M A, Sales B C and Mandrus D 2009 Phys. Rev. B 79, 140506(R)
- [25] Ning F L, Ahilan K, Imai T, Sefat A S, McGuire M A, and Sales B C, Mandrus D, Cheng P, Shen B and Wen H H 2010 Phys. Rev. Lett. 104, 037001
- [26] Laplace Y, Bobroff J, Rullier-Albenque F, Colson D and Forget A 2009 Phys. Rev. B 80, 140501
- [27] Baek S H, Lee H, Brown S E, Curro N J, Bauer E D, Ronning F, Park T and Thompson J D 2009 Phys. Rev. Lett. 102, 227601
- [28] Kitagawa K, Katayama N, Gotou H, Yagi T, Ohgushi K, Matsumoto T, Uwatoko Y and Takigawa M 2009 Phys. Rev. Lett. 103, 257002
- [29] Guguchia Z, Roos J, Shengelaya A, Katrych S, Bukowski Z, Weyeneth S, Mur anyi F, Strässle S, Maisuradze A, Karpinski J and Keller H 2011 Phys. Rev. B 83, 144516
- [30] Kitagawa K, Katayama N, Ohgushi K and Takigawa M 2009 J. Phys. Soc. Jpn. 78, 063706
- [31] Parker D, Dolgov O V, Korshunov M M, Golubov A A and Mazin I I 2008 Phys. Rev. B 78, 134524
- [32] Johnston D C 2010 Advances in Phys. 59, 803
- [33] Moriya T 1963 J. Phys. Soc. Jpn. 18, 516
- [34] Nakai Y, Ishida K, Kamihara Y, Hirano M, and Hosono H 2008 J. Phys. Soc. Jpn. 77, 073701
- [35] Ohsugi S, Kitaoka Y, Ishida K and Asayama K 1991 J. Phys. Soc. Jpn. 60, 2351
- [36] Ishida K, Nakai Y and Hosono H 2009 J. Phys. Soc. Jpn. 78, 062001
- [37] Yamamoto A, Iemura S, Wada S, Ishida K, Shirotani I and Sekine C 2008 J. Phys.: Condens. Matter 20, 195214