Detailed abundances for M giants in two inner bulge fields
from Infrared Spectroscopy111Data presented herein were obtained
at the W. M. Keck Observatory, which is operated as a scientific partnership
among the California Institute of Technology, the University of California, and
the National Aeronautics and Space Administration. The Observatory was made
possible by the generous financial support of the W. M. Keck Foundation.
Abstract
We report abundance analysis for 30 M giant stars in two inner Galactic bulge fields at and at , based on infrared spectroscopy using NIRSPEC at the Keck II telescope. We find iron abundances of dex with a dispersion of and dex, with a dispersion of for the and fields, respectively. In agreement with all prior studies, we find enhanced of +0.3 dex. We confirm the lack of any major vertical abundance or composition gradient in the innermost pc between Baade’s window and pc from the Galactic plane. We also confirm that the known enhancement of alpha elements observed between 500 and 1000 pc from the nucleus is also present over the volume of the inner bulge and may therefore be presumed to be a general characteristic of bulge/bar stars within 1 kpc of the Galactic Center.
1 Introduction
Even with recent observational successes, the timescales for formation and chemical enrichment of the Milky Way bulge remain a subject of debate at the several Gyr level. The global chemistry (see e.g. McWilliam & Rich, 1994; Fulbright et al., 2006; Gonzalez et al., 2011a; Johnson et al., 2011) and color-magnitude diagrams corrected for non-bulge contamination (Ortolani et al., 1995; Feltzing & Gilmore, 2000; Kuijken & Rich, 2002; Zoccali et al., 2003; Clarkson et al., 2008) are generally consistent with a globular cluster-aged bulge that formed early and rapidly (Ballero et al., 2007; Cescutti & Matteucci, 2011). That is, bulge giants are generally alpha enhanced, which is attributed to early enrichment from core collapse SNe (Wheeler, Sneden, & Truran, 1989; McWilliam, 1997). On the other hand, microlensing studies (Bensby et al., 2011) find of microlensed metal rich dwarfs are as much as 5 Gyr younger than the canonical globular cluster age. Using gravity and effective temperature measured from the spectra, the stars are placed on isochrones appropriate for the derived [Fe/H] and , assuming they are at the distance of the bulge; the dissonance between the CMD and spectroscopic studies remains unsettled.
In the inner bulge, the region from the Galactic Center, it is well established that there is a more continuous star formation history: there is a clearly detected red clump Gyr old, but also clusters as young as a few Myr and young, massive, stars in the central pc (Figer et al., 2004). However, within pc, the optical extinction increases to the point where high resolution optical spectroscopy is not currently feasible, hence the need to turn to infrared techniques if one seeks to constrain the history of chemical evolution in this region, using abundance analysis.
The last five years has seen a burgeoning number of optical and infrared spectroscopic studies at resolution 20,000, aimed at characterizing the chemical and kinematic properties of the bulge stellar populations. The largest recent surveys are based on high resolution optical spectroscopy of red clump stars, hence K giants (Fulbright et al., 2006; Zoccali et al., 2008; Johnson et al., 2011). According to these studies, there is general agreement on the bulge metallicity distribution spanning a fairly large range, dex, with a mean value that depends on the latitude of the observed field. In particular, Zoccali et al. (2008) found an iron abundance gradient of along the bulge minor axis when moving inwards from a region at b= to Baade’s window at b=. Johnson et al. (2011) added the abundance distribution at , confirming the overall trend. Over this entire volume, the alpha elements are observed to be enhanced relative to the thin disk. The optical spectra of K giants in all of the bulge fields observed so far (Fulbright et al., 2006; Lecureur et al., 2007; Melendez et al., 2008; Alves-Brito et al., 2010; Johnson et al., 2011; Gonzalez et al., 2011a) show an overall [/Fe] enhancement, of 0.2-0.4 dex, with a “knee” breaking toward Solar scaled alphas at [Fe/H]. The exact location of this break varies slightly among different studies, although overall, the general enhancement of alpha elements relative to the thin disk supports a rapid formation scenario.
Modeling of the bulge kinematics (Shen et al., 2010) as measured by the Bulge Radial Velocity Assay (BRAVA) (Rich et al., 2007; Howard et al., 2008) project determines that for , the velocity/dispersion field is fit by an N-body bar that evolved from the dynamical buckling of a disk. Bars formed by a purely dynamical process are not expected to exhibit an abundance gradient, because acceleration should be independent of metallicity. Babusiaux et al. (2010), Hill et al. (2011) and Gonzalez et al. (2011a) argue that the abundance gradient arises owing to a more metal rich population that predominates at low Galactic latitude with Gonzalez et al. (2011a) suggesting that it is due to a thin disk. However, on the kpc scales of the bulge/bar, there is no evidence for a dynamically hotter classical bulge or other complexity, such as a rapidly rotating (i.e. disklike) metal rich component (Howard et al., 2008, 2009; Kunder et al., 2011). Further, Babusiaux et al. (2010) and Gonzalez et al. (2011a) argue for a metal rich population with higher velocity dispersion having smaller vertical scale height-a result that would seemingly run counter to the expected behavior of a stellar distribution function. While one might wish to attribute the abundance gradient to the transition between the bar and a “classical” spheroid, the observed cylindrical rotation field characteristic of a bar (now also confirmed at b=; Kunder et al. (2011)) extends to 1 kpc=. One cannot attribute the peculiar hot metal rich stars at b= to the kinematic expression of the bar: the cylindrical rotation field (modeled as due to the bar) dominates the velocity field to b=. The BRAVA kinematic survey is not compatible with a low latitude metal rich disk or bar and a high latitude “classical” spheroid. Any theory for the gradient must reflect the reality of the observed global kinematics. A vertical abundance gradient might also have arisen owing to the most metal poor (possibly oldest) stars having more time to scatter off of the bar via resonant heating (see e.g. Pfenniger, D., & Norman, 1990). However, the uniformity of the trends throughout the bulge pose problems for this scenario, because the similar trends would appear to require a uniform enrichment history yet somehow leave an abundance gradient. The gradient might also have been in place early, following the formation of a massive proto-disk, with that abundance gradient relatively unmodified by the subsequent secular evolution that produced the bar.
We emphasize that the measurement of the vertical abundance gradient cited above are based on optical spectroscopy of K giants in 4 outer fields along the minor axis at b=-4∘, -6∘, -8∘, and -12∘, with the only exception being the results of Bensby et al. (2010, 2011) who observed microlensed dwarfs located at various galactic longitude and at latitudes between -2∘ and -4∘. One other study is based on medium resolution infrared spectroscopy, finding no gradient in fields from to (Ramirez et al., 2000a). The bulge inner region (b) is most seriously affected by extinction and crowding and has no prior high resolution spectroscopy except for the supergiants in the Galactic Center; it appeared to be logical to extend our investigation into this region.
To test whether the metallicity gradient found in the outer regions is also present in the innermost 300 pc, we have obtained IR spectra at R=25,000 for a sample of bulge M giants in different fields with galactic latitude b. In Rich & Origlia (2005) we have reported the first detailed IR abundances for our sample of M giants in Baade’s window.
Our infrared spectroscopy has been in essentially good agreement with the optical studies, and also with subsequent IR work (Ryde et al., 2009, 2010) in Baade’s window. We find roughly Solar mean abundance and enhanced -elements, consistent with a predominant chemical enrichment by type II SNe on a relatively short timescale.
Very similar results were obtained when the second sample of M giants located in the innermost field at latitude b=-1∘ was analyzed (Rich, Origlia & Valenti, 2007). We found no evidence of any major iron abundance or [/Fe] abundance ratio gradients between the field at b=-1∘ and the Baade’s window.
Here we present a detailed abundance analysis of an additional sample of 30 M giants observed in two additional inner bulge fields located at (l,b)=(0∘,-1.75∘) and (l,b)=(1.25∘,-2.65∘).
2 Observations and spectral analysis
A sample of M giants near the old red giant branch (RGB) tip (Frogel &Whitford, 1987) in two inner bulge fields located at (l, b)=(0∘, -1.75∘) and (l, b)=(1∘, -2.65∘) (hereafter F175 and F265, respectively) has been observed using the cross-dispersed echelle spectrograph NIRSPEC (McLean et al., 1998) at Keck II during two observing runs in May 2005 and May 2006. The targets have been selected by using two near-IR photometric catalogs obtained from a combination of 2MASS/WIRC222The two bulge fields have been observed with the IR camera WIRC at the Las Campanas Observatory through the Ks filter on August 2002. data for the J and Ks magnitudes, respectively. The derived color-magnitude diagrams have been corrected for reddening adopting E(B-V)=1.2 and 0.65 (for F175 and F265, respectively). These values have been derived by averaging the latest extinction estimates provided by the MACHO microlensing survey (Popowski, Cook & Becker, 2003), 2MASS data (Dutra et al., 2003), and the OGLE survey (Sumi, 2004). In each bulge field, we obtained spectra for 15 stars with bolometric magnitude M-3.0 and 0.91.4. Considering the excellent agreement with the bulge color-magnitude diagram and large velocity dispersion of the targets, we are confident that these are members of the old Gyr old bulge population.
Fig. 1 shows the 2MASS color-magnitude diagram of Baade’s window, dereddened according to the prescription of Gonzalez et al. (2011b) and superimposed, our 30 M giants in the F175 and F265 fields as well as the other 29 giants in both Baade’s window (Rich & Origlia, 2005) and the b=-1∘ (Rich, Origlia & Valenti, 2007) fields. The color range of our sample is great enough to span the full range seen the CMD; we believe that our sample is unbiased with respect to metallicity.
We employed a slit width of 0.43 giving an overall spectral resolution , and the standard NIRSPEC-5 setting, which covers most of the 1.5-1.8 m H-band. The raw stellar spectra have been reduced using the REDSPEC IDL-based package written at the UCLA IR Laboratory. Each order has been sky-subtracted by using nodding pairs and is flat-field-corrected. Wavelength calibration has been performed using arc lamps and a second-order polynomial solution, while telluric features have been removed by using an O star featureless spectrum. The typical signal-to-noise ratio of the final spectra is 30. Figure 2 shows two stars with =3200K and 3400K, and Solar metallicity.
The same spectral analysis employed for our Baade’s window and the (l, b)=(0∘, -1.0∘) fields (Rich & Origlia, 2005; Rich, Origlia & Valenti, 2007) has been performed here. A grid of suitable synthetic spectra of giant stars have been computed by varying the photospheric parameters and the element abundances, using the code and line lists described in Origlia et al. (2002). The code uses the LTE approximation and is based on the molecular blanketed model atmospheres of Johnson, Bernat & Krupp (1980) in the 3000-4000 K temperature range and the ATLAS9 models for temperatures above 4000 K. Very similar results have been obtained using the NextGen model atmospheres by Hauschildt et al. (1999) (see Origlia et al., 2002, for more details). This is not surprising, since in the near IR the major source of continuum opacity is H- with its minimum near 1.6 m, the dependence of the results on the choice of reasonable model atmospheres is not critical.
By combining full spectral synthesis analysis with equivalent width measurements of selected lines, we derived abundances for Fe, C, O and other -elements (Mg, Si, Ca, and Ti). Reference solar abundances are from Grevesse & Sauval (1998). The lines and analysis method have been subjected to rigorous tests in our previous studies of Galactic bulge field and cluster giants (see Origlia & Rich, 2004; Rich & Origlia, 2005; Rich, Origlia & Valenti, 2007; Valenti, Origlia & Rich, 2011, and references therein). We recall that the CO and especially OH bands are extremely sensitive to . The effective temperature determines the fraction of molecular versus atomic carbon and oxygen. At temperatures 4500 K molecules barely survive; most of the carbon and oxygen are in atomic form and the CO and OH spectral features become very weak. At temperatures 3500 K most of the carbon and oxygen are in molecular form, drastically reducing the dependence of the CO and OH band strengths and equivalent widths on the temperature itself (Origlia et al., 1997). At spectral resolution R25,000, models with 0.2 dex abundance or 200 K temperature variations give remarkably different molecular line profiles. A microturbulence variation of 0.5 km/s mainly affects OH lines, while gravity mainly affects CO lines.
In the first iteration, we estimate the stellar temperatures from the (J – K)0 colors (see Tables 1 and 2) and the color temperature transformation of Montegriffo et al. (1998) specifically calibrated on globular cluster giants. Gravity has been estimated from theoretical evolutionary tracks (0.5), according to the location of the stars on the RGB (see Origlia et al., 1997, and references therein for a more detailed discussion). An average value =2.0 kms-1 has been adopted for the microturbulence (see also Origlia et al., 1997). More stringent constraints on the stellar parameters are obtained by the simultaneous spectral fitting of the several CO and OH molecular bands, which are very sensitive to the temperature, gravity and microturbulence variations (see Figs. 6 and 7 of Origlia et al., 2002).
The final values of our best-fit [Fe/H], [Si/Fe], [Mg/Fe], [O/Fe], [Ti/Fe], [C/Fe] and 12C/13C abundances and abundance ratios together with their random observational errors (on average 0.1 dex) are listed in Tables 1 and 2, for the F175 and F265 fields, respectively. We also estimate a conservative 0.1 dex systematic error in the derived best-fit abundances, due to residual uncertainty in the adopted stellar parameters. However, it must be stressed that since the stellar features under consideration show a similar trend with variations in the stellar parameters, although with different sensitivities (Origlia et al., 2002), relative abundances are less dependent on the adopted stellar parameters (i.e. on the systematic errors) and their values are well constrained down to 0.1 dex (see also Tables 1 and 2). Tables 1 and 2 also list the derived radial velocities for the stars in our sample.
3 Results and Discussion
From the abundances and abundance ratios reported in Tables 1 and 2 one determines the following average values and 1 errors for the F175 field: , , , , , .
For the F265 field, we find: , , , , , .
Figure 3 shows the iron abundance distributions for the four observed fields and the global sample histogram superimposed, which gives and 1 dispersion of 0.110.01. We confirm the lack of substantial vertical iron abundance gradients from the center out to the Baade’s window found by Rich, Origlia & Valenti (2007). Our M giant [Fe/H] distributions peak at about the same metallicity as the [Fe/H] distributions of red clump stars published in the last few years and based on optical spectroscopic surveys of several tens to several hundred objects in Baade’s window and in other outer bulge fields. At variance with these distributions, we do not find both metal poor ([Fe/H]) and super-solar ([Fe/H]) M giants. The absence of metal poor stars is less of a concern, since we select cool red giants, and globular-cluster age stars with [Fe/H] do not become M giants (Mould & McElroy, 1978; Ferraro et al., 2000). However, the lack of significantly super-solar M giants is somewhat of a concern, although our finding is consistent with other small surveys of M giants and supergiants in the center of the Galaxy (Ramirez et al., 2000b; Cunha & Smith, 2006; Cunha et al., 2007), where no M stars with iron abundance of twice or three times solar have been measured. Further, we are consistent with an earlier medium resolution (R=4000) infrared study of M giants in the inner bulge, in field locations similar to ours (Ramirez et al., 2000a). Indeed, although super-solar stars represent only a fraction of the stellar population towards the bulge, they are definitely present in all of the optical studies based on red clump and K giants. We explored attempting to force a metal rich model (+0.3 dex) to fit the spectra; this failed at . We note that we have used this identical approach to measure more metal rich stars, reaching [Fe/H]=+0.4 in NGC 6791 and Terzan 5 (Origlia et al., 2006, 2011); the NGC 6791 result concurs with optical high resolution spectroscopy of its giants (gra06).
In principle, we cannot exclude completely the possibility of bias in our target selection. To reduce the risk of including nonmembers, field stars, and outliers, we only consider giants with (J-K)1.4, as we do not know the reddest color that may be reached by the bulge red giants. However, the color swath in Figure 1 is generous and if significant numbers of super-solar stars were present, we believe that they should have been in our sample, based on our color selection boundary.
Also, more generally, the intrinsic small number statistics due to the fast evolutionary rate towards the RGB tip, particularly at very high metallicity (as inferred form canonical evolutionary tracks by e.g. Pietrinferni et al., 2006), make the detection of super-solar M giants less probable. Finally, the possibly enhanced mass loss at super solar metallicities (see e.g. Castellani & Castellani, 1993) can also prevent the most metal rich stars from reaching the RGB tip.
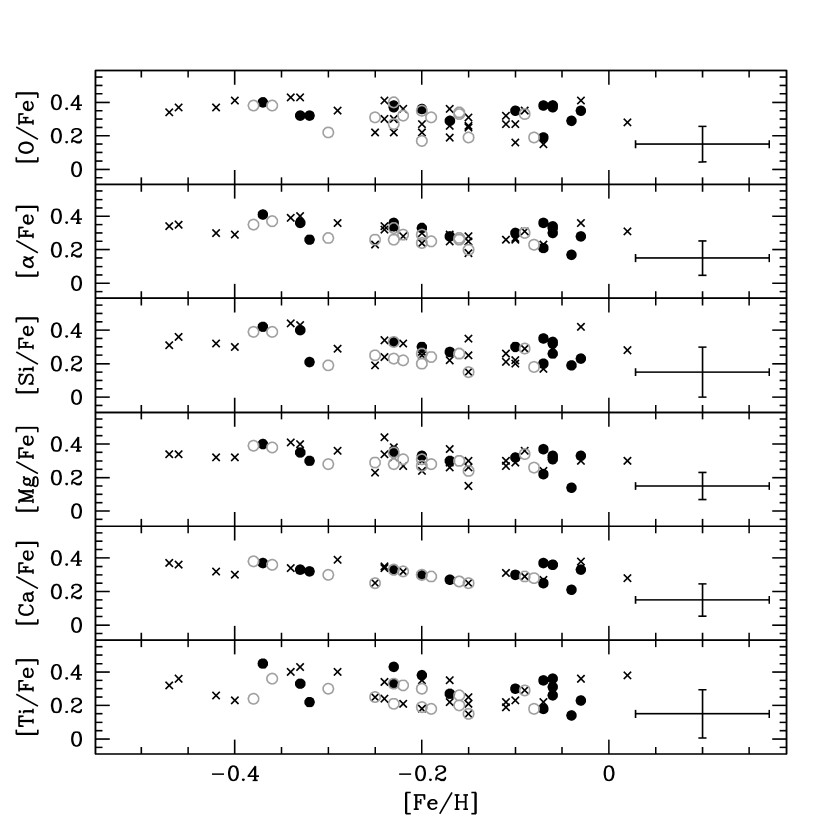
Figure 4 shows the various [/Fe] abundance ratios as a function of the iron abundance for the M giants in the two inner fields presented in this paper and in the two previously studied fields, for comparison, while Figure 5 shows the global sample histograms for the various [/H] abundances.
Figure 5 shows that M giants in all the four fields sampling the bulge stellar population in the innermost 600 pc exhibit very homogeneous abundance patterns and an overall constant [/Fe] enhancement at a level of +0.3 dex up to about solar metallicity. This suggests significant homogeneity to the enrichment process in the inner bulge. Johnson et al. (2011) and Hill et al. (2011) find a general pattern of alpha enhancement to nearly 1 kpc radius, but with a vertical gradient in [Fe/H]. Our study, which includes the sample of Rich, Origlia & Valenti (2007), and is consistent with Ramirez et al. (2000a), finds no gradient in [Fe/H] or within =550pc; this is in contrast with other spiral bulges that have strong vertical Mg and Fe gradients in integrated optical light (Proctor, Sansom, & Reid, 2000).
Taking into consideration our results and those of Johnson et al. (2011), Hill et al. (2011), and Gonzalez et al. (2011a), we conclude that alpha enhancement is now shown to be characteristic of stars over the entire inner kpc of the bulge. The apparent change in the [Fe/H] gradient from inner to outer bulge might on the surface appear to be consistent with the two-population picture of Soto et al. (2007) and Hill et al. (2011): a metal rich but uniform bar at low latitude, transitioning into a metal poor classical spheroid at . However, the lack of kinematic evidence for the metal poor slowly rotating component in the BRAVA survey conflicts with the claim for a significant contingent, based on the bimodal deconvolution of the bulge abundance distribution by Hill et al. (2011).
As in the previous studies of giant stars in the bulge field and globular clusters, we also find depleted [C/Fe] at the level of dex and low (5-10) 12C/13C, indicative of extra-mixing processes during the evolution along the RGB.
From the observed spectra we also measured radial velocities and velocity dispersion. Figure 6 shows the radial velocity distributions for the four observed fields and the global sample histogram superimposed. The overall velocity dispersion of the global sample of 59 M giants in the four fields is km/s, while the mean radial velocity is +1.317 km/s, fully consistent with bulge kinematics from the BRAVA survey (Rich et al., 2007; Howard et al., 2008; Kunder et al., 2011) and consistent with the predictions of the Shen et al. (2010) bar model. We conclude that our sample of M giants in the inner bulge is consistent with having kinematics expected for the 1 Gyr old bar/bulge population.
References
- Alves-Brito et al. (2010) Alves-Brito, A.; Melendez, J.; Asplund, M.; Ramirez, I.; Yong, D. 2010, A&A, 513,35
- Babusiaux et al. (2010) Babusiaux, C.; G mez, A.; Hill, V.; Royer, F.; Zoccali, M.; Arenou, F.; Fux, R.; Lecureur, A.; Schultheis, M.; Barbuy, B.; Minniti, D.; Ortolani, S. 2010,A&A, 519, 77
- Ballero et al. (2007) Ballero, S. K.; Matteucci, F.; Origlia, L.; Rich, R. M. 2007, A&A, 467, 123
- Bensby et al. (2010) Bensby, T., et al. 2010, A&A, 512, A41
- Bensby et al. (2011) Bensby, T., et al. 2011, arXiv1107.5606
- Castellani & Castellani (1993) Castellani, M., & Castellani, V. 1993, ApJ, 407, 649
- Cescutti & Matteucci (2011) Cescutti, G., & Matteucci, F. 2011, A&A, 525, 126
- Clarkson et al. (2008) Clarkson, W. et al. 2008, ApJ, 684,1110
- Cunha & Smith (2006) Cunha, K., & Smith, V. V. 2006, ApJ, 651, 491
- Cunha et al. (2007) Cunha, K., Sellgren, K., Smith, V. V., Ramirez, S. V., Blum, R. D., Terndrup, D. M. 2007, ApJ, 669, 1011
- Dutra et al. (2003) Dutra, C. M., Santiago, B. X., Bica, E. L. D, Barbuy, B. 2003, MNRAS, 338, 253
- Feltzing & Gilmore (2000) Feltzing, S., & Gilmore, G. 2000, A&A, 355, 949
- Ferraro et al. (2000) Ferraro, F.R.; Montegriffo, P.; Origlia, L.& Fusi Pecci, F. 2000, AJ, 119, 1282
- Figer et al. (2004) Figer, D. F., Rich, R. M., Kim, S. S., Morris, M., & Serabyn, E. 2004, ApJ, 601, 319
- Frogel &Whitford (1987) Frogel, J.A., & Whitford, A.E. 1987, ApJ, 320, 199
- Fulbright et al. (2006) Fulbright, J. P., McWilliam, A. & Rich, R. M. 2006, ApJ,636,821
- Fulbright et al. (2006) Fulbright, J. P., McWilliam, A. & Rich, R. M. 2007, ApJ,661,1152
- Gonzalez et al. (2011a) Gonzalez, O.A; Rejkuba, M; Zoccali, M.; Hill, V.; Battaglia, G.; Babusiaux, C. et al. 2011a, A&A, 530, 54
- Gonzalez et al. (2011b) Gonzalez, O. A., Rejkuba, M., Zoccali, M., Valenti E., & Minniti, D., 2011b, arXiv:1107.5496
- Grevesse & Sauval (1998) Grevesse, N. & Sauval, A. J. 1998, Space Sci. Rev., 85, 161
- Hauschildt et al. (1999) Hauschildt, P. H., Allard, F., Ferguson, J., Baron, E., & Alexander, D. R. 1999, ApJ, 525, 871
- Hill et al. (2011) Hill, V.; Lecureur, A.; G mez, A.; Zoccali, M.; Schultheis, M.; Babusiaux, C.; Royer, F.; Barbuy, B.; Arenou, F.; Minniti, D.; Ortolani, S. 2011, A&A,534,80
- Howard et al. (2008) Howard, C.D., Rich, R.M., Reitzel, D.B., Koch, A., de Propris, R., & Zhao, H. 2008, ApJ, 688, 1060
- Howard et al. (2009) Howard, C.D., Rich, R.M., Clarkson, W.I. et al. 2009, ApJ, 702, 153
- Johnson, Bernat & Krupp (1980) Johnson, H. R., Bernat, A. P., & Krupp, B. M. 1980, ApJS, 42, 501
- Johnson et al. (2011) Johnson, C. I.; Rich, R. M.; Fulbright, J. P.; Valenti, E.; McWilliam, A. 2011, ApJ, 732,108
- Kuijken & Rich (2002) Kuijken, K. & Rich, R.M. 2002, AJ, 124,2054
- Kunder et al. (2011) Kunder, A., Koch, A., Rich, R.M., de Propris, R. et al. (2011) AJ, submitted.
- Lecureur et al. (2007) Lecureur, A.; Hill, V.; Zoccali, M.; Barbuy, B.; Gomez, A.; Minniti, D.; Ortolani, S.; Renzini, A. 2007, A&A, 465,799
- McLean et al. (1998) McLean, I. et al. 1998, Proc. SPIE, 3354, 5667
- McWilliam (1997) McWilliam, A. 1997 Annu. Rev. Astron. Astrophys. 35, 503.
- McWilliam & Rich (1994) McWilliam, A., & Rich, R.M. 1994, ApJS, 91, 749
- McWilliam & Zoccali (2010) McWilliam, A. & Zoccali, M. 2010, ApJ, 724, 1491
- Melendez et al. (2008) Melendez, J., Asplund, M., Alves-Brito, A., Cunha, K., Barbuy, B., Bessell, M. S.; Chiappini, C., Freeman, K. C.; Ramirez, I., Smith, V. V.; Yong, D. 2008, A&A, 484,21
- Montegriffo et al. (1998) Montegriffo, P., Ferraro, F. R., Fusi Pecci, F., Origlia, L. 1998, MNRAS, 297, 872
- Mould & McElroy (1978) Mould, J.R., & McElroy, D.B. 1978, ApJ, 221, 580
- Origlia et al. (1997) Origlia, L., Ferraro, F. R., Fusi Pecci, F., Oliva, E. 1997, A&A, 321, 859
- Origlia et al. (2002) Origlia, L., Rich, R. M. & Castro, S. 2002, AJ, 123, 1559
- Origlia & Rich (2004) Origlia, L. & Rich, R. M. 2004, AJ, 127, 3422
- Ortolani et al. (1995) Ortolani, S.,Renzini, A., Gilmozzi, R., Marconi, G., Barbuy, B., Bica, E., & Rich, R.M. 1995, Nature, 377, 701
- Origlia et al. (2006) Origlia, L., Valenti, E., Rich, R.M., & Ferraro, F.R. 2006, ApJ, 646, 499
- Origlia et al. (2011) Origlia, L. et al. 2011, ApJ, 726, L20 Ortolani, .; Renzini, A.; Gilmozzi, R.; Marconi, G.; Barbuy, B.; Bica, E.; Rich, R.M. 1995, Nature, 377,701
- Pfenniger, D., & Norman (1990) Pfenniger,D., & Norman, C. Ap.J. 363, 391
- Pietrinferni et al. (2006) Pietrinferni, A. Cassisi, S., Salaris, M., Castelli, F. 2006, ApJ, 642, 797
- Popowski, Cook & Becker (2003) Popowski, P., Cook, K. M. & Becker, A. C. 2003, AJ, 126, 2910
- Proctor, Sansom, & Reid (2000) Proctor, R.N., Sansom,A.E., & Reid, I.N. 2000, MNRAS, 311, 37
- Rich & Origlia (2005) Rich, R. M. & Origlia, L. 2005, ApJ, 634, 1293
- Ramirez et al. (2000a) Ram rez, S. V.; Stephens, A. W.; Frogel, J. A. & DePoy, D. L. 2000, AJ, 120, 833
- Ramirez et al. (2000b) Ram rez, S. V.; Sellgren, K.; Carr, J. S.; Balachandran, S. C.; Blum, Robert; Terndrup, D. M.; Steed, A. 2000, ApJ, 537, 205
- Rich, Origlia & Valenti (2007) Rich, R. M., Origlia, L., & Valenti, E. 2007, ApJ, 665, 119
- Rich et al. (2007) Rich, R. M., Reitzel, D. B., Howard, C. D., & Zhao, H. 2007a, ApJ, 658, L29
- Ryde et al. (2009) Ryde, N.; Edvardsson, B.; Gustafsson, B.; Eriksson, K. et al. 2009, A&A, 496,701
- Ryde et al. (2010) Ryde, N. et al. 2010, A&A, 509,20
- Shen et al. (2010) Shen, J. Rich, R.M., Kormendy, J., Howard, C.D., de Propris, R., & Kunder, A. 2010, ApJ, 720, L72
- Soto et al. (2007) Soto, M., Rich, R. M., & Kuijken, K. 2007, ApJ, 665, L31
- Sumi (2004) Sumi, T. 2004, MNRAS, 349, 193
- Valenti, Origlia & Rich (2011) Valenti, E., Origlia, L., & Rich, R. M. 2011, MNRAS, 414, 2690
- Wheeler, Sneden, & Truran (1989) Wheeler, J., Sneden, C., & Truran, J.W. 1989 Annu. Rev. Astron. Astrophys. 27, 279.
- Zoccali et al. (2003) Zoccali et al.2003, A&A, 399,931 Zoccali, M.; Lecureur, A.; Barbuy, B.; Hill, V.; Renzini, A.; Minniti, D.; Momany, Y.; Gomez, A.; Ortolani, S. 2006, A&A, 457,1
- Zoccali et al. (2008) Zoccali, M.; Hill, V.; Lecureur, A.; Barbuy, B.; Renzini, A.; Minniti, D.; Gomez, A.; Ortolani, S. 2008, A&A, 486,177
| Star | R.A. | Decl | (J-K) | Teff | v | [Fe/H] | [Ca/Fe] | [Si/Fe] | [Mg/Fe] | [O/Fe] | [Ti/Fe] | [C/Fe] | 12C/13C |
|---|---|---|---|---|---|---|---|---|---|---|---|---|---|
| (J2000.0) | (J2000.0) | (Km/s) | |||||||||||
| 1-175 | 17:52:20.68 | -29:45:17.75 | 1.255 | 3400 | 29 | -0.03 | 0.33 | 0.23 | 0.33 | 0.35 | 0.23 | -0.27 | 7.9 |
| 0.04 | 0.06 | 0.19 | 0.06 | 0.10 | 0.13 | 0.08 | 2.1 | ||||||
| 2-175 | 17:52:15.52 | -29:44:26.23 | 1.254 | 3400 | -111 | -0.06 | 0.36 | 0.32 | 0.33 | 0.37 | 0.31 | -0.24 | 6.3 |
| 0.06 | 0.08 | 0.19 | 0.07 | 0.11 | 0.14 | 0.10 | 1.6 | ||||||
| 3-175 | 17:52:15.07 | -29:44:31.42 | 1.066 | 3600 | 8 | -0.07 | 0.37 | 0.35 | 0.37 | 0.38 | 0.35 | -0.23 | 7.1 |
| 0.08 | 0.09 | 0.19 | 0.09 | 0.11 | 0.17 | 0.11 | 1.8 | ||||||
| 4-175 | 17:52:21.15 | -29:45:59.01 | 1.183 | 3400 | -93 | -0.06 | 0.36 | 0.26 | 0.31 | 0.38 | 0.26 | -0.24 | 8.9 |
| 0.07 | 0.08 | 0.19 | 0.08 | 0.11 | 0.14 | 0.10 | 2.3 | ||||||
| 5-175 | 17:52:20.45 | -29:46:14.83 | 1.155 | 3600 | 274 | -0.06 | 0.36 | 0.33 | 0.32 | 0.38 | 0.36 | -0.26 | 6.3 |
| 0.08 | 0.09 | 0.29 | 0.09 | 0.11 | 0.17 | 0.11 | 1.6 | ||||||
| 6-175 | 17:52:06.70 | -29:58:41.79 | 1.169 | 3400 | 166 | -0.04 | 0.21 | 0.19 | 0.14 | 0.29 | 0.14 | -0.36 | 10.0 |
| 0.05 | 0.07 | 0.18 | 0.06 | 0.10 | 0.14 | 0.08 | 2.6 | ||||||
| 7-175 | 17:52:13.16 | -29:58:15.85 | 1.239 | 3400 | -9 | -0.07 | 0.25 | 0.20 | 0.22 | 0.19 | 0.18 | -0.33 | 7.1 |
| 0.05 | 0.07 | 0.18 | 0.06 | 0.09 | 0.14 | 0.08 | 1.8 | ||||||
| 8-175 | 17:52:44.758 | -29:50:30.93 | 1.158 | 3400 | 119 | -0.17 | 0.27 | 0.27 | 0.30 | 0.29 | 0.27 | -0.28 | 6.3 |
| 0.08 | 0.12 | 0.27 | 0.09 | 0.11 | 0.15 | 0.11 | 1.6 | ||||||
| 9-175 | 17:52:18.860 | -29:43:38.98 | 1.136 | 3600 | 169 | -0.10 | 0.30 | 0.30 | 0.32 | 0.35 | 0.30 | -0.30 | 7.9 |
| 0.08 | 0.09 | 0.28 | 0.09 | 0.11 | 0.14 | 0.11 | 2.1 | ||||||
| 10-175 | 17:52:39.456 | -29:50:39.96 | 1.131 | 3600 | -111 | -0.20 | 0.30 | 0.30 | 0.33 | 0.36 | 0.38 | -0.25 | 4.5 |
| 0.08 | 0.12 | 0.27 | 0.08 | 0.10 | 0.14 | 0.10 | 1.2 | ||||||
| 11-175 | 17:52:43.323 | -29:59:43.95 | 1.125 | 3600 | 73 | -0.33 | 0.33 | 0.40 | 0.35 | 0.32 | 0.33 | -0.47 | 7.9 |
| 0.08 | 0.11 | 0.21 | 0.09 | 0.11 | 0.14 | 0.11 | 2.1 | ||||||
| 12-175 | 17:52:40.730 | -29:59:42.63 | 1.092 | 3600 | -87 | -0.23 | 0.33 | 0.33 | 0.36 | 0.38 | 0.33 | -0.27 | 6.3 |
| 0.08 | 0.12 | 0.27 | 0.08 | 0.11 | 0.14 | 0.10 | 1.6 | ||||||
| 13-175 | 17:52:58.997 | -29:38:50.00 | 1.087 | 3600 | 284 | -0.23 | 0.33 | 0.33 | 0.36 | 0.37 | 0.43 | -0.22 | 6.3 |
| 0.07 | 0.12 | 0.27 | 0.08 | 0.11 | 0.14 | 0.10 | 1.6 | ||||||
| 14-175 | 17:52:42.627 | -29:54:11.25 | 1.083 | 3600 | -242 | -0.32 | 0.32 | 0.21 | 0.30 | 0.32 | 0.22 | -0.38 | 5.0 |
| 0.07 | 0.10 | 0.23 | 0.07 | 0.10 | 0.13 | 0.10 | 1.3 | ||||||
| 15-175 | 17:52:53.328 | -29:58:49.84 | 0.965 | 3800 | 220 | -0.37 | 0.37 | 0.42 | 0.40 | 0.40 | 0.45 | -0.23 | 6.3 |
| 0.10 | 0.13 | 0.23 | 0.11 | 0.11 | 0.15 | 0.12 | 1.6 |
| Star | R.A. | Decl | (J-K) | Teff | v | [Fe/H] | [Ca/Fe] | [Si/Fe] | [Mg/Fe] | [O/Fe] | [Ti/Fe] | [C/Fe] | 12C/13C |
|---|---|---|---|---|---|---|---|---|---|---|---|---|---|
| (J2000.0) | (J2000.0) | (Km/s) | |||||||||||
| 1-265 | 17:58:37.119 | -29:03:48.39 | 1.346 | 3200 | -96 | -0.08 | 0.28 | 0.18 | 0.26 | 0.19 | 0.18 | -0.32 | 7.9 |
| 0.07 | 0.08 | 0.17 | 0.08 | 0.12 | 0.13 | 0.10 | 2.1 | ||||||
| 2-265 | 17:58:49.636 | -29:23:32.65 | 1.324 | 3200 | -12 | -0.15 | 0.25 | 0.15 | 0.24 | 0.19 | 0.15 | -0.38 | 10.0 |
| 0.06 | 0.11 | 0.16 | 0.07 | 0.10 | 0.14 | 0.09 | 2.6 | ||||||
| 3-265 | 17:58:43.132 | -29:18:35.92 | 1.296 | 3200 | 238 | -0.20 | 0.30 | 0.20 | 0.27 | 0.17 | 0.19 | -0.30 | 8.9 |
| 0.10 | 0.13 | 0.17 | 0.10 | 0.14 | 0.16 | 0.12 | 2.3 | ||||||
| 4-265 | 17:58:31.816 | -29:19:24.17 | 1.238 | 3400 | -112 | -0.22 | 0.32 | 0.22 | 0.31 | 0.32 | 0.32 | -0.26 | 10.0 |
| 0.06 | 0.11 | 0.17 | 0.07 | 0.10 | 0.15 | 0.09 | 2.6 | ||||||
| 5-265 | 17:58:35.654 | -29:04:52.58 | 1.238 | 3400 | 147 | -0.09 | 0.29 | 0.29 | 0.34 | 0.33 | 0.29 | -0.31 | 7.9 |
| 0.05 | 0.07 | 0.18 | 0.06 | 0.10 | 0.14 | 0.08 | 2.1 | ||||||
| 6-265 | 17:58:51.445 | -29:18:08.60 | 1.236 | 3400 | 136 | -0.30 | 0.30 | 0.19 | 0.28 | 0.22 | 0.30 | -0.25 | 10.0 |
| 0.08 | 0.12 | 0.17 | 0.08 | 0.11 | 0.14 | 0.10 | 2.6 | ||||||
| 7-265 | 17:58:35.039 | -29:02:05.51 | 1.215 | 3400 | -81 | -0.23 | 0.33 | 0.23 | 0.28 | 0.27 | 0.21 | -0.27 | 8.9 |
| 0.08 | 0.12 | 0.18 | 0.09 | 0.11 | 0.15 | 0.11 | 2.3 | ||||||
| 8-265 | 17:58:43.835 | -29:07:42.54 | 1.190 | 3400 | -97 | -0.19 | 0.29 | 0.24 | 0.28 | 0.31 | 0.18 | -0.28 | 8.9 |
| 0.06 | 0.11 | 0.17 | 0.07 | 0.10 | 0.15 | 0.10 | 2.3 | ||||||
| 9-265 | 17:58:55.474 | -29:22:12.42 | 1.182 | 3400 | -151 | -0.25 | 0.25 | 0.25 | 0.29 | 0.31 | 0.25 | -0.37 | 10.0 |
| 0.08 | 0.12 | 0.17 | 0.08 | 0.11 | 0.14 | 0.10 | 2.6 | ||||||
| 10-265 | 17:58:36.306 | -29:10:38.64 | 1.155 | 3600 | 6 | -0.16 | 0.26 | 0.26 | 0.30 | 0.34 | 0.26 | -0.34 | 6.3 |
| 0.07 | 0.11 | 0.17 | 0.08 | 0.10 | 0.13 | 0.10 | 1.6 | ||||||
| 11-265 | 17:58:33.611 | -29:02:22.20 | 1.135 | 3600 | 7 | -0.23 | 0.33 | 0.33 | 0.35 | 0.40 | 0.33 | -0.24 | 7.9 |
| 0.06 | 0.11 | 0.17 | 0.07 | 0.1 | 0 0.13 | 0.09 | 2.1 | ||||||
| 12-265 | 17:58:49.028 | -29:11:22.60 | 1.133 | 3600 | 121 | -0.16 | 0.26 | 0.26 | 0.30 | 0.33 | 0.20 | -0.44 | 8.9 |
| 0.07 | 0.11 | 0.17 | 0.08 | 0.09 | 0.13 | 0.10 | 2.3 | ||||||
| 13-265 | 17:58:37.405 | -28:59:33.23 | 1.100 | 3600 | -65 | -0.36 | 0.36 | 0.39 | 0.38 | 0.38 | 0.36 | -0.29 | 10.0 |
| 0.07 | 0.10 | 0.18 | 0.07 | 0.10 | 0.13 | 0.10 | 2.6 | ||||||
| 14-265 | 17:58:55.408 | -29:07:07.30 | 1.094 | 3600 | 250 | -0.20 | 0.30 | 0.26 | 0.31 | 0.35 | 0.30 | -0.30 | 7.1 |
| 0.08 | 0.12 | 0.17 | 0.08 | 0.11 | 0.14 | 0.10 | 1.8 | ||||||
| 15-265 | 17:58:43.660 | -29:03:25.69 | 1.073 | 3600 | -156 | -0.38 | 0.38 | 0.39 | 0.39 | 0.38 | 0.24 | -0.42 | 8.9 |
| 0.07 | 0.10 | 0.19 | 0.07 | 0.10 | 0.13 | 0.10 | 2.3 |