Characterization of a tagged -ray beam line at the DANE Beam Test Facility
Abstract
At the core of the AGILE scientific instrument, designed to operate on a satellite, there is the Gamma Ray Imaging Detector (GRID) consisting of a Silicon Tracker (ST), a Cesium Iodide Mini-Calorimeter and an Anti-Coincidence system of plastic scintillator bars. The ST needs an on-ground calibration with a -ray beam to validate the simulation used to calculate the energy response function and the effective area versus the energy and the direction of the rays. A tagged -ray beam line was designed at the Beam Test Facility (BTF) of the INFN Laboratori Nazionali of Frascati (LNF), based on an electron beam generating rays through bremsstrahlung in a position-sensitive target. The -ray energy is deduced by difference with the post-bremsstrahlung electron energy [1]-[2]. The electron energy is measured by a spectrometer consisting of a dipole magnet and an array of position sensitive silicon strip detectors, the Photon Tagging System (PTS). The use of the combined BTF-PTS system as tagged photon beam requires understanding the efficiency of -ray tagging, the probability of fake tagging, the energy resolution and the relation of the PTS hit position versus the -ray energy. This paper describes this study comparing data taken during the AGILE calibration occurred in 2005 with simulation.
keywords:
Electron and positron beam; Photon beam; Position-sensitive detectors; bremsstrahlungPACS:
41.75.Fr , 41.85.p , 29.40.Gx , 41.60.-m1 Introduction
AGILE (Astro-rivelatore Gamma a Immagini LEggero) is a Small Scientific
Mission of the Italian Space Agency (ASI), dedicated to high-energy astrophysics.
It combines two co-aligned imaging detectors operating respectively in the X and
-ray bands with large Field of Views (FoV).
The Silicon Tracker (ST), at the core of the AGILE satellite, is designed to
detect and image rays in the
30 MeV - 50 GeV energy range [3]-[4]-[5]-[6].
The on-ground calibration of an astronomical instrument is important for
the interpretation of its results.
The goal is to reproduce in laboratory, under controlled condition,
the response of the instrument in flight.
This task requires a tagged photon beam with position, direction and energy of
each photon known with a precision better than the instrument resolution.
The realization of such a beam turns out to be a challenging endeavour.
The Beam Test Facility (BTF) in the DANE collider
complex at the INFN Laboratori Nazionali of Frascati (LNF) [7],
was the elected site for realizing the tagged photon beam exploiting
bremsstrahlung in a thin target and performing the calibration.
Preliminary results on the calibration of the AGILE ST has been
presented in [8] and will be subject of a future paper.
This paper presents the experimental setup, a detailed Monte Carlo study of the
system and the comparison with the experimental results collected during the calibration.
2 The experimental setup
The experimental setup is a complex system consisting of the BTF e- beam, the target to generate bremsstrahlung photons, the spectrometer magnet and the detector to measure the energy of post-bremsstrahlung electrons. The various subsystems are described in the following with the convention that is the coordinate perpendicular to the BTF line plane, the one transverse to the beam at the target in the BTF line plane and is the one along the beam at the target, that is the direction of the bremsstrahlung photons.
2.1 The electron beam
The e-s used for generating the photon beam are delivered by the BTF. The BTF is fed by the DANE complex that provides e± under carefully controlled condition with predefined multiplicity.
2.1.1 The Beam Test Facility (BTF)
For the ST calibration we used the BTF in the DANE
collider complex at LNF, which includes a LINAC at high e+/e- currents, an accumulator
of e+/e- and two storage rings at 510 MeV.
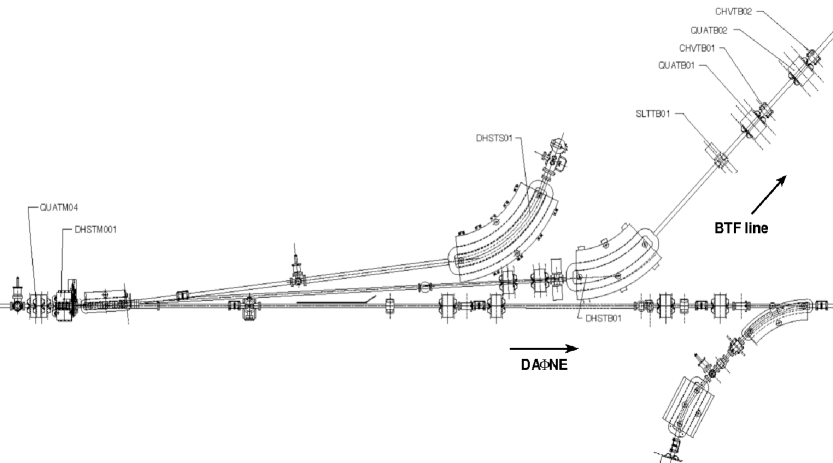
The e+/e- beam from the LINAC is directed into the accumulation ring to be subsequently
extracted and injected in the Main Ring. When the system injector does not transfer the
beams to the accumulator, the beam from LINAC can be extracted and transported in the test beam area
through a dedicated transfer line: the BTF line (Fig. 1).
The BTF can provide a collimated beam of e+/e- in the energy range
20-750 MeV with a pulse rate of 50 Hz. The pulse duration can vary from 1 to
10 ns and the average number of e- per bunch ranges from
to [7]-[9]-[10].
The BTF can be operated in two ways:
-
1.
LINAC mode: operating when DANE is off, with a tunable energy between 50 MeV and 750 MeV and an efficiency around 0.9
-
2.
DANE mode: operating when DANE is on, with a fixed energy at 510 MeV and an efficiency around 0.6
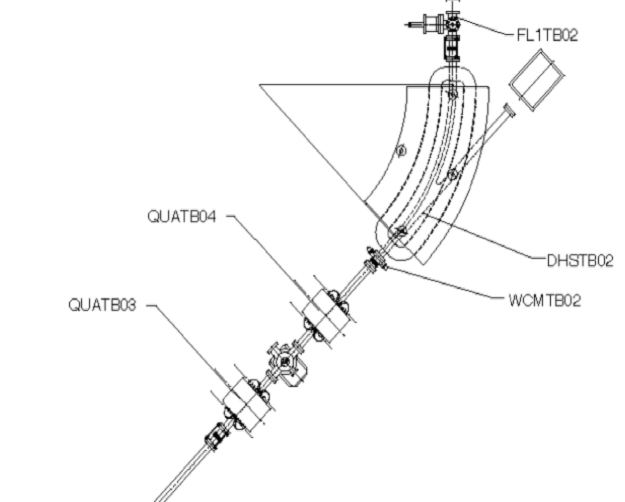
The extracted electrons are transported to the BTF hall, where the final section is located (Fig. 2);
the experimental equipment under test is positioned at the exit of the spectrometer magnet DHSTB02.
All or part of the equipment can be mounted under vacuum continuing the beam line or,
alternatively, the beam line can be terminated with a thin window and the equipment mounted in air.
In spite of some disadvantage from the point of view of background, this last option was adopted
with a Be window because of the difficulties in implementing an extended vacuum
line incorporating all the required equipment.
2.1.2 e- multiplicity per bunch
The calibration of the ST should be ideally performed in a single-photon
regime, avoiding simultaneous multi-photon production to reproduce the
astrophysical conditions.
Multi-photon events should ideally identified and rejected otherwise they
will bias the counting statistics.
On the other hand, bremsstrahlung is a continuous process and multi-photon
generation (with photon energy above a given threshold) is possible also when a
single e- crosses the target.
The fraction of multi-photon events is approximately proportional to the single-photon
emission probability. That implies the need of a compromise between the photon beam
intensity and the single-photon beam purity.
Considering that the target thickness was constrained by the availability
of the hardware, by the need to guarantee full detection efficiency of the beam
electrons and by the need to measure electrons twice both in the and directions
for studying the beam size and divergence, the only free parameter is the
e- multiplicity per bunch.
Another constraint is the limited time available for the calibration campaign
and the request of calibrating many different ST geometrical configurations.
That puts a lower limit to the required photon flux and therefore on the e-
multiplicity per bunch.
In DANE mode with 5 e-/bunch the fraction
of multi-photon events having can be
estimated to be by the formulae in the Appendix.
This uncertainty is greater than the accuracy requirement on the
effective area measurements. On the other hands, the DANE mode with 1
e-/bunch is consistent with the accuracy requirements but the time necessary
to collect enough statistics is incompatible with
the time available for the calibration.
The ST cross-section for photons with is
not negligible and thus the fraction of interacting secondary photons will be
larger than the numbers calculated in the Appendix.
Taking into account the above considerations, the best configuration for
ST performance and calibration would be with 1 e-/bunch, but the flux
requirement forced to select the configuration with e-/bunch.
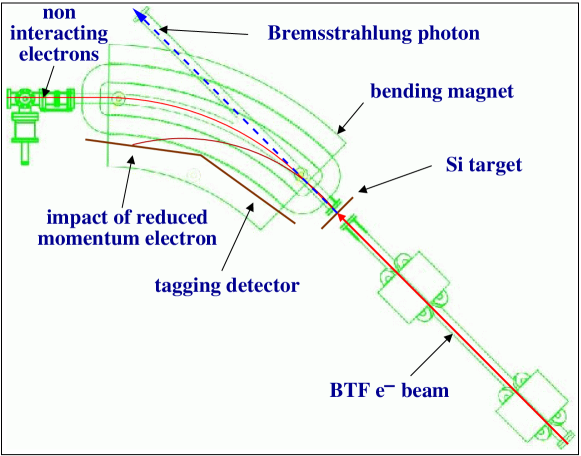
2.2 The bremsstrahlung target
Photons in the energy range relevant for the ST are produced by
bremsstrahlung of electrons in a target;
subsequently a magnet bends away the electrons while the rays can
travel towards the AGILE instrument (see Fig.3).
The bremsstrahlung target consists of two pairs of silicon single sided micro-strip
detectors of area and thick,
each including 768 strips with pitch. Only every other strip is read,
so that each target detector has 384 readout channels with readout pitch.
Each pair measures separately the and coordinates transverse to the beam.
A spatial resolution is expected; the cluster size is often limited
to one strip and therefore the resolution is limited by the strip pitch.
The target has two roles: to measure the coordinate and the direction
of the electrons and to cause the emission of bremsstrahlung photons.
The target detectors are positioned along the beam direction between the last
focusing magnet (QATB04 in Fig.2) and the spectrometer magnet
(DHSTB02 in Fig.2). The measuring ones
are the first and the third, positioned respectively at and
downstream the Be window, while the measuring ones
are the second and the fourth, positioned respectively and
downstream the Be window.
At the electron energy most used during calibration, , the
contribution to beam divergence due to Coulomb Multiple Scattering in each target
detector is evaluated under the Gaussian approximation from [11] as
.
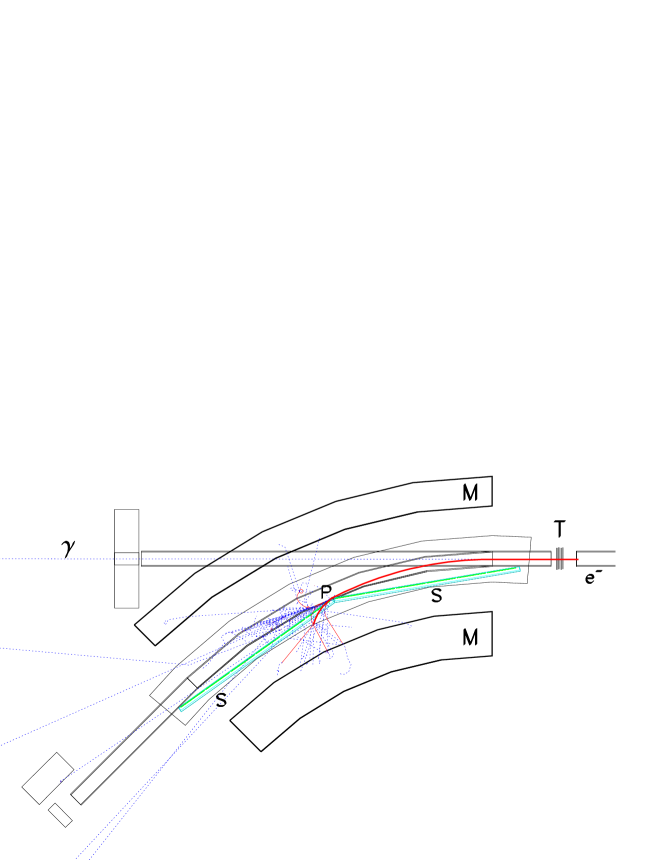
2.3 The Photon Tagging System (PTS)
The spectrometer magnet, visible in Fig.2-Fig.3-Fig.4,
generates a dipolar field along the direction
over an angular range of 45∘. In between the two magnet poles, there
is a pipe made of stainless steel with rectangular section.
It is composed of a straight section (’photon pipe’) along which the
bremsstrahlung rays travel to the ST and a curved section
(’electron pipe’) defining the trajectory for e-s bent by the
magnetic field.
The pipe is hollow with an air filled inner section with size
cm2, its wall thickness is .
The magnetic field in the volume between the poles that includes the
’electron pipe’ is assumed constant with strength
when , corresponding
to a curvature radius .
The equipment for the detection of the e-s that lost energy in the target
was developed and installed inside the spectrometer magnet by our team: the
Photon Tagging System (PTS).
It consists of 12 micro-strip silicon detectors positioned on the internal walls
of the spectrometer magnet (see Fig.2, Fig.3 and Fig.4)
grouped into two modules of 6 detectors each, located into two hollow rectangular
aluminum boxes few mm thick. In each module, the detectors are
located along a straight segment and therefore follow only approximately the
curved section of the ’electron pipe’.
The area of each detector is
with thickness and is subdivided in
1187 strips with pitch. Only every third strip is read
resulting in 384 readout strips per detector and 4608 in total.
Between each pair of consecutive detectors inside a module, there is a gap
wide that is effectively a dead area. A larger gap wide
is present between the two modules that contributes to the dead area as well.
Electronic noise gives a small contribution compared to the signals from e-
amounting to that is of little relevance for the measurements.
Depending on the energy loss in the target, the electrons impinge on
different strips. The correlation in time between the signals of the e-
in the target and in the PTS tags the photon; the position on the PTS
measures the photon energy.
The trigger for reading out the target and PTS data is given by the delayed LINAC pre-trigger;
it is read out independently from the ST data. This point has great
relevance for the following analysis.
3 The Monte Carlo simulation
A proper characterization of the BTF requires a careful comparison of the data with a
detailed Monte Carlo simulation. The simulation is realized using the GEANT3 package [12].
The simulation incorporates a description of the electron beam delivered by the accelerator
complex with beam parameters determined partly from design values and partly from measurements.
The number of e- per bunch can be fixed to an integer value or can follow a Poisson
distribution averaged at any real value .
The material distribution of the bremsstrahlung target and of the spectrometer
is simulated in detail. The target and the pipe can be simulated
in air or in vacuum in various configurations. The default configuration is the one actually
used during data taking with the target and the pipe in air.
The interactions of electrons and photons
are driven by the GEANT3 routines with the possibilities of switching on and off the relevant
physics processes like Coulomb Multiple Scattering, bremsstrahlung, Compton scattering, pair
creation for all or only for some of the materials. This option turned out to be very useful
in understanding the behaviour of the BTF/PTS system.
The energy cuts for the e± and photons are kept at the minimum allowed by the program
(100 keV). A gauge of the quality of these cuts is the average energy loss of a minimum
ionizing particles crossing a thick silicon layer comparable
to a target detector or a ST layer thickness: it is keV. This level of precision
is required to simulate spurious hits in the target and in the ST that can affect the
measurement.
The digitization simulation in the silicon micro-strip detectors is based on a simplified model:
the charge released in the volume below each strip is collected by the strip without
accounting for diffusion and charge trapping. Exploiting the capacitive coupling [13],
the charges collected on all strips are fed into the readout strips with appropriate
coefficients as described in [3].
The noise is simulated simply adding a Gaussian distributed charge on each strip
around a cluster; the width is determined by the data and amount to
.
The e- beam is generated inside the last
straight section of the accelerator upstream the target
with a beam spot of elliptical shape with a 2D Gaussian distribution, with angular
divergences perpendicular to the beam generated according 2 separate Gaussian
distributions and with a Gaussian distributed momentum spread.
The momentum spread is provided by the DANE staff, while the other
beam parameters are directly measured.
3.1 The simulated photon beam
The photon beam directed to the ST is simulated through the interaction of
the e- beam with the target. The photon generation is due to the
bremsstrahlung effect and follows Eq.2 in the Appendix. This formula
shows an approximate dependency, that is a power spectrum with
index . More precisely, a fit of
Eq.2 in the interval with a power spectrum
returns an index .
The simulated energy spectrum of the most energetic rays
reaching the ST (but not necessarily interacting with it) is shown in
Fig. 5 with a power spectrum fit returning an index
as expected by the analytical formula. The number of e-s per bunch
is set to
without Poisson fluctuation. The same result is obtained when
with Poisson fluctuation.
This result is not obvious because of the energy dependent interactions along
the path that could change the spectrum, that turn out to be small.

Another important element that characterizes the beam is the fraction of multi-photon events. Because in an astrophysical environment there are no such events, they must be considered background and must be minimized. If an event has two or more photons with energy above the detection threshold in the ST (about few tens of MeV), they can interact simultaneously in the ST. The reconstruction software, designed for the astrophysical environment, is not fit to identify such events and will most likely fail or return incorrect energy and direction. The percentage fraction of multi-photon events above a threshold is shown in Fig.6. Even for events with , the fraction is not larger than a few % even for as small as 10 MeV. Therefore their contribution to errors in the measurement of the ST performances is at most of comparable size.
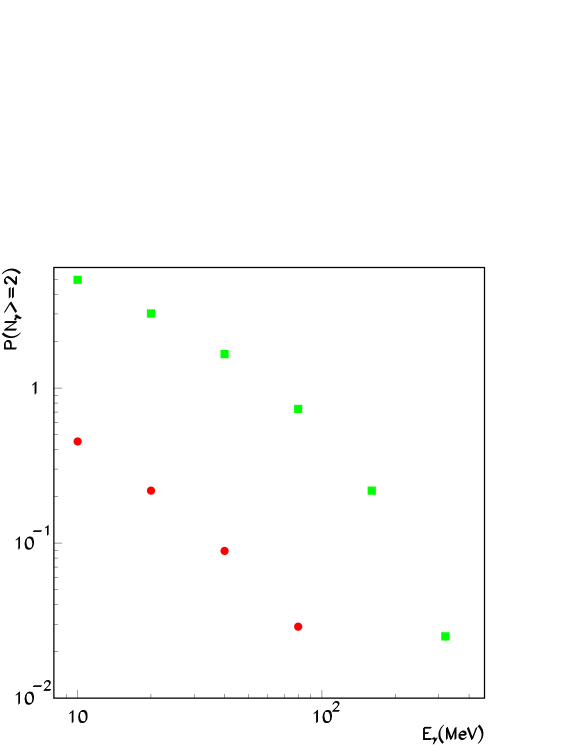
A related but somehow different issue is the number of low energy photons, say MeV, accompanying a photon in the ST energy range ( MeV). This photons are not enough energetic to convert in a e+e- pair detectable in the ST, but they can interact in coincidence with a photon of higher energy generating spurious hits that can influence the proper reconstruction of the event.
4 Results and discussion
The analysis of the target and the PTS data allows the validation of the Monte Carlo simulation required to correlate the -ray energy and the PTS hit position.
4.1 The bremsstrahlung target data
The analysis of the target data starts from looking for strips above a threshold,
then neighbouring strips are grouped into clusters. The cluster coordinate is
obtained calculating its centroid by weighting each strip coordinate with
the charge collected.
Ideally, each cluster should signal a hit of one e- in a target detector
and the passage of each e- should be signaled by one hit in each
target detector. In practice there is the possibility of inefficiency in the detection of
e- hits, noise hits, multiple clusters due to a single e- and single clusters
on the same target detector associated to multiple e-s.
The efficiency of the hit searching algorithm is measured by selecting the events
with one hit on three target detectors and zero on the fourth. This number is to be compared
with the events with one hit on each target detector.
With the available statistic, no event satisfies this requirement, so that
the efficiency is basically .
The fraction of noise induced hits can be estimated by requiring one hit on one target detector
and zero hit on the others. Also in this case, no event satisfies this requirement and
therefore the fraction of noisy hits is basically .
Particularly interesting samples are the 0-cluster events, where no cluster is detected in
the target, and the 1-cluster ones, where one cluster per target detector is detected. For the
considerations detailed above, the first sample can be safely associated to events with
0-e- events; even these events are triggered because the
target signal is not required by the trigger logic.
The 1-cluster sample mostly overlaps with 1-e- events and is used in the following
for characterizing the beam.
The main goal of these measurements is inferring the beam
properties to be used in the Monte Carlo generation.
4.1.1 Beam sizes
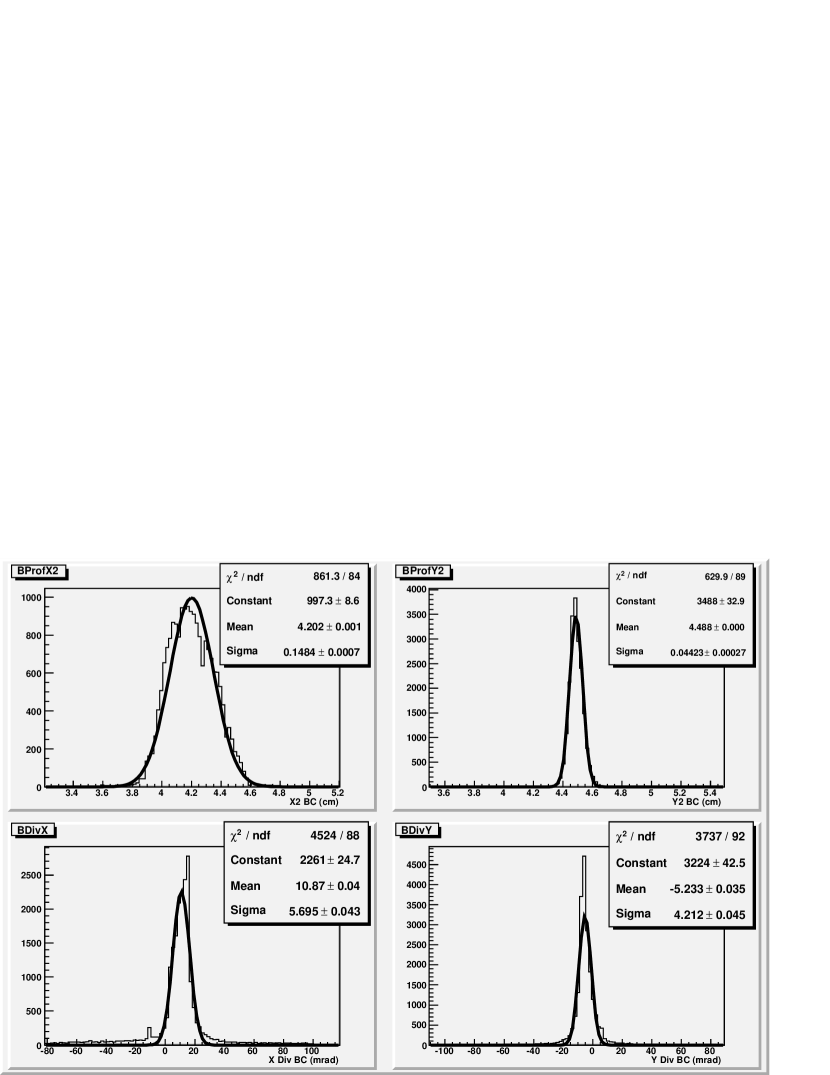
The beam sizes are measured only with 1-cluster sample.
The beam profiles using the first and measured coordinates in the
target are shown in the top row of Fig.7 with the results
of Gaussian fits superimposed.
Using the second and
measured coordinates in the target gives compatible beam sizes.
The beam sizes are and
with a significant non Gaussian tail in .
This numbers are representative but subject to significant variations for
different runs, due to changes in the beam setting.
4.1.2 Beam divergences
Angular divergences are measured using the 1-cluster sample. The estimator is the difference between the cluster coordinates () on the target divided by their distance
| (1) |
In Fig.7 (bottom row) the distributions of and are shown.
The Gaussian fit returns and
.
The beam divergences are, especially in , smaller than those presented in
[10]. That is due to an optimized setting of the accelerator slits
for this particular application.
The measured values for both the sizes and the divergences of the beam are fed into
the Monte Carlo generator to reproduce the experimental
distributions as shown in Fig.9.
4.1.3 e- multiplicity
The e- multiplicity of the BTF beam is one of the most important parameters required for an appropriate simulation of the photon beam. As discussed in Sect.2.1.2 the average of the Poisson distributed e- multiplicity is tuned by the accelerator staff. It is nevertheless important to monitor the e- multiplicity versus time to assess the reliability of the assumed multiplicity and its stability in time. The monitoring is possible by analyzing the hit multiplicity on the target. The e- multiplicity is expected to follow a Poisson distribution with average
where can be estimated from the fraction of 0-e- events given by , that is
.
Another estimation is obtained from the ratio of 1-e- events with
multi-e- events
If is measured, this relation can be inverted numerically to obtain .
As previously mentioned the 0-e- events are readily identified as events with 0-cluster events,
while the 1-e- sample largely overlaps with 1-cluster events.
In order to study e- multiplicity variation, events can be grouped in subsets
of 1000 events with a sufficiently
small statistical error. The estimated
e- multiplicity is plotted versus the event time
for two calibration runs in Fig.8.
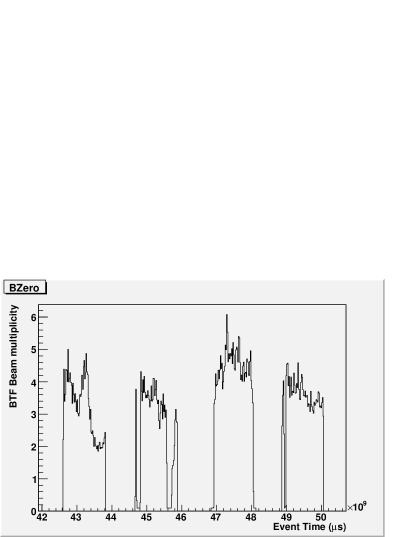

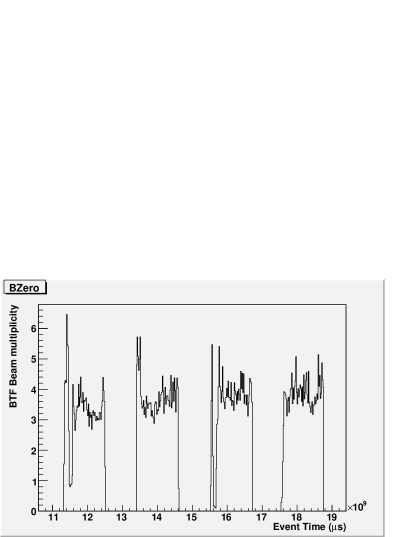
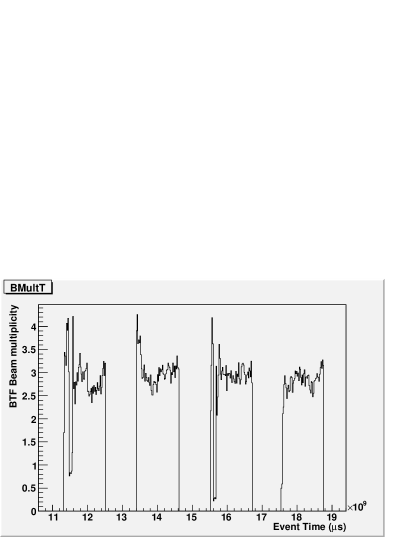
These results show a broad agreement with the expected e- multiplicity but also a quasi periodic duty cycle of beam on-off. When beam is on, there are occasional spikes and sometimes smoother variations. The estimations from is somehow lower than that from 0-e- events. That is expected if the chance that a multi-e- event appears as a 1-cluster event is higher that the reverse. That is what is expected for a narrow beam with some chance of overlapping hits from different e-s.
4.1.4 Beam simulation and comparison with data
The data contained from the target are used to tune the Monte Carlo
simulation of the beam. The relevant parameters are the coordinates of the
beam center, the widths of the beam spot, the beam divergences, the e-
multiplicity and the noise.
The measurements are performed on the target while the parameters of the beam
in the Monte Carlo generator are generated upstream (see Sect. 4.1).
These parameters may differ because
of the spread of the uncollimated beam and of the multiple scattering along the path.
Nevertheless the simulation guarantees that the beam widths at the origin of the Monte
Carlo generator show no significant difference with those measured on the target.
Therefore the measured widths and
can be directly used for the generation of the beam spot.
The beam divergences measured with the target are comparable with the
angular multiple scattering contribution from each of them (see Sect.2.2).
Therefore this contribution must be subtracted from the measured one to obtain the values
to be used in generation and
with defined in Eq.4.1.2.
The momentum spread is provided by the DANE staff as .

4.2 The PTS data
The PTS data are those tagging the production of a ray directed to the ST and
providing an estimation of its energy. Ideally the emission of a bremsstrahlung
ray from the target would result in an electron hitting the PTS
delivering one cluster of neighbouring strips above a predefined threshold.
In this case the -ray energy would be univocally correlated with the PTS
hit position.
The relation between -ray energy and PTS hit position, estimated by the cluster
centroid, is highly non-linear and must
be calibrated. The calibration can be performed either with the help of analytical
calculation or relying on Monte Carlo simulations. The former approach cannot easily
account for the other interactions of the electron in addition to the bremsstrahlung
in the target. Therefore the -ray energy, , is estimated with
the PTS energy estimator, , calibrated with the
Monte Carlo simulations detailed in Sect.4.2.1.
Another important point is the treatment of events with multiple PTS clusters.
Ideally these are multi-photon events and should be discarded from
the calibration sample. Yet, most
of the multi-cluster events are genuine single-photon events where additional
clusters are generated by secondary interactions. Furthermore for MeV, the e- trajectories intercept PTS detectors on both modules, resulting
in high probabilities of multi-cluster events even for single-photon events.
Therefore also multi-cluster events are retained.
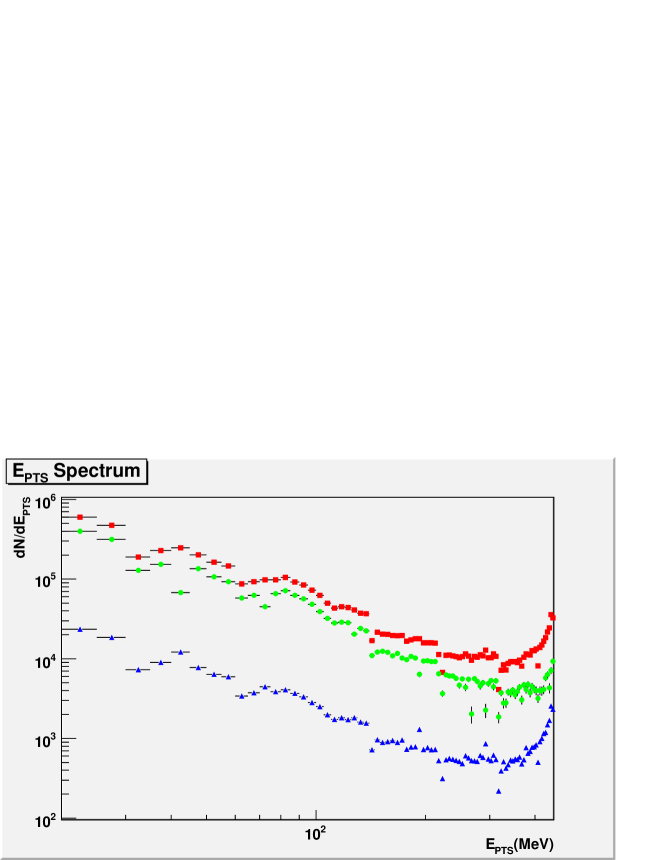
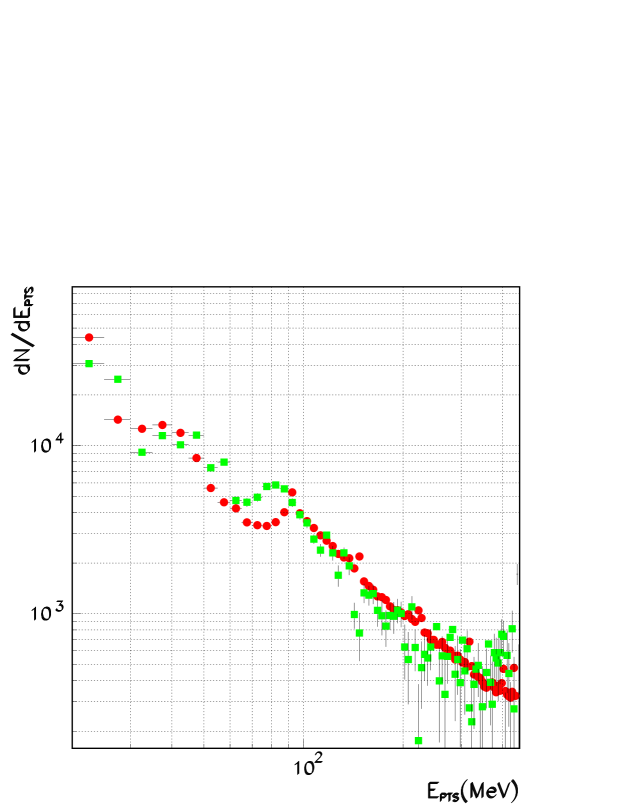
The spectrum of is shown in Fig.10.
It displays an anomalous feature at high energy, close to the kinematic limit,
where the increase with the energy looks incompatible with the expected behaviour
of the bremsstrahlung spectrum in Eq.2.
Two possible explanations are compatible with this excess background: a production
of non-bremsstrahlung related low energy electrons entering into the spectrometer
or a photon background in phase
with the BTF cycle (the rate of cosmic ray induced hits being too low).
The source of the low energy electrons could be rays produced in the interaction
of the beam electrons with the target. They should be proportional to the
number of electrons in the bunch and follow an approximate spectrum,
where
is the energy of the electron. This spectrum would fake a
spectrum
that would qualitatively matches the high energy tail of Fig.10.
On the other hand, Monte Carlo simulations and analytical calculations
show that this source is largely insufficient to account for the excess of PTS hits
corresponding to high .
Furthermore the two sources can be discriminated by looking at 0-e- events, where no
PTS hits from beam related rays are expected. Fig.10 shows a
significant fraction of 0-e- events with PTS hits strongly peaked at
high , that means at low strip numbers.
Hence only the latter background source is compatible with all experimental data.
The existence of a low energy photon background was also confirmed by the accelerator staff.
The spectrum of bremsstrahlung rays can be recovered by subtracting the
background spectrum appropriately rescaled with the 0-e- rate but the background events
cannot be tagged and removed on a event by event basis.
4.2.1 PTS simulation and comparison with data
In order to provide an interpretation of the PTS data and use them to characterize
the PTS/BTF system, a detailed Monte Carlo study is required. The Monte Carlo data
contains together with the PTS measurements also the true value at the generation
level of the particles (Monte Carlo truth), that can be compared to extract the PTS performances.
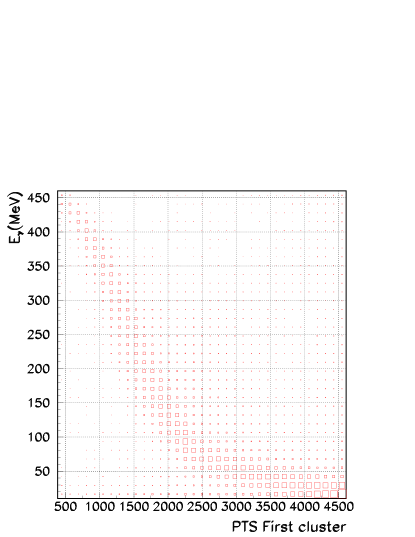
A crucial element is the calibration curve relating the PTS cluster position
and the electron (-ray)
energy already used in previous sections. The calibration is obtained
looking at Monte Carlo events generated with 1e- per bunch by plotting
the first strip (lowest number) of the first PTS cluster versus ,
the energy of the most energetic ray as shown in Fig.11. This plot is
obtained requiring one PTS cluster, MeV and additional energy from
rays other than the most energetic one MeV.
The points are distributed along a band plus a small set of outliers, whose origin
will be discussed later; in order to use only the points in the band, an additional
graphical cut is applied before the 2D histograms is plotted in form of profile histogram.
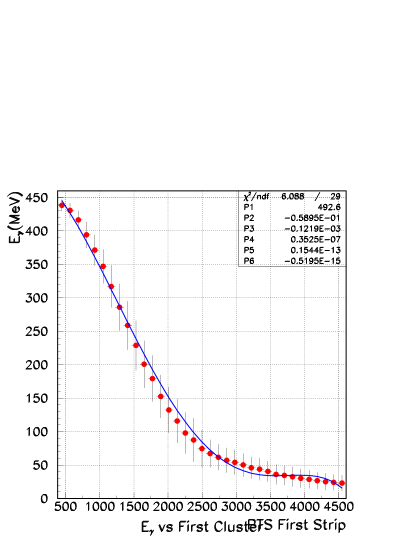
The profile histogram is fitted with a 5-th order polynomial as shown in Fig.11.
The fit has been also tested on simulated events produced with
with Poisson distribution, by allowing multiple PTS clusters or by requiring only
one ray above 100 keV; the fit results are insensitive to the cuts.
This functional dependence defines as the PTS measured energy.
The comparison between the data and Monte Carlo distributions is shown in Fig.12.
The agreement is reasonable even if some features appear systematically shifted.
4.2.2 PTS inefficiency, false positive and Outliers
The fit in Fig.11 is obtained using only events where the PTS energy measurement and the true -ray energy are significantly correlated. There are events in which that is not the case, that can be divided in three broad classes: PTS inefficiency, False positive and Outliers.
4.2.2.1 Inefficiency
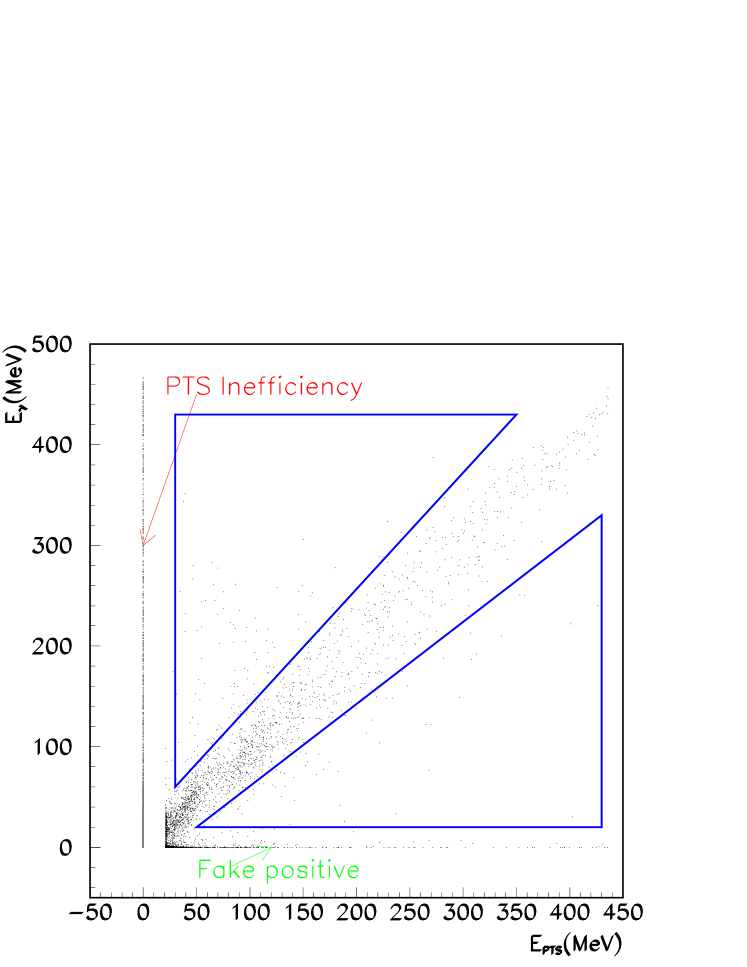
The plot vs. for Monte Carlo events with 1-e- per bunch is shown
in Fig.13.
The PTS inefficiencies, displayed in the vertical line on the left, are events where an electron
emits a ray by bremsstrahlung but it does not reach the PTS detectors. Such inefficiencies are understood
considering the path of an electron inside the ’electron pipe’: in absence of a focusing magnet
and subject to multiple scattering due to the target (and to the air along the path) the electrons
diverge from the ideal trajectory and may hit the wall of the pipe. That is particularly
easy along the direction where the pipe inner half-height is only
1.75 cm. In this case the e- showers and the shower particles (e±s and photons) may
hit or not the PTS detectors.
Another source of inefficiency originates when the e- hits the mm thick steel inner face
of the guide, as expected, and develops a shower fully in the iron.
A third cause is due to the e- hitting the inner face as expected but the
particles exiting from the outer face do not hit the PTS detectors that have an half-height
of only 1.00 cm.
4.2.2.2 False positive
The main cause of false positives, that is and , is the first
reason detailed before to explain inefficiencies: an e- that has not emitted a bremsstrahlung
ray showering in the electron
pipe on the top (bottom) face with some particles hitting the PTS detectors.
The probability of such events is proportional to the extent of the e- divergence and therefore
to the e- path length. Therefore it should increase almost linearly with the strip number, that is
inversely with .
False positive may also be the results of rays actually produced by bremsstrahlung and absorbed
along their path in air or by e- emitting bremsstrahlung rays in air along its path
in the electron pipe.
4.2.2.3 Outliers
Outliers are generated by a combination of processes similar to those described above.
An e- emitting a ray and then hitting the top (bottom) face of the pipe and delivering
a PTS signal generates an outlier.
Outliers can be generated also when the bremsstrahlung
ray interacts with air creating a e+e- pair, that in turn irradiates a lower energy
ray such that .
In presence of multiple e-s per bunch, a combination of a false positive and of an
inefficiency generates a outlier.
Another relevant source is e-s that, after having emitted a ray, cross the inner face
of the pipe showering without delivering a PTS signal close to the crossing point.
The shower photons may nevertheless convert in the PTS detectors at higher strip number,
so that .
4.3 PTS simulation results
Starting from the complex picture previously discussed the PTS can be characterized in different ways. The first step is understanding which is the best requirement on the number of PTS clusters. The possibilities are: 1 cluster, 2 clusters and clusters. The first is expected to have low efficiency but also small number of outliers and better energy resolution, the latter has the opposite features while the second is a compromise.
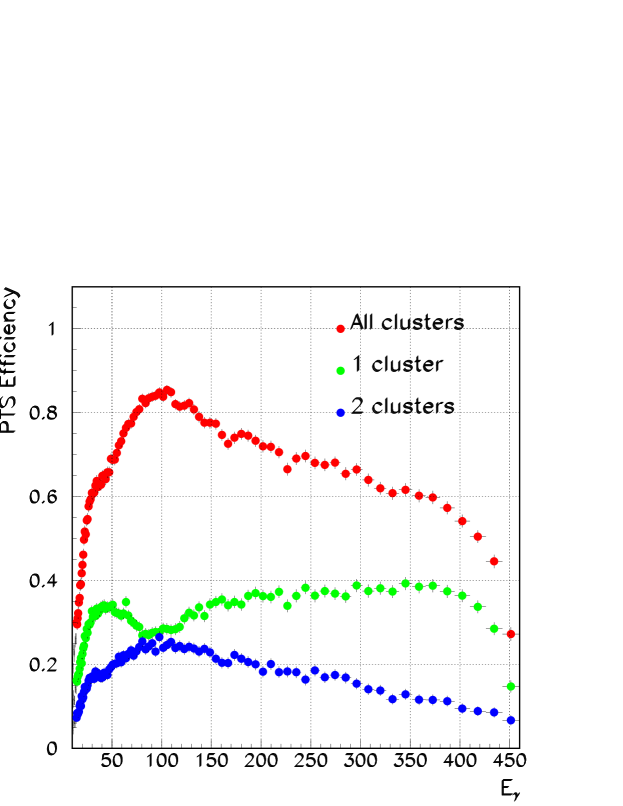
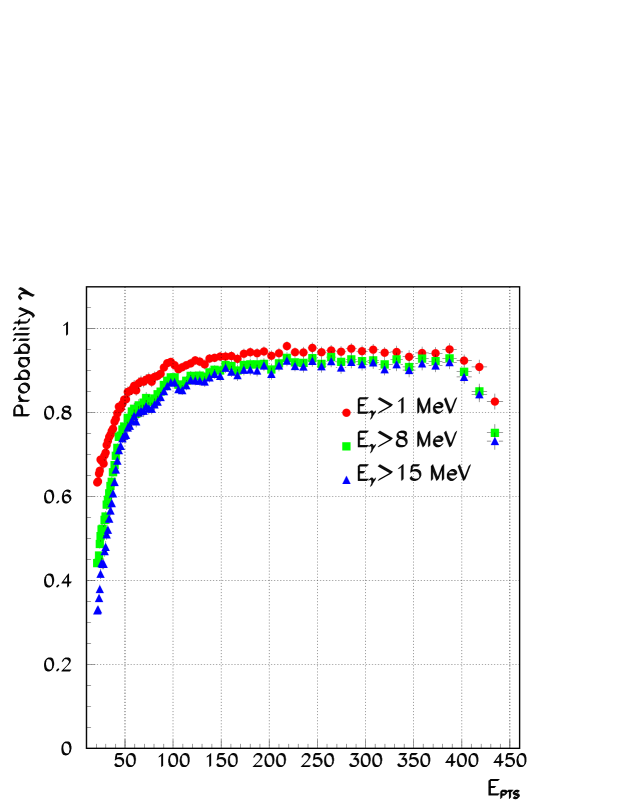
In Fig.14 the PTS efficiencies for the three cases are shown.
The option with clusters seems to be preferred not only because
it has higher efficiency but also because it is less sensitive to the
presence of secondary clusters generated by showering particles.
In this plot a loose definition of efficiency is used that requires only a
PTS cluster regardless of the relation, that is
also outliers are included.
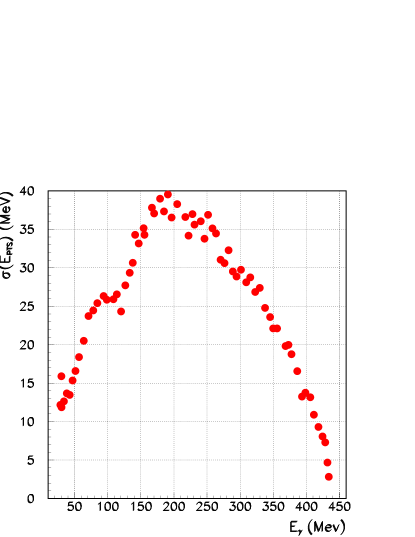
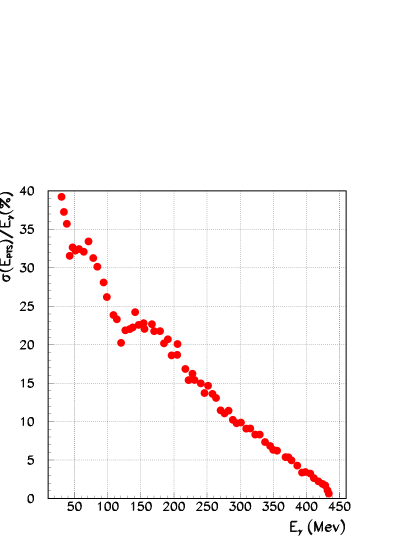
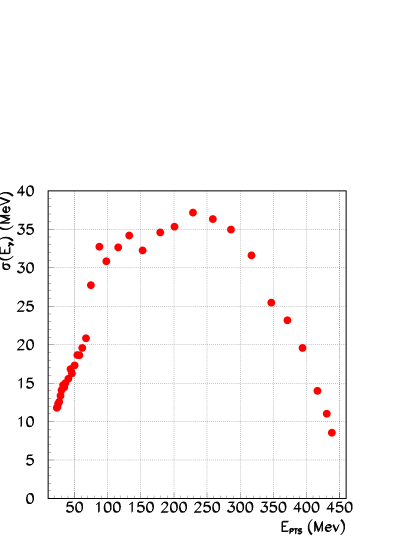
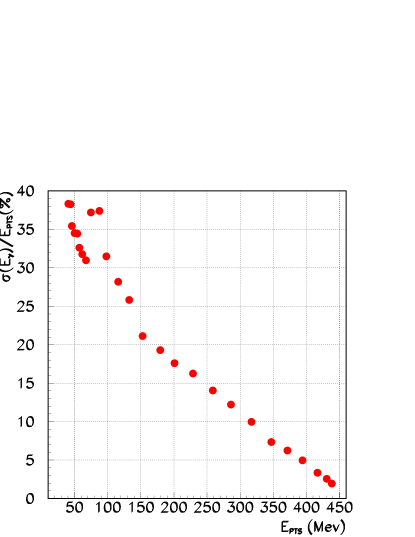
The absolute and relative RMS spreads in the versus
distribution limited to the central band, that is excluding outliers,
are shown in Fig.15-15.
Another approach is looking at the fraction of events with a PTS cluster associated to an energetic ray versus . That measures the probability of fake positive with the PTS as a photon tagger. A problem with this definition is that there is no infrared limit to . The lower limit is set by the GEANT threshold for production. A more robust definition is to set a threshold defined by the lowest for which the PTS has a reasonable efficiency, that is .
In Fig.16 the probability of having a ray above the given threshold versus is reported for events with PTS cluster. The complement of this plot gives the fraction of false positive. This fraction is understandably high for low where the probability of a non-emitting e- hitting the PTS is high and for high where the false positives originate from background. For most of the energy range the false positive fraction is % and weakly dependent on the threshold.
5 Conclusions
The BTF/PTS has been described
in detail. It has been characterized by studying the data taken in LNF during
the AGILE calibration campaign. Analysis of the target data has allowed to
characterize the beam precisely.
The parameters of the Monte Carlo generator have been mostly determined from the data.
Corrections to the data have been necessary to account for a background
contamination not included in the simulation.
The relation between PTS coordinate and -ray energy has been
calibrated with the Monte Carlo simulation and the distributions
from simulation and data are in good agreement.
This calibration of the system allows to use it for calibrating photon
detectors, like the ST of AGILE, as presented in a forthcoming paper.
Important parameters of the system like point spread function, effective area
and energy resolution versus the energy has been extracted through the Monte
Carlo simulation validated with this system and used to extract relevant scientific
results since the AGILE launch in 2007 [6].
Appendix
The photon flux can be predicted analytically with some approximated formulae
from Quantum Electrodynamics to be compared with the Monte Carlo predictions.
The formula for the bremsstrahlung differential cross section for photon emission
with energy from an electron with energy is, with good approximation
[11]
| (2) |
where is the atomic number of the material, its radiation length,
the Avogadro number and .
Eq.2 can be integrated to predict the number of photons
with relative energy between and
emitted by a radiator of thickness
| (3) |
In our setup the radiator consists of four silicon layer
thick, a window of Be thick and about of Air.
The total thickness expressed in radiation lengths is
(with , and
)
follow the Poisson distribution. Also the number of electrons per bunch follows a Poisson distribution with average , therefore the probability of emitting 1 or more photons is
| (4) | |||||
| (5) |
References
- [1] B. Buonomo et al. A tagged photon source at the Frascati beam-test facility (BTF). In Proceedings of DIPAC 2007, Venice, Italy, page 63, 2007.
- [2] S. Hasan et al. A Photon Tag Calibration Beam for the AGILE Satellite. LNF-05/24, 2005. Presented at the 9th ICATPP Conference on Astroparticle, Particle, Space Physics, Detectors and Medical Physics Applications, Como, Italy, Oct 2005.
- [3] G. Barbiellini et al. The AGILE silicon tracker: testbeam results of the prototype silicon detector. Nucl. Instr. and Meth. A, 490:146, 2002.
- [4] M. Prest et al. The AGILE silicon tracker: an innovative -ray instrument for space. Nucl. Instr. and Meth. A, 501:280, 2003.
- [5] M. Tavani et al. The AGILE space mission. Nucl. Instr. and Meth. A, 588:52, 2008.
- [6] M. Tavani et al. The AGILE mission. Astron.Astrophys., 502:995–1013, 2009.
- [7] G. Mazzitelli, A. Ghigo, F. Sannibale, P. Valente, and G. Vignola. Commissioning of the DANE beam test facility. Nucl. Instr. and Meth. A, 515(3):524, 2003.
- [8] P.W. Cattaneo et al. First results about on-ground calibration of the silicon tracker for the agile satellite. Nucl. Instr. and Meth. A, 630(1):251, 2011. Proceedings of the 2nd Roma International Conference on Astroparticle Physics (RICAP 2009).
- [9] B. Buonomo, G. Mazzitelli, and P. Valente. Performance and upgrade of the DANE beam test facility. In IEEE Nuclear Science Symposium Conference Record, Rome, Italy, October 2004.
- [10] G. Mazzitelli, B. Buonomo, L. Quintieri, and P. Valente. The DANE Beam Test Facility: from 1 to 10 milliards of particles. In Proceedings of EPAC 2006, Edinburgh, Scotland, 2006.
- [11] W.M. Yao et al. Review of Particle Physics. Journal of Physics G, 33, 2006.
- [12] R. Brun et al. GEANT3-Detector Description and Simulaton Tool, CERN Program Library Long Writeups W5013, 1993.
- [13] P.W. Cattaneo. Capacitance calculation in a microstrip detector and its application to signal processing. Nucl. Instr. and Meth. A, 295:207–218, 1990.