Sample-to-sample fluctuations in real-network ensembles
Abstract
Network modeling based on ensemble averages tacitly assumes that the networks meant to be modeled are typical in the ensemble. Previous research on network eigenvalues, which govern a range of dynamical phenomena, has shown that this is indeed the case for uncorrelated networks with minimum degree . Here we focus on real networks, which generally have both structural correlations and low-degree nodes. We show that: (i) the ensemble distribution of the dynamically most important eigenvalues can be not only broad and far apart from the real eigenvalue but also highly structured, often with a multimodal rather than bell-shaped form; (ii) these interesting properties are found to be due to low-degree nodes, mainly those with degree , and network communities, which is a common form of structural correlation found in real networks. In addition to having implications for ensemble-based approaches, this shows that low-degree nodes may have a stronger influence on collective dynamics than previously anticipated from the study of computer-generated networks.
pacs:
05.50.+q, 05.10.-a, 87.18.Sn, 89.75.-kPublished in Chaos 21, 025105 (2011); DOI:10.1063/1.3602223
In the network modeling of collective behavior, while one can analyze each network individually, the ideal is to draw general conclusions that can apply to an entire class of networks. However, one must ascertain under what conditions such results apply. These can be determined by considering ensembles, and many results have already been established for ensembles of random networks. It remains to be addressed, though, the extent to which random ensembles are representative of real networks. Given a real network , one can define an associated ensemble as the set of all possible realizations of the network in which one or more parameters, represented by , are preserved. In one extreme there is , where one only fixes the number of nodes, so that the real network could be very dissimilar from most ensemble elements. In the opposite extreme there is , where all possible parameters are fixed, but this is equivalent to studying the original network. An important goal is to restrict as few of the parameters as possible while still capturing the essential features of the real network. This is fundamental for the study of collective dynamics because in many network processes, including diffusion, consensus phenomena, and synchronization, the influence of the network structure is determined by the eigenvalues of a coupling matrix, which exhibit a rather convoluted dependence on simple network properties. Focusing primarily on the ensemble , which preserves the number of nodes and the degree sequence , we study the ensemble distribution of individual eigenvalues and the conditions under which the ensemble networks are representative of the real network.
| Real Networks | ||||||||
|---|---|---|---|---|---|---|---|---|
| (, ) | (, ) | (, ) | (, ) | (, ) | (, ) | |||
| Protein interaction | 4,927 | 6.5 | 296 | 0.117 | 297.02 | 21.64 | 0.058 | 1.93 |
| network (yeast) Goh2005 | (0.73, 0.53) | (-1.09, 0.031)† | (-10.83, 0.004) | (-14.49, 0.26) | (-1.73, 0.022)† | (1.30, 0.022)† | ||
| Gene regulatory | 662 | 3.2 | 71 | 0.020 | 72.03 | 9.98 | 0.011 | 1.99 |
| network (yeast) EcoliGeneRegulation | (0.51, 0.25) | (-2.75, 0.025) | (-6.34, 0.015) | (-7.34, 0.30) | (-2.71, 0.015) | (2.73, 0.015) | ||
| Neural network | 297 | 14.5 | 134 | 0.849 | 135.05 | 24.37 | 0.195 | 1.55 |
| (C. elegans) Watts1998 | (0.95, 0.94) | (0.55, 0.100) | (-12.57, 0.002) | (0.50, 0.16) | (-6.07, 0.048) | (0.68, 0.046) | ||
| Metabolic network | 268 | 4.3 | 45 | 0.280 | 46.12 | 8.92 | 0.102 | 1.88 |
| (E. coli) dataset | (0.89, 0.45) | (-0.77, 0.085) | (-0.03, 0.017) | (1.23, 0.21) | (-2.17, 0.022) | (1.32, 0.021) | ||
| Food web | 183 | 26.6 | 105 | 0.980 | 106.15 | 41.31 | 0.207 | 1.82 |
| (Little Rock) martinez_1991 | (0.99, 0.99) | (0.39, 0.042)∗ | (-1.97, 0.02) | (12.49, 0.12) | (-11.25, 0.035) | (26.84, 0.033) | ||
| Coauthorship network | 36,458 | 9.4 | 278 | 0.019 | 279.17 | 51.29 | 0.004 | 1.95 |
| (cond-mat) Newman2001 | (0.92, 0.78) | (-4.99, 0.033)† | (0.13, 0.061)∗ | (195.43, 0.11) | (-5.10, 0.023)† | (3.09, 0.023)† | ||
| Political blog | 1,222 | 27.4 | 351 | 0.169 | 352.05 | 74.08 | 0.081 | 1.79 |
| network Adamic2005 | (0.89, 0.80) | (-2.22, 0.160)∗ | (-27.58, 0.002) | (-3.53, 0.20) | (-3.12, 0.090)† | (1.73, 0.090)† | ||
| Word network | 30,243 | 59.9 | 1,145 | 0.111 | 1,146.1 | 146.83 | 0.016 | 1.71 |
| (Moby Thesaurus) Motter2002 | (0.99, 0.99) | (-19.63, 0.041) | (-2.26, 0.005) | (196.06, 0.11) | (-16.17, 0.041) | (9.62, 0.041) | ||
| Internet | 10,515 | 4.1 | 2,277 | 0.091 | 2,278.0 | 58.03 | 0.036 | 1.93 |
| (autonomous syst.) dataset | (0.64, 0.20) | (1.52, 0.015)† | (0.0, 0.003) | (-9.07, 0.24) | (-0.51, 0.009)† | (2.90, 0.009)† | ||
| Power grid | 4,941 | 2.7 | 19 | 0.001 | 20.11 | 7.48 | 0.0002 | 1.99 |
| (western U.S.) Watts1998 | (0.68, 0.02) | (-3.79, 0.007) | (-1.15, 0.10) | (27.51, 0.10) | (-3.75, 0.004) | (1.66, 0.004) | ||
| Electronic circuit | 512 | 3.2 | 22 | 0.029 | 23.11 | 5.01 | 0.009 | 1.96 |
| (s838) dataset | (0.9, 0.0) | (-3.19, 0.033) | (-0.98, 0.021) | (-1.61, 0.08) | (-4.68, 0.012) | (1.75, 0.012) | ||
| Airport network | 332 | 12.8 | 139 | 0.120 | 140.03 | 41.23 | 0.035 | 1.72 |
| (U.S.) dataset | (0.83, 0.68) | (-2.68, 0.160)∗ | (-5.88, 0.005) | (22.04, 0.18) | (-3.85, 0.089)† | (1.13, 0.085)† |
I Introduction
The complexity of networked systems is frequently studied via empirical observation that different real networks share common structural properties netbook ; Albert2002 . Such common properties have implications for network dynamical phenomena, which are often believed not to depend strongly on the specific network under consideration Albert2002 ; newman2003 . Ensembles of networks designed to reproduce common properties, including heterogeneous degree distribution and certain level of randomness, have been widely used in statistical physics studies of networks newman2003 ; Dorogovtsev2008 . This provides a convenient tool to address general and possibly universal aspects of network phenomena Dorogovtsev2008 ; arenas2008 . The inverse approach, focused on building a precise model to reproduce an observed network dynamical phenomenon, remains challenging in general. But to what extent can ensemble studies provide information about the properties of individual networks?
Previous research focused on the eigenvalues of coupling matrices has shown that the ensemble distribution of the eigenvalues converge to peaked, bell-shaped functions as the number of nodes in the network is increased Kim2007 . This result was established for random uncorrelated networks of given degree distributions with minimum degree , showing that under these conditions the eigenvalues of large networks are well represented by ensemble averages. However, the sample-to-sample fluctuations across the ensemble, which determine the quality of ensemble averages, may change when these conditions are relaxed. In particular, it has been shown that having a finite fraction of nodes with degree one or two can fundamentally alter the value of individual eigenvalues in the thermodynamic limit Samukhin2008 . These studies are insightful, and so are those based on the analysis of individual computer-generated networks Wu2005 . Yet, they do not directly address the properties of real networks, since empirically observed networks have finite size, are structurally correlated, and usually include low-degree nodes.
The central question that we raise in this context is how typical a real network is in an associated ensemble that preserves a selection of its local structural properties, such as the degree sequence. Here, we address this question by sampling the associated ensemble and contrasting the relevant eigenvalues of the ensemble elements with those of the real network used to generate it. We focus on the extreme (largest and/or smallest nonzero) eigenvalues of coupling matrices, because they encapsulate the structural network attributes that govern a number of network dynamical processes, such as synchronization Barahona2002 ; Nishikawa2003 ; Restrepo2006 , diffusion Motter2005 , and epidemic spreading Boguna2003 ; Wang2003 . The results are, therefore, representative of the impact that ensemble-based approaches have on the study of network dynamics in general.
The article is organized as follows. In Sec. II, we introduce and motivate the eigenvalues as well as the real networks we consider. In Sec. III, we show that in some cases the real network is well represented by the ensemble distribution, but in many other cases the ensemble distribution deviates significantly from the real network. We also show that the ensemble distributions are often highly structured, exhibiting multiple peaks. In Sec. IV, we explore the properties of -cores and network eigenvectors to elaborate on the origin of these structures. We also discuss the impact of community structures to rationalize the observed deviations of the real eigenvalues from the ensemble distributions. Finally, our concluding remarks are presented in Sec. V.
II Eigenvalues and empirical networks
We focus on the extreme eigenvalues of three connectivity matrices that play important roles in many dynamical processes: the adjacency matrix, the Laplacian matrix, and the normalized Laplacian matrix. The adjacency matrix is defined as , where if nodes and are connected and otherwise. The Laplacian and the normalized Laplacian are defined as and , respectively, where is the diagonal matrix of degrees. For connected undirected networks, as considered here, the smallest eigenvalue of the matrix is zero and all the others are strictly positive. The same holds true for the matrix . These coupling matrices have broad significance for the study of network dynamics. Synchronization of diffusively coupled oscillators, for example, is often determined by the largest eigenvalue () and the smallest nonzero eigenvalue () of the Laplacian Barahona2002 ; nishpnas . The relaxation time in diffusion processes is determined by the corresponding eigenvalues of the normalized Laplacian Motter2005 , which we denote and , respectively. The threshold for epidemic spreading Wang2003 and the dynamic range in excitable systems rest2011 , on the other hand, are largely influenced by the largest eigenvalue () of the adjacency matrix . Motivated by these and other dynamical applications in which extreme eigenvalues are found to play a role, the eigenvalues of interest in this study are , , , , and . For notational convenience, the nodes are labeled in increasing order of their degrees , such that .
We consider twelve real networks from various domains, including technology, biological sciences, and sociology dataset , which span a wide range of sizes and link densities (Table 1). For each of these networks we define the associated random ensemble , which preserves the number of nodes and the degree sequence, and we study the properties of the extreme eigenvalues in this ensemble. This is implemented computationally by randomly selecting independent network realizations in the ensemble. The ensemble networks are generated using the link-rewiring algorithm Newman2002 , which randomizes a network while preserving the given degree sequence . In this construction, all links are regarded as undirected, self-links and duplicated links are forbidden, and the networks are required to remain connected. Two realizations become statistically independent through link rewiring operations. Our statistics are based on independent network realizations for each ensemble. The finite number of realizations leads to a discrete set of the extreme eigenvalues , so that the distribution can be formally written as . To avoid artifacts associated with the discreteness of the distribution, the Dirac delta is approximated as a Gaussian distribution with a small variance.
III Eigenvalue ensemble distributions
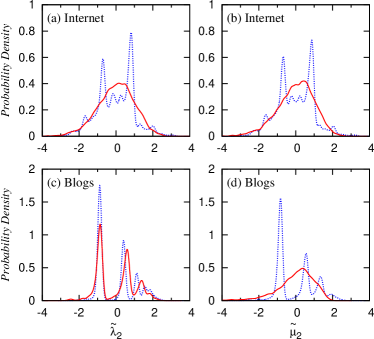
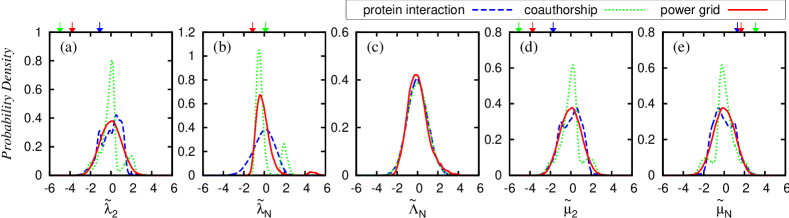
Figure 1 shows the ensemble distributions of the extreme eigenvalues for a selection of disparate real networks—a protein-interaction network, a scientific coauthorship network, and a power-grid network. Some of the distributions, such as the largest eigenvalue of the adjacency matrix for all three networks (Fig. 1(c)) and the largest normalized Laplacian eigenvalue for the power-grid network (Fig. 1(e)), exhibit relatively well-defined bell-shaped distributions. Others, however, exhibit pronounced deviations, including secondary peaks. This is the case, for example, for the extreme eigenvalues of the Laplacian (Fig. 1(a)-(b)) and normalized Laplacian (Fig. 1(d)-(e)) of the coauthorship network. Additional information is provided by considering the position of the corresponding eigenvalues of the real networks relative to these ensemble distributions. Surprisingly, in most cases the eigenvalue of the real network deviates significantly from the ensemble average. A notable exception is the largest Laplacian eigenvalue of the coauthorship network (Fig. 1(b)), where the real-network is well approximated by the ensemble average. Perhaps even more surprisingly, there appears to be essentially no relation between the bell-shaped form of the distribution and the quality of this approximation. For example, the largest Laplacian eigenvalue of the protein-interaction network does not lie within the range of the plot despite the bell-shaped form of the ensemble distribution (Fig. 1(b)), and the same is true for the largest eigenvalue of the adjacency matrix of all three networks (Fig. 1(c)).
To quantify this deviation, we consider the spectral position of the real-network eigenvalues, which we define as
where represents the eigenvalue. Here, the superscript indicates the eigenvalue of the real network, is the average of the eigenvalue in the associated ensemble, and is the standard deviation of the ensemble distribution, . This simple quantity provides a meaningful measure for the extent to which a real eigenvalue deviates from the ensemble average, which is expressed in units of the standard deviation.
Table 1 summarizes the statistics for all empirical networks considered. Several properties of the real-network eigenvalues, such as the approximate symmetry between and , are in good agreement with theoretical predictions Kim2007 . However, in most cases the value of is larger than unity, and in many cases it is much larger, confirming that real networks are often not typical in their own associated ensembles. That is, in terms of the extreme eigenvalues considered here, the real networks are often significantly different from the majority of the ensemble networks. Another interesting aspect of the results shown in Table 1 is that this deviation is not necessarily due to large deviations in absolute values. For all real networks, is just slightly larger than , as predicted theoretically for uncorrelated networks Kim2007 . The ensemble distributions are also peaked close to this point (at a distance for all networks), but because these distributions are very narrow, a small deviation in absolute value tends to correspond to a relatively large number in units of standard deviation.
On the other hand, several cases exhibit a structured rather than bell-shaped distribution, which cannot be anticipated from these theoretical results. This is so for the smallest nonzero eigenvalues of the Laplacian and of the normalized Laplacian (the same is true also for the largest eigenvalue of the normalized Laplacian, due to symmetry mentioned above, which is nearly exact for the ensemble networks). These cases are marked with superscripted symbols in Table 1. For example, for the Internet network and the network of political blogs, the ensemble distributions of these eigenvalues exhibit multiple large and relatively distant peaks (Fig. 2). The next question concerns the origin of these abnormal fluctuations. We hypothesize that the main cause of the fluctuations is the presence of poorly connected nodes and/or poorly connected groups of nodes. The basis for this hypothesis is that the smallest nonzero eigenvalues of Laplacian-like matrices are known to be influenced by low-degree nodes Samukhin2008 as well as by communities of densely connected nodes that are sparsely connected with the rest of the network newman2008 . Next, we study the extent to which these factors can generate the observed fluctuations in the ensemble distributions and deviations between the real eigenvalues and the ensemble averages.
IV Role of low degrees and additional network structure
To probe the influence of low-degree nodes, we explore the -core organization of the networks Dorogovtsev2006 . The -core of a network is the largest connected subnetwork in which all nodes have degree at least . Given a real network , we extract the -core() and then generate another random ensemble , where is the number of nodes and is the degree sequence of the -core. The first case of interest corresponds to -cores, where the minimum degree in the new network is . For the networks considered in this study, the -cores are found to exhibit spiky ensemble distributions comparable to those of the original networks. Our analysis of -cores, on the other hand, reveals very different behavior: as illustrated in Fig. 2(a)-(b) for the Internet network, the distributions of the smallest nonzero eigenvalues of the Laplacian and normalized Laplacian become significantly smoother and close to bell-shaped curves. Similar smoothening of ensemble distributions for the -cores is observed for the smallest nonzero eigenvalues of most networks with fluctuations, as summarized in Table 1. This confirms that the fluctuations in and (and also ) are mainly due to nodes with degree and .
We do not systematically consider -cores for higher because the loss of statistics due to the reduction in the size of the network may compete with the effect of removing low-degree nodes. However, there are cases where the fluctuations still appear in the ensemble distributions of the -cores, such as for the smallest nonzero eigenvalue of the Laplacian in the network of political blogs (Fig. 2(c)). This suggests that other types of network structures are affecting some of the ensemble distributions.
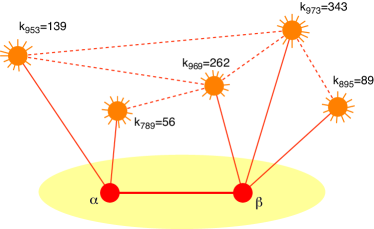
In the particular case of the network of political blogs, we find that there is a relationship between the distribution of the eigenvalue and subgraph structures involving low-degree nodes. Specifically, at the peaks of the distribution of , the components of the associated eigenvector are dominantly large for a certain pair of low-degree nodes that are directly connected and whose other neighbors have considerably larger degrees. Figure 3 highlights this structure in an ensemble element that is at one of the peaks of . While different ensemble realization will have different such nodes connected to each other, we can show that the impact they have on the fluctuations of the eigenvalue distributions is mainly determined by their degrees. Overall, there exist only few links between low-degree nodes in a chosen network realization, but the frequency with which an ensemble network exhibits at least one such subgraph is relatively high. This is likely related to the fact that the network of political blogs has a very long-tailed degree distribution, which along with the constraints of not having self-links and duplicated links, leads to the relatively frequent occurrence of such subgraphs in the ensemble. Moreover, the observation of these subgraphs allows us to estimate analytically the positions of the peaks of for this network.
Assuming that only one such subgraph contributes to the eigenvector of , we can project the full Laplacian onto the reduced space that consists of two low-degree nodes, and , and their neighbors. Accordingly, by writing the eigenvalue equation explicitly and noting that the degrees of the neighbors of and are much larger than , we derive the approximate expression
where is a small number, with and the summation taken over the neighbors of and . Even with the rough approximation , the calculated shows remarkable agreement with the peaks of the eigenvalue distribution observed in the network of political blogs. In the random ensemble of the original network, the low-degree combinations provide , , for and , , , respectively, which are in precise agreement with the observed major peaks of . Even though increases with and , the equation above also provides very good estimations for the peaks in the ensemble of -cores. The estimations for and , , are , , , respectively, which are very close to the major peaks observed at , , . While this eigenvector analysis applies to the network of political blogs, the multimodal distributions found in the other network ensembles may be determined by other network structures. But we suggest that even in such cases, the peaks in the eigenvalue distributions are likely to be associated with patterns of subgraph structures that can take a relatively small number of forms.
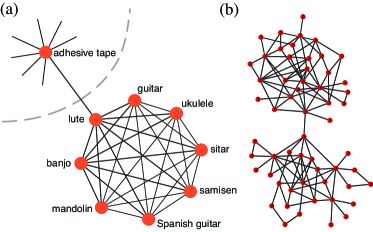
Another important question concern the origin of the often large deviation of the real eigenvalues from the ensemble averages even when the ensemble distributions are approximately bell-shaped. We propose that this is caused by the presence of structures in the real networks that would correspond to rare events in the random ensemble. An example of a particularly important such structure that can lead to large deviations from the ensemble averages is shown in Fig. 4(a): a densely connected community in the word network (Moby Thesaurus). This cluster dominantly contributes to the eigenvectors corresponding to the extreme eigenvalues and . In the cluster, eight words closely related to ‘guitar’ form a fully connected subnetwork; this cluster is connected to the rest of the network by the link between ‘lute’, which has two very distinct meanings, and ‘adhesive tape’. This type of weakly connected network structure can cause the smallest nonzero eigenvalue of the Laplacian to be very small. This explains the small values of and found in the word network.
To exemplify this effect, consider the model network with two communities shown in Fig. 4(b). The eigenvalue for this network is . For the associated random ensemble, the ensemble average of this eigenvalue is , which is substantially larger than the eigenvalue of the initial network. This is so mainly because the ensemble does not preserve the community structure. Indeed, a community-preserving ensemble can be created in which the two communities are separately randomized and then linked together by a single link, and within this ensemble the average of is very close to the eigenvalue of the original network (difference ).
Because this type of structure is expected to be present to some extent in most real networks, the smallest nonzero eigenvalues of the Laplacian and normalized Laplacian of real networks are generally expected to be smaller than the corresponding random-ensemble averages. This explains the negative spectral position in most cases shown in Table 1. This, in turn, is consistent with the positive spectral position exhibited by the largest eigenvalue of the normalized Laplacian for the networks we consider. Community structures are expected to also impact other eigenvalues, such as the eigenvalues of the adjacency matrix, which have been used to design algorithms for community detection chauhan_per_2009 . The deviation of the eigenvalues from the ensemble distributions can also be partially determined by different network structures that set them apart from random, such as clustering, degree correlations, and assortative mixing restrepo_pre_2007 ; Mieghem . Disassortative networks, for example, are known to exhibit enhanced synchronization properties precisely because they have smaller ratio than their random counterparts motter_epl_2005 ; sorrentino_2007 .
V Final remarks
The fluctuations in the ensemble distributions observed in this study have important implications. On one hand, we have provided evidence that these structures are largely due to low-degree nodes in the network. On the other hand, it follows that these fluctuations cannot be ignored in the estimation and interpretation of ensemble averages associated with networks that have low-degree nodes, which is the rule and not the exception among real networks. Moreover, because these distributions can be broad, if one samples networks from the ensemble, the eigenvalue fluctuations from sample to sample will frequently be large. Another interesting aspect of this problem is that low degrees alone may not explain all the observed fluctuations and that, even for bell-shaped distributions the real eigenvalue of interest often deviates significantly from the ensemble average. For some of the eigenvalues, this deviation can be mainly attributed to the presence of community structures in the network. This, in turn, suggests that a promising approach would be to incorporate the community structures in the definition of the ensemble, as additional properties in . There are in fact models to generate random network ensembles with a large number of preserved properties, including communities bianoni and distributions of subgraphs newman . An important challenge for future research is to address the properties of real network with the framework provided by such models.
Acknowledgments
The authors thank Jie Sun for providing feedback on the manuscript. This study was supported by the U.S. National Science Foundation under Grants No. DMS-0709212 and No. DMS-1057128, and the Academy of Finland under Grant No. 139514.
References
- (1) M. Newman, A.-L. Barabási, and D. J. Watts (eds.), The Structure and Dynamics of Networks (Princeton University Press, 2006).
- (2) R. Albert and A.-L. Barabási, Rev. Mod. Phys. 74, 47 (2002).
- (3) M. E. J. Newman, SIAM Review 45, 167 (2003).
- (4) S. N. Dorogovtsev, A. V. Goltsev, and J. F. F. Mendes, Rev. Mod. Phys. 80, 1275 (2008).
- (5) A. Arenas, A. D az-Guilera, J. Kurths, Y. Moreno, and C. Zhou, Phys. Rep. 469, 93 (2008).
- (6) D.-H. Kim and A. E. Motter, Phys. Rev. Lett. 98, 248701 (2007).
- (7) A. N. Smukhin, S. N. Dorogovtsev, and J. F. F. Mendes, Phys. Rev. E 77, 036115 (2008).
- (8) C. W. Wu, Phys. Lett. A 346, 281 (2005).
- (9) M. Barahona and L. M. Pecora, Phys. Rev. Lett. 89, 054101 (2002).
- (10) T. Nishikawa, A. E. Motter, Y.-C. Lai, and F. C. Hoppensteadt, Phys. Rev. Lett. 91, 014101 (2003).
- (11) J. G. Restrepo, E. Ott, and B. R. Hunt, Phys. Rev. Lett. 96, 254103 (2006).
- (12) A. E. Motter, C. Zhou, and J. Kurths, Phys. Rev. E 71, 016116 (2005).
- (13) M. Boguñá, R. Pastor-Satorras and A. Vespignani, Phys. Rev. Lett. 90, 028701 (2003).
- (14) Y. Wang, D. Chakrabarti, C. Wang, and C. Faloutsos, in Proceedings of the 22nd International Symposium on Reliable Distributed Systems (IEEE, Los Alamitos, CA, 2003), p. 25.
- (15) T. Nishikawa and A.E. Motter, Proc. Natl. Acad. Sci. USA 107, 10342 (2010).
- (16) D. B. Larremore, W. L. Shew, and J. G. Restrepo, Phys. Rev. Lett. 106, 058101 (2011).
- (17) M. E. J. Newman, Phys. Rev. Lett. 89, 208701 (2002).
- (18) M. E. J. Newman, Proc. Natl. Acad. Sci. USA 103, 8577 (2006).
- (19) S. N. Dorogovtsev, A. V. Goltsev, and J. F. F. Mendes, Phys. Rev. Lett. 96, 040601 (2006).
- (20) S. Chauhan, M. Girvan, and E. Ott, Phys. Rev. E 80, 056114 (2009).
- (21) J. G. Restrepo, E. Ott, and Brian R. Hunt, Phys. Rev. E 76, 056119 (2007).
- (22) P. Van Mieghem, H. Wang, X. Ge, S. Tang, and F.A. Kuipers, Eur. Phys. J. B 76, 643 (2010).
- (23) A. E. Motter, C. S. Zhou, and J. Kurths, Europhys. Lett. 69, 334 (2005).
- (24) F. Sorrentino, M. Di Bernardo, and F. Garofalo, Int. J. Bifurcat. Chaos 17, 2419 (2007).
- (25) G. Bianconi, Phys. Rev. E 79, 036114 (2009).
- (26) B. Karrer and M. E. J. Newman, Phys. Rev. E 82, 066118 (2010).
- (27) K.-I. Goh, B. Kahng, and D. Kim, J. Korean Phys. Soc. 46, 551 (2005).
- (28) R. Milo, S. Shen-Orr, S. Itzkovitz, N. Kashtan, D. Chklovskii, and U. Alon, Science 298, 824 (2002).
- (29) D. J. Watts and S. H. Strogatz, Nature (London) 393, 440 (1998).
- (30) Available at http://www-personal.umich.edu/~mejn/netdata/, http://www.cosinproject.org, http://www.weizmann.ac.il/mcb/UriAlon/, and http://vlado.fmf.uni-lj.si/pub/networks/data/.
- (31) N. D. Martinez, Ecol. Monogr. 61, 367 (1991).
- (32) M. E. J. Newman, Proc. Natl. Acad. Sci. U.S.A. 98, 404 (2001).
- (33) L. A. Adamic and N. Glance, in Proceedings of the WWW-2005 Workshop on the Weblogging Ecosystem (2005).
- (34) A. E. Motter, A.P.S. de Moura, Y.-C. Lai, and P. Dasgupta, Phys Rev. E 65, 065102 (2002).