How people make friends in social networking sites–A microscopic perspective
Abstract
We study the detailed growth of a social networking site with full temporal information by examining the creation process of each friendship relation that can collectively lead to the macroscopic properties of the network. We first study the reciprocal behavior of users, and find that link requests are quickly responded to and that the distribution of reciprocation intervals decays in an exponential form. The degrees of inviters/accepters are slightly negatively correlative with reciprocation time. In addition, the temporal feature of the online community shows that the distributions of intervals of user behaviors, such as sending or accepting link requests, follow a power law with a universal exponent, and peaks emerge for intervals of an integral day. We finally study the preferential selection and linking phenomena of the social networking site and find that, for the former, a linear preference holds for preferential sending and reception, and for the latter, a linear preference also holds for preferential acceptance, creation, and attachment. Based on the linearly preferential linking, we put forward an analyzable network model which can reproduce the degree distribution of the network. The research framework presented in the paper could provide a potential insight into how the micro-motives of users lead to the global structure of online social networks.
keywords:
Online social network , Microscopic behavior , Reciprocation , Human dynamics , PreferencePACS:
89.65.-s , 87.23.Ge , 89.75.Hc1 Introduction
At present the World Wide Web (WWW) is undergoing a landmark revolution from the traditional Web 1.0 to Web 2.0 characterized by social collaborative technologies, such as social networking sites (SNSs), blogs, Wiki, and folksonomy [1]. As a fast growing business, many SNSs of different scopes and purposes have emerged in the Internet, many of which, such as MySpace [2, 3], Facebook [4-7], and Orkut [2, 8], are among the most popular sites on the Web according to Alexa.com. Users of these sites, by establishing friendship relations with other users, can form online social networks (OSNs), which provide an online private space for individuals and tools for interacting with other people over the Internet. Both the popularity of these sites and availability of network data sets offer a unique opportunity to study the dynamics of OSNs at scale. It is believed that having a proper understanding of how OSNs evolve can provide insights into the network structure, allow predictions of future growth, and enable exploration of human behaviors on networks [9-13].
Recently, the structure and evolution of OSNs have been extensively investigated by scholars of diverse disciplines. Golder et al. studied the structural properties of Facebook and found that the tail of its degree distribution is a power law which is different from the traditional exponential distribution of real-life social networks [4]. However, a mean of 179.53 friends per user for Facebook [4] or a mean of 137.1 friends per user for MySpace [2] is close to Dunbar’s number of 150, which is a limit on the number of manageable relations by human based on their neocortex size [14]. Holme et al. studied the structural evolution of Pussokram and found that its degree correlation coefficient is always negative over time, i.e. disassortative mixing [15], which is in stark contrast to the significant assortative mixing for real-world social networks [16]. Viswanath et al. studied the structural evolution of the activity network of Facebook and found that the average degree, clustering coefficient, and average path length are all relatively stable over time [6]. Hu & Wang studied the evolution of Wealink [17, 18] and found that many network properties show obvious non-monotone feature, including a sigmoid growth of network scale which was also observed by Chun et al. in Cyworld [19], and a transition from degree assortativity characteristic of real social networks to degree disassortativity characteristic of many OSNs which was also observed by Szell & Thurner in Pardus [20].
Despite the advancement, we find that to date most research on OSNs has focused on either the structural properties of a certain snapshot of networks or the multi-snapshots of evolving networks rather than detailed microscopic growth dynamics. For the research framework of network evolution from a macroscopic viewpoint it is usually hard to reveal underlying mechanisms and growth processes governing the large-scale features of the observed network structure. In this paper, to gain better insight into the growth of networks, based on empirical data, we study the detailed process of people making friends in an OSN from a microscopic point of view. Instead of investigating the global network structure or structural metric evolution, we focus directly on the microscopic user behaviors per se, i.e., we study the properties of a sequence of the arrivals of each edge or the formations of each friend relation.
2 Data set
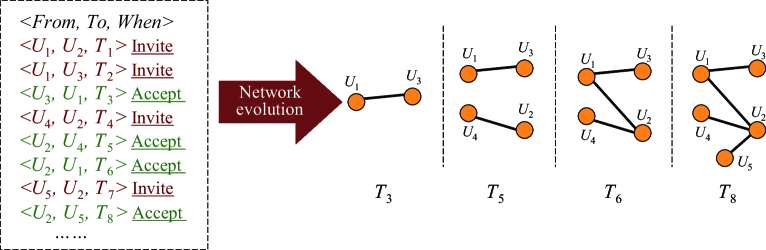
In this paper, we will focus on Wealink, a large SNS in China whose users are mostly professionals, typically businessmen and office clerks [17, 18]. Each registered user has a profile, including his/her list of friends. If we view the users as nodes and friend relations as edges , an undirected friendship network (, ) can be constructed from Wealink. For privacy reasons, the data, logged from 0:00:00 h on 11 May 2005 (the inception day for the Internet community) to 15:23:42 h on 22 August 2007, include only each user’s ID and list of friends, and the time of sending link invitations and accepting requests for each friend relation.
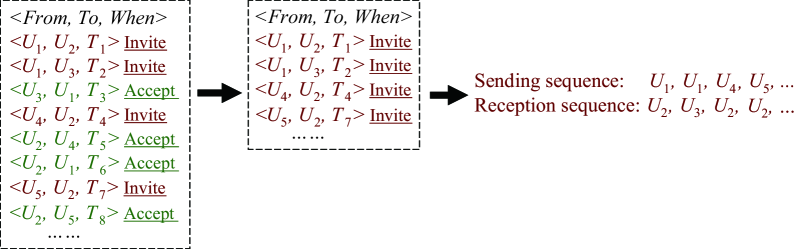
The finial data format, as shown in Fig. 1, is a time-ordered list of triples , , . For instance, , , indicates that, at time , user sends a link request to user , i.e., sends a friendship invitation to , while , , indicates that, at , accepts ’s request and they become friends, i.e., a new edge connecting and appears in the OSN. Thus only when the sent invitations are accepted will the friend relations or network links be established. The online community is a dynamically evolving one with new users joining the community and new connections established between users.
3 Reciprocal behavior
Like most OSNs, in Wealink, a user invites another user to be his/her friend; if the invited user accepts the invitation, a friend relation is established between them and a new edge connecting them appears (see Fig. 1). Thus the friendship is constructed by bilateral agreement. The degree of a user, i.e., the number of friends, will appear on his/her profile, which can be browsed by all the other users. During our data collection period, 273 209 sent link requests have been accepted and only 186 ones have not yet been accepted. Thus, in the following analysis, we will focus on the 273 209 sent link requests and their corresponding accepted ones with full temporal information.
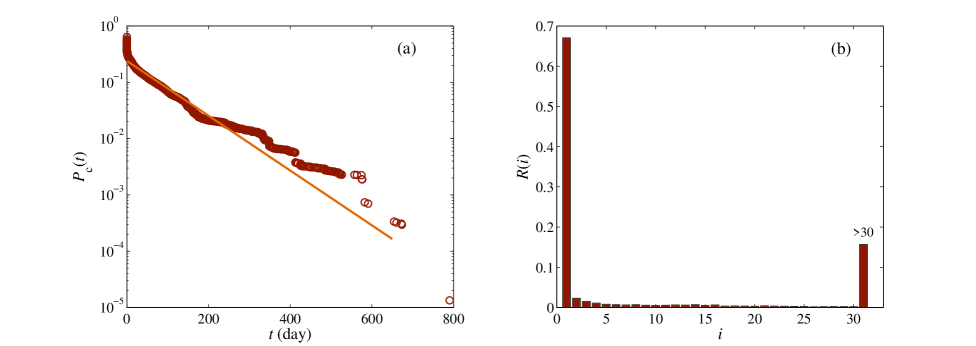
We first scrutinize the reciprocation of users, i.e., the sending of a link request from one user to another (as happens at in Fig. 1) causes following acceptance of the request (). Fig. 2(a) shows the complementary cumulative distribution of the intervals between sending and accepting link requests in Wealink. It is clear that users often quickly responded to link requests and reciprocated them. The interval distribution decays approximately exponentially. The least squares fitting gives with . In fact, as shown in Fig. 2(b), 67.04% of all reciprocal behavior occurred within one day (24 hours) after the initial link requests and 84.25% of sent link requests were accepted within one month (30 days). Wealink informs users by email of new incoming link requests. It is quite possible that many users reciprocated requests as a matter of courtesy and respect.
Recently inspired by the pioneering works of Barabási et al., there has been increasing interest for physicists and computer scientists in the research of human dynamics [21, 22], which focuses on the time interval distribution between two consecutive actions performed by individuals. The examples of such temporal statistics include the inter-event time distribution between two consecutive emails sent out by users, two consecutive visits to a web portal by users, and two consecutive library loans made by individuals. Empirical studies have shown that many distributions of inter-event time follow a power law. However, the exponential reciprocation interval distribution is in distinct contrast to the power law distribution of waiting time in emails (i.e., the time taken by users to reply to received emails). The importance of different emails is different. A reasonable hypothesis is that there can be correlation between the importance of emails and reputation/status of senders or “social closeness” to senders. Thus users can reply to received emails based on some perceived priority, and the timing of the replies will be heavy tailed. In contrast, there is no obvious priority for the reciprocal behavior of users in OSNs; thus an exponential distribution will well characterize the reciprocation interval distribution.
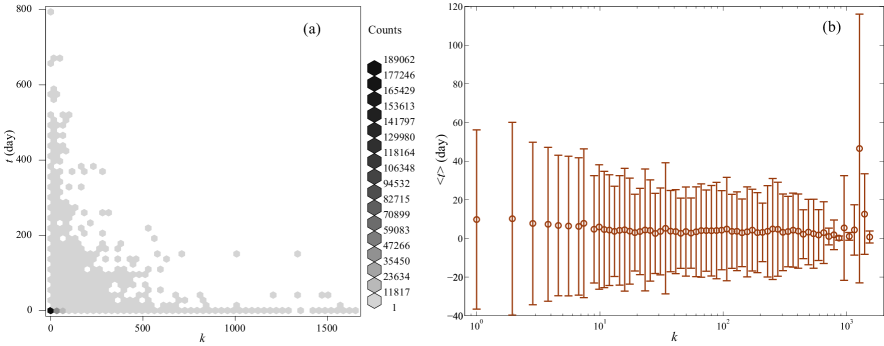
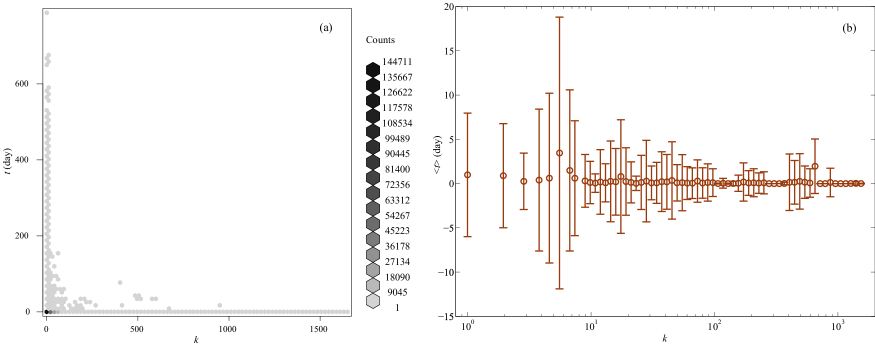
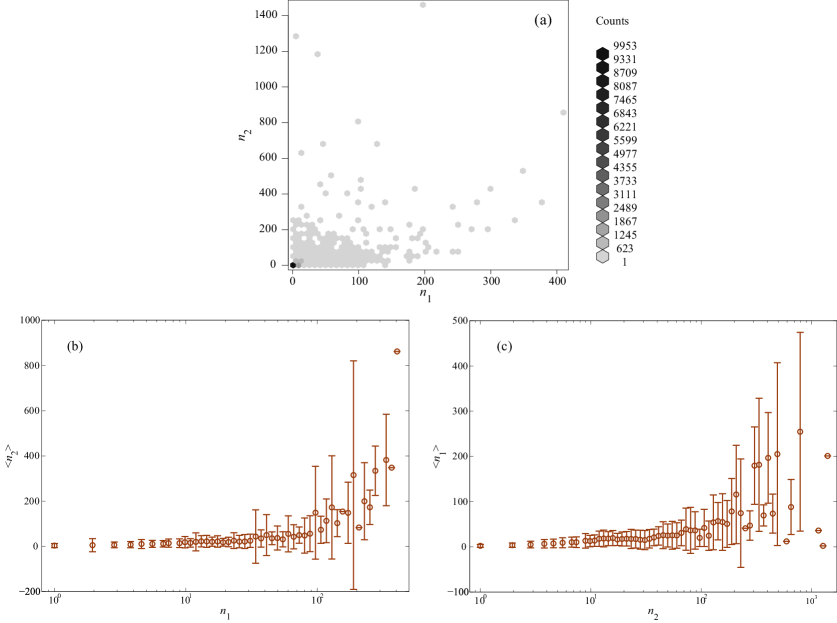
An interesting question is whether the users tended to reciprocate incoming link requests quickly regardless of how many friends the inviters or accepters had. To answer the question, we study the correlation between reciprocation time and the degrees of inviters/accepters at the time of sending link requests. Fig. 3(a) shows the density plot based on hexagonal binning for the relation between degrees of inviters and reciprocation time , where the cases with small and dominate. The Pearson correlation coefficient between and is -0.02, indicating slightly negative correlation. Fig. 3(b) shows the relation between and mean reciprocation time with logarithmic binning and error bars. exhibits mild descending trend as increases. Fig. 4 shows the relation between degrees of accepters and reciprocation time , which is similar to that shown in Fig. 3. The Pearson correlation coefficient between and is -0.05, also indicating mildly negative correlation.
4 Types of users and edges
The total number of users during the data collection period is =223 482. Obviously the users can be divided into three classes: active users who sent link requests but have never received ones, passive users who received requests but have never sent ones, and mixed users who both sent and received requests. As shown in Tab. 1, we find that most users belong to the former two classes. For the very popular SNSs, such as Facebook and MySpace, due to the high activity and degree values of users, most users could be mixed ones. However, Wealink is a very professional OSN with a mean degree of only 2.53. The activity of most users is low; after joining in the OSN they either send link requests to a few old users (acquaintance in real life very likely) or receive link invitations from several old users. Among the mixed users, there exists obvious positive correlation between the numbers of times of sending invitations and accepting invitations, and the Pearson correlation coefficient is 0.48. As shown in Fig. 5, we find that the more link requests a user sends, the more requests he/she will receive, and vice versa.
| Type | Active | Mixed | Passive |
|---|---|---|---|
| Number | 128 589 | 16 060 | 78 833 |
| Percentage | 57.54% | 7.19% | 35.27% |
The finial network density is only , and what results in the sparseness? As shown in Tab. 2, the =273 209 edges can be divided into four classes, and type expresses that initially users sent link requests to users. “Old” means that the users have been in the network; they joined in the network some time ago and they either have sent at least one link request to other users or have received at least one link request from other users. “New” means that the users have joined in the network; however, they neither have sent link requests to other users nor have they received link requests from other users. It is shown that in Wealink most links are established by old users sending requests to new users (more than 30%) and new users sending requests to old users (approximately 50%). The number of edges of Old-Old type is relatively small, leading to the sparseness of the network.
| Type | Old-Old | Old-New | New-Old | New-New |
|---|---|---|---|---|
| Number | 52 980 | 82 740 | 134 236 | 3 253 |
| Percentage | 19.39% | 30.28% | 49.13% | 1.19% |
5 Temporal characteristics of linking
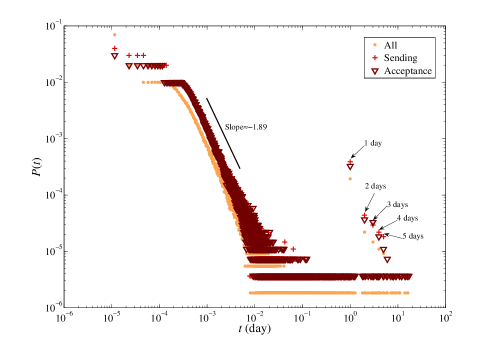
We study the time interval distribution between two link events. As shown in Fig. 6, the distributions of intervals between consecutive sending link requests (i.e., between and , and , and so on in Fig. 1), accepting requests (i.e., between and , and , and so on in Fig. 1) and any two events (i.e. between and () in Fig. 1) all follow a power law with a universal exponent 1.89, which diverges from the exponential distribution predicted by a traditional Poisson process and indicates bursts of rapidly occurring events separated by long periods of inactivity. Several peaks appear for intervals of an integral day in the tails of the distributions, indicating the daily periodicity corresponding to human life habits.
6 Preferential selection
Preferential selection means that, for a time-ordered list of individual appearance, the more likely an individual appeared before, the more possibly the individual will occur once again. We separate the preferential selection into two aspects: preferential sending and preferential reception. Preferential sending describes the mechanism by which users send new link requests with probability proportional to some power of the numbers of their sent link invitations before, and preferential reception describes the mechanism by which users receive new link requests with probability proportional to some power of the numbers of their received link invitations before.
Fig. 7 presents the schematic illustration of sending and reception sequences of OSNs. The former is a time-ordered list of users sending link invitations, and the latter is a time-ordered list of users receiving link invitations. In both sequences, the more frequently a user appeared before, the more likely the user will occur once again.
Let be the number of sent or received link invitations for user . The probability that user with frequency is chosen to send or receive a link request once again can be expressed as
| (1) |
Thus we can compute the probability that an old user of frequency is chosen, and it is normalized by the number of users of frequency that exist just before this step [23, 24]:
| (2) |
where represents that at time the old user whose frequency is at time is chosen. We use to denote a predicate (which takes a value of 1 if the expression is true, else 0). Generally, has significant fluctuations, particularly for large . To reduce the noise level, instead of , we study the cumulative function:
| (3) |
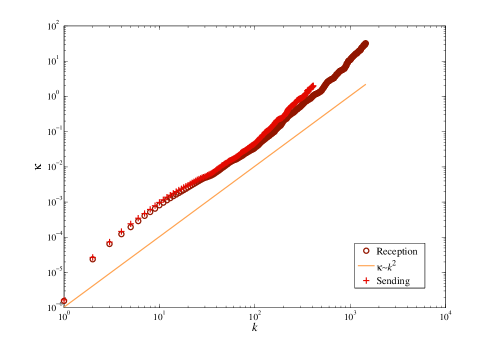
Fig. 8 shows how the frequency of users is related to the preference metric . for both preferential sending and preferential reception, indicating linear preference.
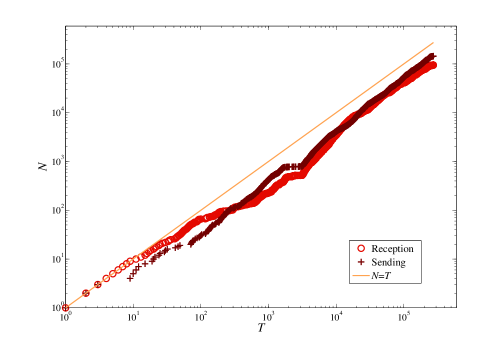
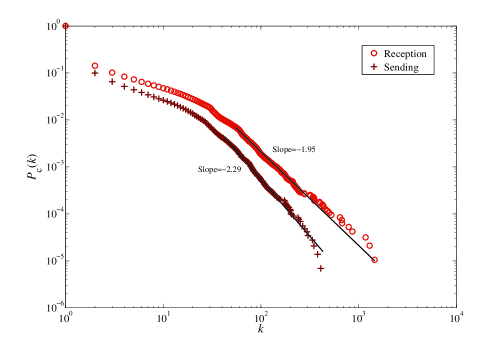
It is natural that, in the sending or reception sequence, the number of distinct users increases with sequence length . Fig. 9 shows the growth pattern of with for Wealink. , indicating that the appearance probability of new users is a constant, . According to the Simon model [25], based on linear preferential selection and constant appearance probability of new users, the complementary cumulative distributions of the numbers of sent invitations and received invitations for the users of Wealink follow a power law . Based on empirical data, for the inviters, we obtain and , and for the receivers, and . Fig. 10 shows the distribution functions of the frequencies of inviters and receivers, and the tails of both distributions show power law behavior. The power law exponents achieve proper agreement with the predicted values of the Simon model, .
7 Preferential linking
The degree distribution of Wealink shows power law features [17]. This kind of distribution can be produced, as indicated by the Barabási-Albert (BA) model [26], through linear preferential attachment, where new users tend to attach to already popular old users. In Wealink, as shown in Fig. 1, only when the sent link invitations are accepted can the inviters and receivers become friends and new edges appear in the social network. When new users establish friend relationship with old users, or new edges are established between old users, the old users with large degrees could be preferentially selected.
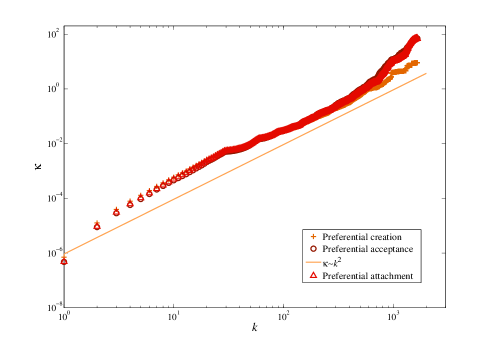
To test the preference feature for different types of link establishment, we separate the preferential linking into three aspects: preferential acceptance, creation, and attachment. Preferential acceptance implies that, the larger an old user’s degree is, the more likely he/she will accept link invitations from other old users. Preferential creation implies that, the larger an old user’s degree is, the more likely his/her link invitations will be accepted by the other old users. And preferential attachment implies that new users tend to attach to already popular old users with large degrees.
For instance, in Fig. 1, at time , a new edge appears between two old users and . Old user who accepts a link invitation can be chosen by preferential acceptance, and old user who sends a link invitation can be chosen by preferential creation. At time , a new edge appears between old user and new user , and old user can be chosen by preferential attachment. Fig. 11 shows the relation between the degree of users and the preference metric . We find that for preferential acceptance, creation, and attachment, indicating linear preference.
The property of linear preference for the network can be generalized to general OSNs. Mislove et al. studied the evolution of Flickr; they defined preferential creation as a mechanism by which users create new links in proportion to their outdegree, and preferential reception as a mechanism where users receive new links in proportion to their indegree [27]. They found that linear preference holds for both cases, i.e. users tend to create and receive links in proportion to their outdegree and indegree, respectively. Leskovec et al. studied the evolution of Flickr, del.icio.us, Yahoo!Answers, and LinkedIn, and examined whether the new users will preferentially link to the old users with large degrees [24]. They found that Flickr and del.icio.us show linear preference, , and Yahoo!Answers shows slightly sublinear preference, . LinkedIn has a different pattern: for low degrees , , and thus the preference is not obvious; however, for large degrees, , indicating superlinear preference, i.e., the edges to higher degree users are more sticky and high-degree users get super-preferential treatment. Even though there are minor differences in the exponents for different networks, we can say that , implying that linear preference may be universal for OSNs.
According to this linear preference, we put forward a realistic network model. Starting with a small network with nodes, at every time step, there are two alternatives.
. Growth and preferential attachment. With probability , we add a new node with () edges that will be connected to the nodes already present in the network based on the preferential attachment rule of the BA model, i.e., the probability that a new node will be connected to old node with degree is .
. Preferential creation and acceptance. With probability , we add () new edges connecting the old nodes. The two endpoints of the edges are chosen according to linear preference .
After time steps, the model leads to a network with average number of nodes . For sparse real-world networks, . When , the model is reduced to the traditional BA model. The model considers the introduction of new nodes and new edges, which can be established either between new nodes and old nodes or between old nodes. Most importantly, the model integrates linear preference for acceptance, creation and attachment found in the evolution process of real networks, and thus captures realistic features of network growth.
The model has an analytic solution. Its stationary average degree distribution for large is [28]
| (4) |
showing a scale-free feature. According to Tab. 2, we obtain and . The links created between two new users are few and thus can be negligible. In addition, for real growth of the network. Based on the parameters and Eq. (4), we obtain . Fig. 12(a) shows the numerical result which is obtained by averaging over 10 independent realizations with and =223 482. Its degree exponent 2.62 agrees well with the predicted value of 2.67. Fig. 12(a) also presents the complementary cumulative degree distribution of Wealink, and we find that the predicted value of the degree exponent 2.67 of the model achieves proper agreement with the real value 2.91. The difference between real and theoretical values may arise from the fact that and are time-variant variables and not constants. Fig. 12(b) shows the evolution of and and demonstrates the fact.

8 Summary and discussion
To conclude, we have unveiled the detailed growth of an OSN from a microscopic perspective. Our study shows that the distribution of intervals between sending and accepting link requests decays approximatively exponentially, which is in obvious contrast to the power law distribution of waiting time in emails, and there exists a slightly negative correlation between reciprocation time and degrees of inviters/accepters. The distributions of intervals of user behaviors, such as sending or accepting link requests, follow a power law with a universal exponent, indicating the bursty nature of the user act. We finally study the preference phenomena of the OSN and find that for preferential selection linear preference holds for preferential sending and reception, and for preferential linking linear preference also holds for preferential acceptance, creation and attachment. We propose a network model which captures real features of network growth and can reproduce the degree distribution of the OSN.
It is noteworthy that, although there is a close relation between the microscopic growth of networks and global network structure or structural metric evolution, it is still quite hard to bridge the gap between macro and micro perspectives of OSNs. For instance, preferential linking may possibly supply some information on the degree distribution of networks; however, it may not tell us much about the other properties of networks, such as clustering or community structure. Thus to gain an in-depth comprehension of OSNs, other microscopic behaviors of users, such as homophily, need to be studied in detail; a complementary research framework integrating macro and micro perspectives will also be indispensable.
References
- [1] T. O’Reilly, What is Web 2.0, http://oreilly.com/web2/archive/what-is-web-20.html.
- [2] Y.Y. Ahn, S. Han, H. Kwak, S. Moon, H. Jeong, Analysis of topological characteristics of huge online social networking services, in: Proceedings of the 16th international conference on World Wide Web, ACM Press, New York, 2007, pp. 835-844.
- [3] M. Torkjazi, R. Rejaie, W. Willinger, Hot today, gone tomorrow: on the migration of MySpace users, in: Proceedings of the 2nd ACM workshop on Online social networks, ACM Press, New York, 2009, pp. 43-48.
- [4] S.A. Golder, D. Wilkinson, B.A. Huberman, arXiv:cs/0611137.
- [5] K. Lewis, J. Kaufman, M. Gonzalez, A. Wimmer, N. Christakis, Social Networks 30 (2008) 330-342.
- [6] B. Viswanath, A. Mislove, M. Cha, K.P. Gummadi, On the evolution of user interaction in Facebook, in: Proceedings of the 2nd ACM workshop on Online social networks, ACM Press, New York, 2009, pp. 37-42.
- [7] J.P. Onnela, F. Reed-Tsochas, Proc. Natl. Acad. Sci. USA 107 (2010) 18375-18380.
- [8] A. Mislove, M. Marcon, K.P. Gummadi, P. Druschel, B. Bhattacharjee, Measurement and analysis of online social networks, in: Proceedings of the 7th ACM SIGCOMM conference on Internet measurement, ACM Press, New York, 2007, pp. 29-42.
- [9] B. Wellman, Science 293 (2001) 2031-2034.
- [10] C. Licoppe, Z. Smoreda, Social Networks 27 (2005) 317-335.
- [11] W.S. Bainbridge, Science 317 (2007) 472-476.
- [12] N. Shadbolt, T. Berners-Lee, Sci. Am. 299(4) (2008) 76-81.
- [13] L. Lü, T. Zhou, Physica A 390 (2011) 1150-1170.
- [14] R. Dunbar, Behavioral and Brain Sciences 16 (1993) 681-735.
- [15] P. Holme, C.R. Edling, F. Liljeros, Social Networks 26 (2004) 155-174.
- [16] M.E.J. Newman, Phys. Rev. E 67 (2003) 026126.
- [17] H. Hu, X. Wang, Phys. Lett. A 373 (2009) 1105-1110.
- [18] H.-B. Hu, X.-F. Wang, EPL 86 (2009) 18003.
- [19] H. Chun, H. Kwak, Y.H. Eom, Y.Y. Ahn, S. Moon, H. Jeong, Comparison of online social relations in terms of volume vs. interaction: A case study of Cyworld, in: Proceedings of the 8th ACM SIGCOMM conference on Internet measurement, ACM Press, New York, 2008, pp. 57-70.
- [20] M. Szell, S. Thurner, Social Networks 32 (2010) 313-329.
- [21] A.-L. Barabási, Nature 435 (2005) 207-211.
- [22] A. Vázquez, J.G. Oliveira, Z. Dezsö, K.-I. Goh, I. Kondor, A.-L. Barabási, Phys. Rev. E 73 (2006) 036127.
- [23] H. Jeong, Z. Néda, A.-L. Barabási, Europhys. Lett. 61 (2003) 567-572.
- [24] J. Leskovec, L. Backstrom, R. Kumar, A. Tomkins, Microscopic evolution of social networks, in: Proceeding of the 14th ACM SIGKDD international conference on Knowledge discovery and data mining, ACM Press, New York, 2008, pp. 462-470.
- [25] H.A. Simon, Biometrika 42 (1955) 425-440.
- [26] A.-L. Barabási, R. Albert, Science 286 (1999) 509-512.
- [27] A. Mislove, H.S. Koppula, K.P. Gummadi, P. Druschel, B. Bhattacharjee, Growth of the Flickr social network, in: Proceedings of the first workshop on Online social networks, ACM Press, New York, 2008, pp. 25-30.
- [28] J.-L. Guo, An evolution model for forum networks, preprint.