A Strong Dichotomy in S0 Disk Profiles Between the Virgo Cluster and the Field
Abstract
We report evidence for a striking difference between S0 galaxies in the local field and in the Virgo Cluster. While field S0 galaxies have disks whose surface-brightness profiles are roughly equally divided between the three main types (Types I, II, and III: single-exponential, truncated, and antitruncated), Virgo S0s appear to be entirely lacking in disk truncations. More specifically, the fraction of truncations in S0 galaxies with is % for the field, versus % for the Virgo Cluster galaxies; the difference is significant at the 99.7% level. The discrepancy is made up almost entirely by Type I profiles, which are almost twice as frequent in the Virgo Cluster as they are in the field.
This suggests that S0 formation may be driven by different processes in cluster and field environments, and that outer-disk effects can be useful tests of S0 formation models.
Subject headings:
galaxies: structure — galaxies: elliptical and lenticular, cD — galaxies: evolution — galaxies: clusters: general1. Introduction
One of the most interesting unresolved questions in the study of galaxy morphology is the origin of S0 galaxies. These galaxies are common in the denser parts of clusters (Dressler, 1980), which suggests a cluster-based formation mechanism. The discovery that clusters evolve from spiral-dominated at to S0-dominated at lower redshifts (e.g., Dressler et al., 1997; Postman et al., 2005; Poggianti et al., 2008) is evidence that clusters may in fact be turning spiral galaxies into S0s. Indeed, transformation mechanisms such as ram-pressure stripping (Gunn & Gott, 1972) require high orbital velocities and a relatively dense, hot IGM, as found in clusters.
However, S0 galaxies are also found in low-density environments such as small groups and even the local field (e.g., van den Bergh, 2009; Wilman & Erwin, 2011; Calvi et al., 2011), which suggests one of two things: either cluster-specific mechanisms such as ram-pressure stripping cannot create S0s, or there are actually multiple channels for forming S0s, some operating in clusters and others in lower-density regions. Moran et al. (2007) found evidence suggesting that both ram-pressure stripping and strangulation/starvation (Larson et al., 1980) may be operating in massive clusters, while Wilman & Erwin (2011) argue that a significant fraction of local field and group S0s probably became S0s as central galaxies within their dark-matter halos, which implies mechanisms other than interactions with the IGM (e.g., minor mergers; see Bekki, 1998; Bournaud et al., 2005). If the multiple-channel scenario is true, then there may be differences in S0 galaxies as a function of environment, differences which could be used to test S0 formation models.
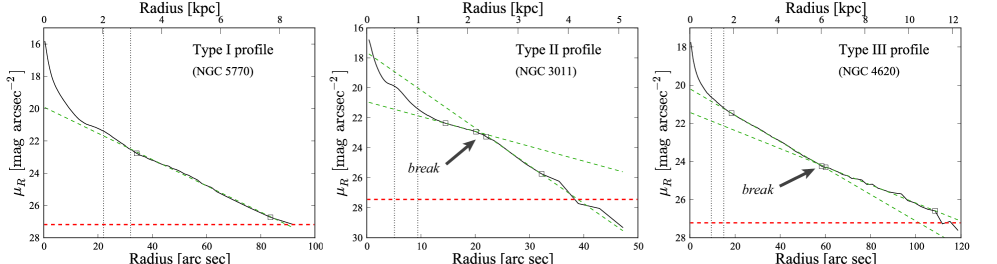
One galaxy feature which might show environmental influences quite clearly is the structure of the outer disk, which should be more vulnerable to effects such as gas stripping, tidal perturbations, and late-time accretion. Recent work (Erwin et al., 2005; Pohlen & Trujillo, 2006; Erwin et al., 2008; Gutiérrez et al., 2011) has shown that the surface-brightness profiles of outer disks – traditionally supposed to be purely exponential, or else exponential with sharp outer truncations – fall into three broad classes: single-exponential (Freeman [1970] Type I), truncated (Freeman Type II), or antitruncated (Type III; Erwin et al., 2005); see Figure 1 for examples. All three profiles have been observed in spiral galaxies out to (Pérez, 2004; Trujillo & Pohlen, 2005; Azzollini et al., 2008; Bakos et al., 2011). The analysis of Gutiérrez et al. (2011) indicated that local S0 disks are evenly divided between the three main classes. That study, however, was based on a sample of galaxies including both the Virgo Cluster and the local field. Clearly, it would be of interest to see whether there are differences in the outer disks of S0 galaxies as a function of environment. This Letter explores that possibility by comparing the outer disk profiles of S0s in the Virgo Cluster with those of local field S0s.
2. Sample Selection and Data
2.1. Virgo and Field Samples
The Virgo sample was constructed using the Virgo Cluster Catalog (VCC; Binggeli et al., 1988), starting with all galaxies having and secure membership.111The VCC classifies galaxies as “certain members”, “possible members”, and “background galaxies”; we only considered “certain” members. Data from RC3 (de Vaucouleurs et al., 1991) were then obtained for each of these galaxies, in order to isolate galaxies which were S0 and had axis ratios . (NGC 4733 is classified as “E+” in RC3 but has an SB0 classification in NED and clearly hosts a strong bar, so we included it in the sample.) We then checked each galaxy for distance measurements. This showed that NGC 4600 had a surface-brightness fluctuation distance of Mpc (Tonry et al., 2001), indicating that is a foreground object; we transferred it to the field sample. Several other galaxies were rejected because they overlapped with bright neighbors or very bright stars, had significantly distorted outer isophotes, were clearly edge-on, or were not actual S0 galaxies. Finally, we restricted ourselves to galaxies with ; this limit approximates the traditional boundaries between dwarf and giant galaxies, and corresponds to stellar masses (assuming a typical S0 of and the color-based mass-to-light ratios of Zibetti et al. 2009). The result was a set of 24 Virgo Cluster S0 galaxies.
The field sample was designed to have the same absolute magnitude limit and a distance limit of Mpc. The starting point was a combined set of barred and unbarred galaxies, whose surface-brightness profiles were presented in Erwin et al. (2008) and Gutiérrez et al. (2011), respectively (many of the Virgo S0 galaxies were also included in those studies). However, those samples were diameter-limited () and therefore tended to exclude more compact galaxies and galaxies at larger distances. To better match the Virgo sample, we defined the field sample as follows: all galaxies from HyperLeda with Hubble types , , declination , and redshifts (corrected for Virgocentric infall) . Galaxies which were VCC members were excluded (the only exception being NGC 4600; see above). As in the Virgo Cluster sample, RC3 measurements were then used to identify S0 galaxies with axis ratios . After closer inspection, nine galaxies were rejected for having been misclassified (e.g., NGC 2853 is classified as SB, but is clearly an early-type spiral), interacting or overlapping with neighboring galaxies or bright stars, or being too highly inclined despite the published axis ratio.
The resulting (nominal) field sample has a total of 55 S0 galaxies; however, suitable images are not available for all. Since images from the Sloan Digital Sky Survey (SDSS; York et al., 2000) have proven more than adequate for outer-disk profile work (see Pohlen & Trujillo, 2006; Erwin et al., 2008), we decided to use Data Release 7 (DR7 Abazajian et al., 2009) as our primary image source. This encompasses the entire Virgo Cluster and much of the nearby northern field; 43 of the field S0 galaxies have DR7 images. An additional seven S0 galaxies outside DR7 have already been analyzed using other image sources by Erwin et al. (2008) and Gutiérrez et al. (2011). We include these in our final sample in order to increase the field-galaxy numbers. Doing so does, however, introduce a slight bias in favor of brighter galaxies in the field sample, since the galaxies in the Erwin et al./Gutierrez et al. samples were selected to have . Therefore, we check all our results by using both the full field sample (50 S0 galaxies) and a “DR7-only” subsample, restricted to the 43 field S0 galaxies covered by DR7.
We use the term “field” somewhat loosely, since we did not attempt to distinguish between groups and genuinely isolated galaxies. However, we do believe that there is a clear difference between the Virgo Cluster and field samples: the latter does not include any truly high-mass groups comparable to Virgo. In the Nearby Optical Galaxy Groups (NOGG) catalogs (Giuricin et al., 2000), the largest group within 2500 in redshift and with other than the Virgo Cluster is the Ursa Major “Cluster” (Tully et al., 1996), which has three of our field S0s. This spiral-dominated group has a velocity dispersion of only 148 , compared with 715 for the Virgo Cluster (Tully, 1987). Twelve field S0s have no group assignment in the NOGG catalogs at all and are therefore plausible isolated galaxies. The field sample is thus a mixture of low-mass groups and isolated galaxies, providing a strong contrast with the Virgo Cluster sample. The two samples do not show any significant differences in absolute magnitude (Kolmogorov-Smirnov ).
3. Analysis and Disk-Profile Generation
Details of the process for extracting azimuthally averaged surface-brightness profiles of outer disks are presented in Erwin et al. (2008). Here, we briefly summarize the basic approach and discuss new automated techniques used to analyze SDSS images of the 28 galaxies not previously classified by Erwin et al. or Gutiérrez et al. (2011). Images for each galaxy were retrieved from the SDSS archive; if the galaxy was near the top or bottom of the image, the adjacent field was retrieved and the fields merged to form a larger image (adjacent fields in the vertical direction are from a single drift-scan observing run).
Careful sky subtraction is essential, as is careful masking of bright stars and other galaxies near the target galaxy. We started by running SExtractor (Bertin & Arnouts, 1996) on the -band images. The resulting catalog was processed into an SAOimage DS9 region file (converting stars to circles and galaxies to ellipses, with sizes being multiples of the SExtractor isophotal area)222Based partly on code kindly provided by Michael Pohlen.. These regions were then displayed on the image and edited (adding additional masking if necessary and removing regions corresponding to the target galaxy). A mask image was then generated from the region file, for use in conjunction with the ellipse-fitting (below). The mask file was also used for sky subtraction: median pixel values were determined for 100–150 -pixel regions, with locations chosen randomly such that they fell outside masked regions and were not within of the galaxy center ( = half of the diameter). The final sky value was the mean of these median measurements, with uncertainty computed by bootstrap resampling. We used to compute a limiting surface brightness ; this is the level at which a 1- error in the sky subtraction would produce a 0.2 mag arcsec-2 shift in the surface-brightness profile (see Pohlen & Trujillo, 2006; Erwin et al., 2008). Median-smoothed images were inspected to identify any residual large-scale gradients (typically vertical, due to changes in sky brightness during the SDSS drift scan); if present, these were removed with the iraf imsurfit task.
After sky subtraction, the galaxy disk orientation was determined by fitting ellipses to the -band isophotes, using the iraf task ellipse. Ellipses corresponding to the outer disk (i.e., outside any bars and prominent rings) were used to determine the overall galaxy orientation, under the assumption that the outer disk is approximately circular. We then re-ran ellipse with ellipse shape and orientation fixed to that of the outer disk. This generates surface-brightness profiles corresponding to circular averaging if the galaxy were face-on. (This approximation fails at small radii if there is a prominent, rounder bulge, but this does not affect the outer profile.) A key advantage of this approach is that it allows measuring the profile to much fainter levels than is possible when the program must simultaneously fit variable ellipses to the isophotes; typically, we can trace the profile to at least twice .
Finally, the surface-brightness profiles were classified into the three basic types (Figure 1), with additional subtyping as described in Pohlen & Trujillo (2006) and Erwin et al. (2008). Classifications and parameters for galaxies not in Erwin et al. (2008) or Gutiérrez et al. (2011) are presented in Table 1.
Since the influence of environmental effects are expected to be stronger in the outer disk, it makes sense to concentrate on differences in profiles at larger radii. Erwin et al. (2008) and Pohlen & Trujillo (2006) noted that a small fraction of Type II profiles had breaks at or interior to the bar radius (“Type II.i” profiles). It seems likely that these profiles are not produced by the same mechanisms that produce truncations at much larger radii; in fact, they appear to be produced spontaneously in isolated disks due to bar formation (Erwin et al., 2012). Thus, in our statistical analyses we do not consider II.i profiles to be true “truncations”, and group them with the Type I or III profiles (depending on the profile shape outside the bar). Because the distinction between II.i and II.o profiles is only possible for barred galaxies, we also look at the distribution of profile types for barred galaxies separately. For the S0 galaxies not previously studied in Erwin et al. (2008) or Gutiérrez et al. (2011), we carefully analyzed red (and, if available, near-IR) images for the presence of bars, and measured any such bars that were found; these measurements will be presented elsewhere. The absolute numbers of Type II.i profiles are quite small: two in the Virgo Cluster S0s and none in the field.
4. Comparisons Between Virgo and Field Galaxies
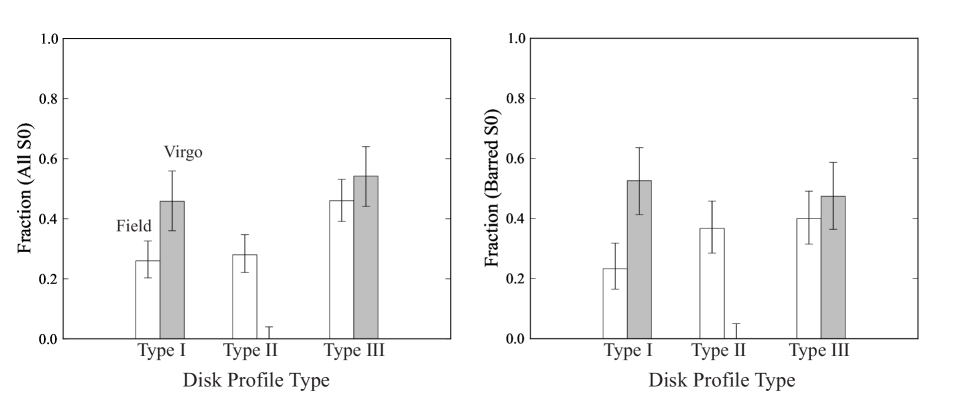
The distribution of profile types is summarized in Figure 2, both for the complete sample (left panel) and for just the barred galaxies (right panel). Two features are immediately apparent. First, there is a complete absence of truncations in Virgo Cluster S0s, in contrast to the relatively high frequency of truncations in field S0s: % of all field S0s (% of barred field S0s). For the DR7-only subsample (see Section 2.1), the frequencies in the field are % for all field S0s and % for the barred S0s. Second, Type I profiles are significantly more common in the Virgo Cluster (%) than in the field (%, or % for just the barred galaxies; % and %, respectively, for the DR7-only subsample). Type III profiles, on the other hand, are equally common in both environments.
The difference in profile frequencies seems strong; is it statistically significant? Rather than focus on, e.g., just the difference in truncation frequency (which amounts to selecting out the strongest deviation after the fact), we ask whether the distribution of all three profile types is similar for Virgo and field galaxies. For this, we can use the extended version of Fisher’s Exact Test. For the complete Virgo and Field samples, the Fisher’s Exact Test333We use the implementation in the R statistical package (http://www.r-project.org/) gives for the null hypothesis that both field and Virgo distributions come from the same parent population, and when only the barred galaxies are considered. Restricted to the DR7-only subsample, the signficance becomes even stronger: for all S0s and for barred S0s. (When the smaller number of unbarred galaxies are considered, the differences are not significant.) So the difference in outer-disk profiles between the Virgo Cluster and the local field is both large and statistically significant.
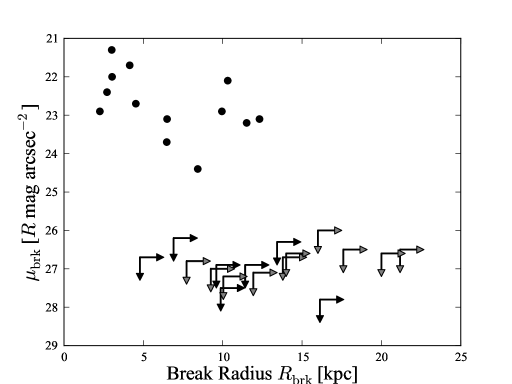
Could we be missing truncations at larger radii in the Virgo S0s, and thus mis-classifying them as Type I? This seems quite unlikely. Figure 3 shows that break radii for field S0s occur at –12 kpc, with surface brightnesses at the break of mag arcsec-2; the mean is 22.7. Also plotted are limits on any possible breaks for Type I profiles. The latter are all mag arcsec-2, much fainter than any observed breaks.
5. Discussion
We can summarize the difference between outer-disk profiles in the Virgo Cluster and the field thus: Type III profiles are (roughly) equally common in Virgo and in the field; in Virgo, the remaining profiles are all Type I, while in the field they are half Type I and half Type II. (We note that Maltby et al. 2011 found no significant environmental differences for spiral disk-profile frequencies in and around a multiple-cluster system at ; however, their classification scheme used a narrow surface-brightness range and is thus rather different from ours.444For example, about half of their “Type Io” example profiles show clear Type II breaks.) If we focus on the difference between Type I and II profiles and assume that it is indeed directly due to environmental effects, we can posit two possibilities: either something in the cluster (or proto-cluster) environment transforms Type II profiles into Type I, or else something prevents a Type I to Type II transition which is common in the field.
The most popular models for disk truncations combine two elements. The first is a radial dropoff in efficient star formation, either because the gas density falls below some critical star-formation threshold (Kennicutt, 1989; Schaye, 2004; Elmegreen & Hunter, 2006) or because the gas density profile itself has a sharp break, possibly due to accretion-induced warping (Roškar et al., 2008a; Sánchez-Blázquez et al., 2009; Martínez-Serrano et al., 2009). The second element is the outward scattering of stars from the inner disk, such as produced by transient spiral arms (Sellwood & Binney, 2002; Roškar et al., 2008a, b; Sánchez-Blázquez et al., 2009; Martínez-Serrano et al., 2009). The main problem is that these models tend to approach disk truncation as a universal phenomenon and do not, in general, explain how and why truncations might not occur.
If we assume that a significant fraction of present-day cluster S0s originally had truncations, then we can look for something which could erase truncations. One possibility is “harassment” (e.g., Moore et al., 1996, 1999), where a galaxy’s motion through the (evolving) cluster potential leads to repeated tidal shocks. The “high-surface-brightness” model galaxy in Moore et al. (1999, their Fig. 7) had its initially single-exponential profile transformed into a mild antitruncation by this process; this suggests that a Type II profile could “flatten out” into a Type I profile (but see Gnedin, 2003). More detailed simulations involving disks with initially truncated profiles are needed to see if this is a viable mechanism. (Of course, this cannot be the only way to form Type I profiles, since they are also found in the field.)
Alternatively, we can consider cluster-based mechanisms which might prevent Type II profiles from forming in the first place. If, as suggested by Erwin et al. (2008) and Erwin et al. (2012), truncations in S0s and early-type spirals are predominantly related to the same sort of bar–Outer Lindblad Resonance (OLR) interactions which produce outer rings, then one possible scenario might be the following. The long dynamical times in outer disks suggest – and simulations agree – that large-scale changes there such as outer-ring formation require several Gyr (see references in Buta & Combes, 1996). Since bar-OLR interactions are strengthened by the presence of signficant gas in the outer disk (gas, being dynamically cooler than the stellar disk, more readily absorbs angular momentum from the bar), the removal of gas should weaken OLR effects. One possible signature of this might be a tendency of gas-deficient spirals to be less likely to have Type II profiles and outer rings.555The referee pointed out the example of NGC 4245, a strongly barred field S0/a with a Type I profile (Erwin et al., 2008) and strong H i deficiency (Boselli & Gavazzi, 2009). If S0s in the field were able to retain gas in their outer disk for longer periods, they would be more likely to show the effects of bar-OLR interactions and develop Type II profiles. S0 galaxies in Virgo, on the other hand, could have lost their gas – particularly in the outer disk – earlier on due to, e.g., a combination of ram-pressure stripping and strangulation.
References
- Abazajian et al. (2009) Abazajian, K. N., et al. 2009, ApJS, 182, 543
- Azzollini et al. (2008) Azzollini, R., Trujillo, I., & Beckman, J. E. 2008, ApJ, 679, L69
- Bakos et al. (2011) Bakos, J., Trujillo, I., Azzollini, R., Beckman, J. E., Pohlen, M. 2011, Mem. S. A. It. Suppl., 18, 113
- Bekki (1998) Bekki, K. 1998, ApJ, 502, L133
- Bertin & Arnouts (1996) Bertin, E., & Arnouts, S. 1996, A&A, 117, 393
- Binggeli et al. (1988) Binggeli, B., Sandage, A., & Tammann, G. A. 1988, AJ, 90, 1681
- Boselli & Gavazzi (2009) Boselli, A., & Gavazzi, G. 2009, A&A, 508, 210
- Bournaud et al. (2005) Bournaud, F., Jog, C. J., & Combes, F. 2005, A&A, 437, 69
- Buta & Combes (1996) Buta, R., & Combes, F. 1996, Fund. Cosmic Physics, 17, 95
- Calvi et al. (2011) Calvi, R., Poggianti, B. M., Fasano, G., & Vulcani, B. 2011, MNRAS, in press
- de Vaucouleurs et al. (1991) de Vaucouleurs, G., de Vaucouleurs, A., Corwin, H. G., Buta, R. J., Paturel, G., Fouqué, P. 1991, Third Reference Catalogue of Bright Galaxies. (New York: Springer-Verlag) (RC3)
- Dressler (1980) Dressler, A. 1980, ApJ, 236, 351
- Dressler et al. (1997) Dressler, A., et al. 1997, ApJ490, 577
- Elmegreen & Hunter (2006) Elmegreen, B. G., & Hunter, D. A. 2006, ApJ, 636, 712
- Erwin et al. (2005) Erwin, P., Beckman, J. E., & Pohlen, M. 2005, ApJ, 626, L81
- Erwin et al. (2008) Erwin, P., Pohlen, M, & Beckman, J.E. 2008, AJ, 135, 20
- Erwin et al. (2012) Erwin, P., Pohlen, M, & Beckman, J.E. 2012, in prep
- Freeman (1970) Freeman, K. C. 1970, ApJ, 170, 811
- Giuricin et al. (2000) Giuricin, G., Marinoni, C., Ceriani, L., & Pisani, A. 2000, ApJ, 543, 178
- Gnedin (2003) Gnedin, O. Y. 2003, ApJ, 589, 752
- Gunn & Gott (1972) Gunn, J. E., & Gott, III, J. R. 1972, ApJ, 176, 1
- Gutiérrez et al. (2011) Gutiérrez, L., Erwin, P., Aladro, R., & Beckman, J. E. 2011, AJ, 142, 145
- Kennicutt (1989) Kennicutt, R. C. 1989, ApJ, 344, 685
- Larson et al. (1980) Larson, R. B., Tinsley, B. M., & Caldwell, C. N. 1980, ApJ, 237, 692
- Maltby et al. (2011) Maltby, D. T., et al. 2011, MNRAS, in press
- Martínez-Serrano et al. (2009) Martínez-Serrano, F. J., Serna, A., Doménech-Moral, M., & Domínguez-Tenreiro, R. 2009, ApJ, 705, L133
- Moore et al. (1996) Moore, B., Katz, N., Lake, G., Dressler, A., & Oemler, A. 1996, Nature, 379, 613
- Moore et al. (1999) Moore, B., Lake, G., Quinn, T., & Stadel, J. 1999, MNRAS, 304, 465
- Moran et al. (2007) Moran, S. M., Ellis, R. S., Treu, T., Smith, G. P., Rich, R. M., & Smail, I. 2007, ApJ, 671, 1503
- Pérez (2004) Pérez, I. 2004, ApJ, 427, L17
- Poggianti et al. (2008) Poggianti, B. M., et al. 2008, ApJ, 684, 888
- Pohlen & Trujillo (2006) Pohlen, M., & Trujillo, I. 2006, A&A, 454, 759
- Postman et al. (2005) Postman, M., et al. 2005, ApJ, 623, 721
- Sellwood & Binney (2002) Sellwood, J. A., & Binney, J. J. 200, MNRAS, 336, 785
- Roškar et al. (2008a) Roškar, R., Debattista, V. P., Stinson, G. S., Quinn, T. R., Kaufmann, T., & Wadsley, J. 2008a, ApJL, 675, L65.
- Roškar et al. (2008b) Roškar, R., Debattista, V. P., Quinn, T. R., Stinson, G. S., & Wadsley, J. 2008b, ApJ, 684, L79.
- Sánchez-Blázquez et al. (2009) Sánchez-Blázquez, P., Courty, S., Gibson, B. K., & Brook, C. B. 2009, MNRAS, 398, 591
- Schaye (2004) Schaye, J. 2004, ApJ, 609, 667
- Tonry et al. (2001) Tonry, J. L., et al. 2001, ApJ, 546, 681
- Trujillo & Pohlen (2005) Trujillo, I. & Pohlen, M. 2005, ApJ, 630, L17
- Tully (1987) Tully, R. B. 1987, ApJ, 321, 280
- Tully et al. (1996) Tully, R. B., Verheijen, M. A. W., Pierce, M. J., Huang, J.-S., & Wainscoat, R. J. 1996, AJ, 112, 2471
- van den Bergh (2009) van den Bergh, S. 2009, ApJ, 702, 1502
- Wilman & Erwin (2011) Wilman, D. J., & Erwin, P. 2011, ApJ, submitted
- Wilson (1927) Wilson, E. B. 1927, J. Amerc. Statist. Assoc., 22, 209
- York et al. (2000) York, D.G., et al. 2000, AJ, 120, 1579
- Zibetti et al. (2009) Zibetti, S., Charlot, S., & Rix, H.-W. 2009, MNRAS, 400, 1181
| Galaxy | Profile Type | ||||||
|---|---|---|---|---|---|---|---|
| () | () | () | |||||
| Virgo Cluster | |||||||
| NGC 4262 | III | 14.1 | 24.9 | 83 | 19.36 | 22.13 | 25.8 |
| NGC 4306 | III-d(?) | 11.3 | 19.3 | 27.0 | 19.69 | 20.75 | 22.2 |
| NGC 4377 | I | 11.3 | 90 | 18.79 | 26.8 | ||
| NGC 4379 | I | 17.5 | 120 | 19.98 | 27.0 | ||
| NGC 4468 | III-s(?) | 17.2 | 39.7 | 63 | 20.48 | 22.74 | 24.3 |
| NGC 4476 | III-s(?) | 16.1 | 24.6 | 50 | 19.96 | ||
| NGC 4479 | I | 23.2 | 119 | 21.72 | 27.2 | ||
| NGC 4483 | III-d | 12.6 | 20.4 | 55.0 | 19.10 | 20.89 | 23.7 |
| NGC 4528 | III-s | 7.4 | 29 | 17.60 | 21.7 | ||
| NGC 4598 | II.i + III-d | 13.6 | 54.0 | 19.76 | 24.0 | ||
| 13.6 | 21.7 | 54.0 | 19.76 | 21.38 | 24.0 | ||
| NGC 4620 | III-d | 15.7 | 22.9 | 57.5 | 20.19 | 21.43 | 24.1 |
| NGC 4733 | III | 16.8 | 23.0 | 59.0 | 19.62 | 20.63 | 23.3 |
| Field | |||||||
| NGC 3011 | II.o-OLR(?) | 11.0 | 4.3 | 21.0 | 20.76 | 17.43 | 22.9 |
| NGC 3156 | III-d(?) | 12.0 | 16.9 | 41 | 18.99 | 20.04 | 22.6 |
| NGC 3266 | II.o-OLR | 17.4 | 10.3 | 24.9 | 20.41 | 19.36 | 22.0 |
| NGC 3643 | III-d(?) | 11.6 | 17.3 | 43 | 19.76 | 22.12 | 24.9 |
| NGC 3757 | III-d(?) | 11.6 | 48.8 | 48.5 | 20.40 | 23.87 | 24.7 |
| NGC 3773 | I | 11.9 | 70 | 20.20 | 26.7 | ||
| NGC 3870 | III-d | 8.3 | 17.8 | 38 | 19.40 | 22.30 | 24.0 |
| NGC 4221 | II.o-OLR | 38.3 | 15.1 | 82 | 18.46 | 22.02 | 24.4 |
| NGC 4391 | II-CT(?) | 12.3 | 6.4 | 24 | 20.14 | 18.21 | 22.4 |
| NGC 5507 | III-s(?) | 10.9 | 35.4 | 65 | 18.70 | ||
| NGC 5631 | III-s(?) | 18.3 | 45 | 19.62 | |||
| NGC 5770 | I | 13.3 | 77 | 19.90 | 26.2 | ||
| NGC 5839 | I | 14.0 | 90 | 19.91 | 26.9 | ||
| IC 745 | III | 5.3 | 7.4 | 28 | 18.81 | 20.42 | 24.4 |
| IC 2450 | III-d | 10.3 | 12.3 | 34 | 19.66 | 20.15 | 23.3 |
| UGC 5745 | III-s(?) | 8.4 | 14.2 | 47 | 19.03 | ||
| UGC 9519 | III | 5.6 | 8.7 | 26 | 19.02 | 20.82 | 24.1 |
Note. — New classifications and measurements of -band outer-disk parameters for S0 galaxies not in Erwin et al. (2008) or Gutiérrez et al. (2011). For each galaxy, we list profile type, exponential scale lengths of inner and outer parts of the profile, break radius for Type II and III profiles, central surface brightnesses of fitted exponentials, and surface brightness at the break radius (see Erwin et al. for details). Surface brightnesses are observed values (uncorrected for Galactic extinction, inclination, or redshift). Type I profiles by definition have no “outer” part and only upper limits for and .