11email: Vardan.Adibekyan@astro.up.pt22institutetext: Departamento de Física e Astronomia, Faculdade de Ciências da Universidade do Porto, Portugal33institutetext: Instituto de Astrofísica de Canarias, 38200 La Laguna, Tenerife, Spain44institutetext: Departamento de Astrofísica, Universidade de La Laguna, 38205 La Laguna, Tenerife, Spain
A new -enhanced super-solar metallicity population
Abstract
Context. We performed a uniform and detailed analysis of 1112 high-resolution spectra of FGK dwarfs obtained with the HARPS spectrograph at the ESO 3.6 m telescope (La Silla, Chile). Most stars have effective temperatures 4700 K 6300 K and lie in the metallicity range of -1.39 [Fe/H] 0.55. Our main goal is to investigate whether there are any differences between the elemental abundance trends (especially [/Fe] ratio) for stars of different subpopulations. The equivalent widths of spectral lines are automatically measured from HARPS spectra with the ARES code. The abundances of three elements are determined using a differential LTE analysis relative to the Sun, with the 2010 revised version of the spectral synthesis code MOOG and a grid of Kurucz ATLAS9 atmospheres.The stars of our sample fall into two populations, clearly separated in terms of [/Fe] up to super-solar metallicities. In turn, high- stars are also separated into two families with a gap in both [/Fe] ( [/Fe] 0.17) and metallicity ([Fe/H] -0.2) distributions. The metal-poor high- stars (thick disk) and metal-rich high- stars are on average older than chemically defined thin disk stars (low- stars). The two -enhanced families have different kinematics and orbital parameters. The metal-rich -enhanced stars, such as thin disk stars have nearly circular orbits, close to the Galactic plane. We put forward the idea that these stars may have been formed in the inner Galactic disk, but their exact nature still remains to be clarified.
Aims.
Methods.
Results. Conclusions. stars: abundances – stars: kinematics and dynamics – Galaxy: disk
1 Introduction
The investigation of stellar populations is very important to understand the formation and evolution of our Galaxy. The Milky Way (MW) has a composite structure with several subsystems. The main three stellar populations of the MW in the solar neighborhood are the thin disk, thick disk, and the halo. These populations have different kinematic and chemical properties. The subdivision between the disk and halo was first identified since long ago, but the thick disk was discovered far more recently by Gilmore & Reid (Gilmore (1983)), who analysed the stellar density distribution as a function of distance from the Galactic plane.
There is no obvious predetermined way to identify purely thick or thin disk stars in the solar neighborhood. There are essentially three ways of distinguishing local thick and thin disk stars: a purely kinematical approach (e.g. Bensby et al. Bensby-03 (2003), Bensby-05 (2005); Reddy et al. Reddy (2006)), a purely chemical method (e.g. Navarro et al. Navarro (2011)), and by looking at a combination of kinematics, metallicities, and stellar ages (e.g. Fuhrmann Fuhrmann (1998); Haywood 2008a ).
The kinematic selection is a much more commonly applied method than the chemical approach, because it is much easier to measure the velocity of a star than to determine its chemical composition (particularly its -enhancement). However, the chemical distinction of the disks can be more useful and reliable, at least, because chemistry is a relatively more stable property of a star, that is intimately connected to the time and place of its birth, whereas spatial positions and kinematics are evolving properties.
During the past few years, there have been several studies directed to the detailed elemental abundance investigations of stars in different subpopulations. However, spectroscopic studies are in general limited to small samples of a few hundred stars at most (e.g. Feltzing & Gustafsson Feltzing & Gustafsson (1998); Bensby et al. Bensby-03 (2003, 2005, 2007); Soubiran et al. Soubiran05 (2005); Reddy et al. Reddy (2006); Ramírez et al. Ram=0000EDrez (2007)) and only a few studies have been based on samples as large as 1000 stars (e.g. Gazzano et al. Gazzano-10 (2010); Gazzano Gazzano-11 (2011); Petigura & Marcy Petigura-11 (2011)). To investigate [/Fe] abundances in the thin and thick disks with relatively large samples, some studies combine data from different sources (e.g. Navarro et al. Navarro (2011)). Alternatively, some other studies estimated the [/Fe] ratio from Strömgren indices (e.g. Casagrande et al. Casagrande (2011)). However, both methods are far less precise than those obtained with high-resolution spectroscopy, and prevent us from seeing any separation gap between the thin and thick disks. To minimize any type of external and internal “errors”, one needs to have as large and as homogeneous a sample as possible, with reliable measurements of their chemical and kinematic features.
In this Letter, we investigate the possible differences in the elemental abundance trends for stars of different subpopulations, using a stellar sample of 1112 long-lived dwarf stars. To separate and investigate the different Galactic stellar subsystems, we focus on the [/Fe] ratio (here “” refers to the average abundance of Mg, Si, and Ti). The extensive and full investigation of this sample, will be more focused on the abundance difference between stars with and without planets and be presented in an upcoming paper where we will also describe the observations, data reductions, and abundance analysis in detail.
2 The sample
The sample used in this work consists of 1112 FGK stars observed within the context of the HARPS GTO programs, hereafter called HARPS-1 (Mayor et al. Mayor (2003)), HARPS-2 (Lo Curto et al. Lo Curto (2010)), and HARPS-4 (Santos et al. Santos_11 (2011)). The stars are slowly-rotating, non-evolved, and in general have a low level of activity. The individual spectra of each star were reduced using the HARPS pipeline and then combined with IRAF111IRAF is distributed by National Optical Astronomy Observatories, operated by the Association of Universities for Research in Astronomy, Inc., under contract with the National Science Foundation, U.S.A. after correcting for its radial velocity. The final spectra have a resolution of R 110000 and signal-to-noise ratio (S/N) ranging from 20 to 2000, depending on the amount and quality of the original spectra. Fifty-five percent of the spectra have S/N higher than 200.
Precise stellar parameters for all the stars were determined in the same manner and by the same authors from the same spectra used in our study. For details, we refer to Sousa et al. (Sousa_08 (2008); 2011a ; 2011b ). The typical uncertainties in the atmospheric parameters are of the order of 30 K for , 0.06 dex for , and 0.03 dex for [Fe/H].
The stars in the sample have effective temperatures 4487 K 7212 K (there are only 12 stars with 6500 K) and metallicites -1.39 [Fe/H] 0.55 (only 11 stars with [Fe/H] -1 and three stars with [Fe/H] 0.4), and they have surface gravities 2.68 4.96 dex (again the number of “outliers” is very small, only 5 stars with 3.8 dex).
3 element abundance
Elemental abundances for three elements (Mg, Si, and Ti) were determined using a differential LTE analysis relative to the Sun (the reference abundances were taken from Anders & Grevesse (Anders-89 (1989))) with the 2010 revised version of the spectral synthesis code MOOG222http://www.as.utexas.edu/~chris/moog.html (Sneden Sneden (1973)) and a grid of Kurucz ATLAS9 atmospheres (Kurucz et al. Kurucz (1993)). The method and the atomic data are the same as in Neves et al. (Neves (2009)) (see also Adibekyan et al. Adibekyan (2011), in preparation). The equivalent widths (EW) were automatically measured with the ARES333http://www.astro.up.pt/sousasag/ares code (Automatic Routine for line Equivalent widths in stellar Spectra - Sousa et al. Sousa_07 (2007)). The input parameters for ARES were calculated following the procedure discussed in Sousa et al. (2011a ).
The total uncertainties in the abundances were evaluated as combinations of the line-to-line scatter errors and errors induced by uncertainties in the model atmosphere parameters.The line-to-line scatter errors were estimated as /, where is the standard deviation of N measurements. The abundances of the elements were determined using 16, 3, 24, and 6 lines for Si, Mg, TiI, and TiII, respectively. The average error in the [/Fe] ratio is 0.05 dex. We note that, in general, our derived abundances agree with the [/Fe] presented in the literature (see Neves et al. Neves (2009); Adibekyan et al. Adibekyan (2011), in preparation).
Studying the [/Fe] error distribution with stellar parameters, we observe no discernible trends except in the case of the where we found that for cooler stars ( 4900 K) the error increases, reaching about 0.1 dex for stars with 4500 K. We also observe a trend with for [TiI/Fe] ratio and we decided to establish a cutoff temperature - =4900 K (for details see Neves et al. Neves (2009)). The number of stars in the sample with 4900 K is 940.
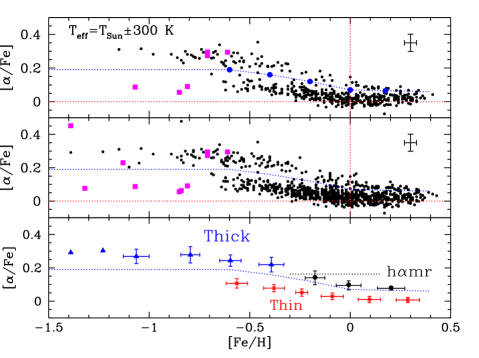

Fig. 1 shows [/Fe] versus [Fe/H] for all stars in the sample and for the stars with effective temperatures close to the Sun by 300 K (the number of these stars is 483). As can be seen, the stars are clearly separated into two groups according to the content of elements: the “high-” and the “low-” stars (thin disk444We emphasize that the traditional selection (and therefore definitions) of thin and thick disk stars was based on their kinematics.). This separation highlights the well-known enhancement of thick disk stars relative to the thin disk found for stars with [Fe/H] 0 (e.g. Fuhrmann Fuhrmann (1998); Bensby et al. Bensby-03 (2003, 2005)). The blue filled circles in Fig. 1 are the separation points between low- and high- stars. A separation into these two “populations” was performed based on [/Fe], for the stars with = 300 K. We divided the sample into five metallicity bins from [Fe/H] = -0.7 to 0.25 (see Fig. 2. for bin sizes) and identified the minima in the [/Fe] histograms for each bin. The separation curve in Fig. 1 is the simple connection of the above-mentioned separation points. In the metallicity region [Fe/H] -0.7, all the stars, except five halo stars, are -enhanced and lie above the [/Fe] = 0.19 line. A distinction between low- and high- stars in the supersolar metallicity region ([Fe/H] 0.25) was made using the extrapolation of the separation line constructed from the last two separation points. After subtracting the separation curve, we again compiled the separation histograms presented in Fig. 2. As one can see all the separation minimums are very close to [/Fe] = 0, which proves that the separation is clear.

It is interesting to see that high- stars are also divided into two subgroups: high- metal-rich stars (hereafter “hmr”), and high- metal-poor stars (thick disk). Fig. 3 shows the [Fe/H] and [/Fe] separation histograms for the -enhanced stars. In this figure, one can see that there is a gap between these two groups in terms of both the metallicity (Fe/H -0.2) and [/Fe] ([/Fe] 0.17 ). This gap (in [/Fe]) can also be seen in Reddy et al. (Reddy (2006)) (Fig. 20), although they differentiated between thin and thick disk stars using their kinematics.
On the basis of the above discussed histograms, we can define the metallicity ranges for each population. We find that for thick disk stars, metallicities vary from -1.4 to -0.2 dex. For thin disk stars, the metallicities range roughly from -0.7 to +0.4 dex. The hmr group stars lie in the metallicities range roughly from -0.2 to +0.3 dex. These values, in particular the upper limits to the thick disk and hmr, and the lower limits to the thin and hmr groups, may represent the metallicity boundaries of the different populations.
The magenta squares in Fig. 1 refer to stars belonging to halo (selected by their kinematics, see Section 4). As is clearly evident, halo stars can also be divided into two high- and low- groups. This dichotomy confirms the results provided in Nissen & Schuster (Nissen (2010)), where they present clear evidence of two distinct halo populations.
4 Kinematics
To study the kinematic relations and differences between the three above separated groups, we computed their Galactic velocities. The Galactic space velocity components (UVW) were derived with respect to the local standard of rest (LSR), adopting the standard solar motion (U⊙, V⊙, W⊙) = (10.00, 5.25, 7.17) km of Dehnen & Binney (Dehnen & Binney (1998)). The main source of the parallaxes and proper motions were the updated version of the Hipparcos catalog (van Leeuwen van Leeuwen (2007)) and the radial velocities obtained from the HARPS spectra. The parallaxes with errors larger than 10%, (which is true for less than 5% of the stars in the sample) were redetermined following the procedure described in Sousa et al. (2011a ). The number of stars with inaccurate proper motions (errors larger than 10%) is less than 8%. We did not perform a quality selection of them, because these errors in general do not change their memberships of a certain population. Combining the measurement errors in the parallaxes, proper motions, and radial velocities, the resulting average errors in the U, V, and W velocities are 2, 2.3, and 1.5 km s-1, respectively.
| Entire sample | = 300 K | ||||
|---|---|---|---|---|---|
| Bensby | Robin | Bensby | Robin | ||
| Thin | Thin | 699 | 742 | 353 | 376 |
| Thick | 17 | 5 | 13 | 4 | |
| Transition | 46 | 16 | 25 | 11 | |
| Thick | Thin | 22 | 33 | 13 | 20 |
| Thick | 54 | 42 | 33 | 27 | |
| Transition | 17 | 18 | 11 | 10 | |
| hmr | Thin | 61 | 64 | 25 | 26 |
| Thick | 10 | 3 | 5 | 3 | |
| Transition | 4 | 8 | 0 | 1 | |
We adopted the method of assigning the probability of each star to either the thin disk, the thick disk, or the halo described in Reddy et al. (Reddy (2006)). This assumes that the sample is a mixture of the three populations and each population follows a Gaussian distribution of random velocities in each component (Schwarzschild Schwarzschild (1907)). In this paper, we adopt the mean values (asymmetric drift) and dispersion in the Gaussian distribution, and the population fractions were taken from Bensby et al. (Bensby-03 (2003)) and Robin et al. (Robin (2005)). We consider that a probability in excess of 70% suffices to assign a star to the concrete population.
| Stellar groups | BASTI age | Padova age | Eccentricity | Zmax |
|---|---|---|---|---|
| Thin disk | 5.42.2 (555) | 4.82.0 (554) | 0.140.1 (549) | 0.250.25 (546) |
| Thin disk stars with = 300 K | 5.62.2 (313) | 4.91.9 (313) | 0.150.11 (314) | 0.270.29 (311) |
| Thick disk | 8.32.5 (84) | 8.12.6 (84) | 0.310.16 (75) | 1.011.31 (83) |
| Thick disk stars with = 300 K | 8.72.3 (56) | 8.52.4 (56) | 0.310.17 (51) | 1.171.5 (56) |
| hmr stars | 8.03.0 (45) | 7.12.7 (45) | 0.180.1 (45) | 0.320.34 (45) |
| hmr stars with = 300 K | 9.62.4 (24) | 8.42.2 (24) | 0.20.1 (26) | 0.330.41 (28) |
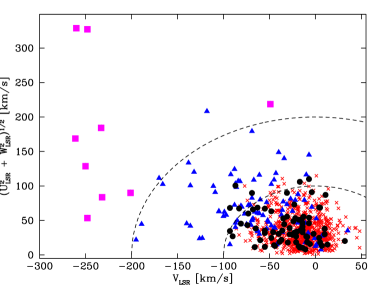
These kinematic separation criteria suggest that most of the stars in the hmr stellar family, such as chemically defined thin disk stars, have thin disk kinematics (see Table 1). The same impression is created by Fig. 4, where all the stars in this study (with 4900 K) are shown in a Toomre diagram. The chemically defined “thick” disk stars mainly have thick disk kinematics.
5 Discussion
The near constancy and the high level of -element abundances relative to Fe for the metal-poor thick disk stars ([Fe/H] -0.3) suggest that they formed in regions of high star formation rate where massive stars enriching the interstellar medium with -elements explode as core-collapse supernovae (SNe) (see, e.g. Ballero et al. 2007b). Many papers report the existence of the “knee” in [/Fe] trends for the thick disk stars (kinematically selected) when [Fe/H] reaches to -0.3 (see, e.g. Feltzing et al. Feltzing (2003); Bensby et al. Bensby-2007 (2007)). This downturn in [/Fe], up to solar metallicities (Bensby et al. Bensby-2007 (2007)), means that low- and intermediate-mass stars start to play a significant role in the chemical enrichment, through the explosions of SN Ia, which produce relatively little of the -elements. This downturn is seen in Fig 1. As already noted, however, there is a gap between metal-poor and metal-rich -enhanced stars, which casts doubt on the relation between the hmr and the thick disk stars.
To study the differences and/or the similarities of the Galactic orbital parameters and ages between two -enhanced groups, we cross-matched our sample with the Geneva-Copenhagen Survey (GCS) sample (Casagrande et al. Casagrande (2011)), which provides the eccentricities of the orbits, a maximum vertical distance (Zmax) a star can reach above the Galactic plane, and the ages of about 700 of our stars.
The mean ages of the three groups and their standard deviations are presented in Table 2. As can be seen from the table, the thick disk and hmr family stars have almost the same age, being on average older than thin disk stars by about 3 Gyr.
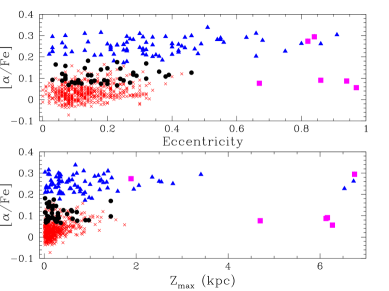
Our study of the orbital parameters has uncovered a different connection between the three groups. Most of the hmr stars, such as the thin disk stars, have nearly circular orbits, close to the Galactic plane. Unlike them, thick disk stars move in more eccentric orbits and have on average vertical distances three times larger than other two groups. The [/Fe] distributions as a function of eccentricities and Zmax are shown in Fig. 5. The mean values of the eccentricities and Zmax for the above separated three stellar families are presented in Table 2.
We can summarize the results obtained in this letter in the following way: our sample of stars, which consists of 1112 FGK long-lived dwarfs, can be clearly separated into two groups according to the content of elements. In turn, high- stars can also be divided into two families based on the gap between more -enhanced (thick disk) and less -enhanced (hmr) stars. Studying these three stellar families, we see that hmr stars have orbits similar to the thin disk stars, but that they are similar to thick disk stars in terms of age.This unusual results for metal-rich stars assigned to both the thin and thick disks (by their kinematics) was found previously in Soubiran et al. (Soubiran05 (2005)).
In the past couple of years, many studies have focused on the abundance determination of the bulge and inner disk stars (Fulbright et al. Fulbright-05 (2005, 2007); Meléndez et al. Mel=0000E9ndez (2008); Alves-Brito et al. Alves-Brito (2010); Epstein et al. Epstein (2010); Bensby et al. 2010a ; b ; 2011a ; b ). The abundance studies for the bulge dwarfs at sub-solar metallicities show excellent agreement with the abundance patterns in the local thick disk (Meléndez et al. Mel=0000E9ndez (2008); Alves-Brito et al. Alves-Brito (2010); Bensby et al. 2010b ). This suggests that these two populations have comparable chemical histories. It is also intriguing that at super-solar metallicities bulge stars seems to be more -enhanced than local thin disk stars (Fulbright et al. Fulbright-05 (2005, 2007), see Fig. 10 in Bensby et al. 2010b and Fig. 10 in Alves-Brito et al. Alves-Brito (2010)). Taking into account that the high- metal-rich stars of our sample are on average as old as bulge stars, and adding to this the aforementioned similarities between the different populations, we can see a link between the hmr stars and stars in the inner disk. Stellar radial migration could give an explanation of this link (e.g. Haywood 2008b ; Schönrich & Binney 2009a ). It has been proposed that metal-rich stars found in the solar vicinity may have been formed in the inner Galactic disk regions (e.g. Grenon Grenon-99 (1999); Ecuvillon et al. Ecuvillon-07 (2007); Famaey et al. Famaey-07 (2007); Santos et al. Santos-08 (2008); Schönrich & Binney 2009b ).
Nevertheless, the origin and nature of these stars remains unclear and needs to be clarified. Although the present observations suggest that hmr stars (high-alpha, metal rich) may have originated from the inner disk (e.g. inner thick-disk members), they do not allow us to exclude the possibility that they represent a whole new Galactic population. More observations are needed to resolve this uncertainty.
Acknowledgements.
V.Zh.A. and S.G.S. acknowledge the support from the Fundação para a Ciência e Tecnologia (FCT) in the form of a grants SFRH/BPD/70574/2010 and SFRH/BPD/47611/2008, respectively. N.C.S. acknowledges the support of the European Research Council/European Community under the FP7 through a Starting Grant, as well as the support from (FCT), Portugal, through program Ciência 2007. We also acknowledge support from FCT in the form of grant reference PTDC/CTE-AST/098528/2008.References
- (1) Adibekyan, V. Zh., et al. 2011, in preparation
- (2) Anders, E., & Grevesse, N. 1989, Geochim. Cosmochim. Acta, 53, 197
- (3) Alves-Brito, A., Meléndez, J., Asplund, M., et al. 2010, A&A, 513, A35
- (4) Bensby, T., Feltzing, S., & Lundström, I. 2003, A&A, 410, 527
- (5) Bensby, T., Feltzing, S., Lundström, I., & Ilyin, I. 2005, A&A, 433, 185
- (6) Bensby, T., Zenn, A. R., Oey, M. S., & Feltzing, S. 2007, ApJ, 663, L13
- (7) Bensby, T., Alves-Brito, A., Oey, M. S., et al. 2010a, A&A, 516, L13
- (8) Bensby, T., Feltzing, S., Johnson J.A., et al. 2010b, A&A, 512, A41
- (9) Bensby, T., Alves-Brito, A., Oey, M. S., et al. 2011, ApJ, 735, L46
- (10) Bensby, T., et al. 2011, arXiv:1107.5606
- (11) Casagrande, L., Schönrich, R., Asplund, M., et al. 2011, A&A, 530, A138
- (12) Dehnen, W., & Binney, J. J. 1998, MNRAS, 298, 387
- (13) Epstein, C. R., Johnson, J. A., Dong, S., et al. 2010, ApJ, 709, 447
- (14) Ecuvillon, A., Israelian, G., Pont, F., Santos, N. C., & Mayor, M. 2007, A&A, 461, 171
- (15) Famaey, B., Pont, F., Luri, X., et al. 2007, A&A, 461, 957
- (16) Feltzing, S., Bensby, T., & Lundström, I. 2003, A&A, 397, L1
- (17) Feltzing, S., & Gustafsson, B. 1998, A&AS, 129, 237
- (18) Fuhrmann, K. 1998, A&A, 338, 161
- (19) Fulbright, J. P., Rich, R. M., & McWilliam, A. 2005, Nucl. Phys. A, 758, 197
- (20) Fulbright, J. P., McWilliam, A., & Rich, R. M. 2007, ApJ, 661, 1152
- (21) Gazzano, J., de Laverny, P., Deleuil, M., et al. 2010, A&A, 523, A91
- (22) Gazzano, J., PhD thesis, 2011, Marseille
- (23) Gilmore, G. & Reid, N. 1983, MNRAS, 202, 1025
- (24) Grenon, M. 1999, Ap&SS, 265, 331
- (25) Haywood, M. 2008a, A&A, 482, 673
- (26) Haywood, M. 2008b, MNRAS, 388, 1175
- (27) Kurucz, R. 1993, ATLAS9 Stellar Atmosphere Programs and 2 km/s grid. Kurucz CD-ROM No. 13. Cambridge, Mass.: Smithsonian Astrophysical Observatory, 1993., 13
- (28) Lo Curto, G., Mayor, M., Benz, W., et al. 2010, A&A, 512, A48
- (29) Mayor, M., Pepe, F., Queloz, D., et al. 2003, The Messenger, 114, 20
- (30) Mayor, M., Marmier, M., Lovis, C., et al. 2011, ArXiv e-prints
- (31) Meléndez, J., Asplund, M., Alves-Brito, A., et al. 2008, A&A, 484, L21
- (32) Navarro, J. F., Abadi, M. G., Venn, K. A., et al. 2011, MNRAS, 412, 1203
- (33) Neves, V., Santos, N. C., Sousa, S. G., et al. 2009, A&A, 497, 563
- (34) Nissen, P. E., & Schuster, W. J. 2010, A&A, 511, L10
- (35) Petigura, E. A. & Marcy, G. W. 2011, ApJ, 735, 41
- (36) Ramírez, I., Allende Prieto, C., & Lambert, D. L. 2007, A&A, 465, 271
- (37) Reddy, B. E., Lambert, D. L., & Allende Prieto, C. 2006, MNRAS, 367, 1329
- (38) Robin A. C., Reylé C., Derrière S., Picaud S., 2003, A&A, 409, 523
- (39) Santos, N. C., Melo, C., James, D.J., et al. 2008, A&A, 480, 889
- (40) Santos, N. C., Mayor, M., Bonfils, X., et al. 2011, A&A, 526, 112
- (41) Schwarzschild K., 1907, Göttingen Nachr., 614
- (42) Schönrich, R., & Binney, J., 2009a, MNRAS, 396, 203
- (43) Schönrich, R., & Binney, J., 2009b, MNRAS, 399, 1145
- (44) Soubiran, C., & Girard, P., 2005, A&A, 438, 139
- (45) Sousa, S. G., Santos, N. C., Israelian, G., et al. 2007, A&A, 469, 783
- (46) Sousa, S. G., Santos, N. C., Mayor, M., et al. 2008, A&A, 487, 37
- (47) Sousa, S. G., Santos, N. C., Israelian, G., et al. 2011a, A&A, 526, 99
- (48) Sousa, S. G., Santos, N. C., Israelian, G., et al. 2011b, A&A, 533, 141
- (49) Sneden, C. 1973, Ph.D. Thesis, Univ. of Texas
- (50) van Leeuwen, F. 2007, A&A, 474, 653