THE CARNEGIE-IRVINE GALAXY SURVEY. II. ISOPHOTAL ANALYSIS
Abstract
The Carnegie-Irvine Galaxy Survey (CGS) is a comprehensive investigation of the physical properties of a complete, representative sample of 605 bright ( mag) galaxies in the southern hemisphere. This contribution describes the isophotal analysis of the broadband (BVRI) optical imaging component of the project. We pay close attention to sky subtraction, which is particularly challenging for some of the large galaxies in our sample. Extensive crosschecks with internal and external data confirm that our calibration and sky subtraction techniques are robust with respect to the quoted measurement uncertainties. We present a uniform catalog of one-dimensional radial profiles of surface brightness and geometric parameters, as well as integrated colors and color gradients. Composite profiles highlight the tremendous diversity of brightness distributions found in disk galaxies and their dependence on Hubble type. A significant fraction of S0 and spiral galaxies exhibit non-exponential profiles in their outer regions. We perform Fourier decomposition of the isophotes to quantify non-axisymmetric deviations in the light distribution. We use the geometric parameters, in conjunction with the amplitude and phase of the Fourier mode, to identify bars and quantify their size and strength. Spiral arm strengths are characterized using the Fourier profiles and structure maps. Finally, we utilize the information encoded in the Fourier profiles to measure disk lopsidedness. The databases assembled here and in Paper I lay the foundation for forthcoming scientific applications of CGS.
1 Introduction
This paper, the second in a series, presents the isophotal analysis for the optical images of the Carnegie-Irvine Galaxy Survey (CGS), a detailed study of a statistically complete sample of nearby, bright galaxies in the southern sky (Ho et al. 2011, hereinafter Paper I). The immediate aim of this paper is to reduce our extensive set of images to a uniform database of one-dimensional (1-D) radial profiles of surface brightness and geometric parameters, on which much of our subsequent scientific analysis will depend. Although we intend to apply more sophisticated methods of analysis to the images (Peng et al. 2010; S. Huang et al. 2011, in preparation), the 1-D analysis already contains a wealth of useful information that can be exploited for science. Moreover, 1-D analysis has the virtue of simplicity. It can be efficiently applied to a large sample of objects, allowing a quick overview of the global properties of the survey.
The brightness profiles of galaxies have long helped to guide our understanding of their physical nature. Despite the visual complexity of their images, the 1-D radial brightness profiles of galaxies in the nearby universe actually show a surprising degree of order. De Vaucouleurs (1948) first noticed that the light distributions of elliptical galaxies generally follow a profile, which has been interpreted as a signature of dissipationless formation processes (vanalbada82; katz91). Later studies, beginning with caon93, increasingly recognized that many ellipticals, in fact, do not strictly follow the law, but instead are better described by the more general function of sers68, of which de Vaucouleurs’ law is a special case (). Indeed, the Sérsic function has since been generally adopted as the standard formula for fitting the brightness profiles of ellipticals (e.g., grah96; truj01; korm09). Our modern view of bulges has also grown steadily more complex over time. Once thought to be mini-ellipticals with profiles, bulges, too, are now known to be better described by a Sérsic function (ansa94; andr95; dejo96; cour96; maca03). The Sérsic indices of bulges have a broad distribution of observed values, from to (e.g., maca03; fidr08; gadotti08), and it is argued that they reflect different formation physics. Spheroids with 2 are regarded as pseudobulges (fidr08), which formed through internal, secular processes, while those with 2 are classical bulges, which, like the ellipticals, were assembled more rapidly, most likely with the assistance of mergers (koke04).
The brightness profiles of the disks of S0 and spiral galaxies have been traditionally described by a single exponential function (deva59; free70), which arises as a natural consequence of viscous transport in a disk (yoso89; zhwy00; fecl01; slyz02), perhaps mediated by star formation and feedback processes (robe04; gove07). In actuality, very few disks are so simple. Many possess breaks and inflections in their outer radial profile (vand79; vase81; maga97; pohl00; degr01; erwi05; erbp05; potr06). No general consensus yet exists as to their cause, but they offer
important clues to a host of physical processes pertinent to galaxy formation (vanderkruitfreeman11).
Apart from intensity profiles, isophotal analysis of galaxy images yields other useful diagnostics. The radial variation of the ellipticity and position angle, for example, provides an efficient means to identify bars and to quantify their length and strength (e.g., lain02; erwi05; mene07). Fourier decomposition of the isophotes provides yet another method to probe non-axisymmetric perturbations in the light distribution. The relative amplitude of the mode, in combination with its phase angle, has been shown to be effective in isolating bars (elmegreen85; buta86; ohta90) and spirals (elmegreen89; rixzar95; odewahn02). Both of these features are common constituents in disk galaxies, and both are thought to play a dynamical role in facilitating angular momentum transport and driving secular evolution. Likewise, a significant fraction of disk galaxies exhibits global lopsidedness in their stellar light distribution (rixzar95; zari97; bour05; reic08), whose main culprit remains in dispute (joco08). As shown by rixzar95, this type of non-axisymmetric perturbation is again conveniently revealed through Fourier analysis of the isophotes, in this case through the mode.
This paper is organized as follows. Section 2 gives a brief overview of the CGS sample, the observations, and some basic characteristics of the images. Section 3 describes our method of sky subtraction. The procedural details of isophotal analysis are presented in Section 4, including our method for extracting geometric parameters, surface brightness profiles, and Fourier components. We generate composite light distributions (Section 5) to identify statistical trends in disk profiles, and assemble integrated colors and color gradients (Section 6). The products from the isophotal and Fourier analysis are used to quantify the strengths of bars (Section 7), spiral arms (Section 8), and lopsidedness (Section 9). Section 10 assesses the reliability of our measurements using internal and external tests. Section 11 gives a brief summary and an outline of future plans. The database of isophotal parameters is described in the Appendix.
2 Sample Properties
The CGS covers a statistically complete sample of 605 bright, nearby galaxies of all morphological types in the southern hemisphere, with -band total magnitude and . These very general selection criteria enable us to probe galaxies with a broad range of physical properties and morphologies. The primary parent sample111As described in Paper I, we observed an additional 11 galaxies that do not formally meet the selection criteria of CGS. We still analyze them here but will not use their results to draw statistical inferences on the sample. comprises 17% ellipticals, 18% S0 and S0/a, 64% spirals, and 1% irregulars. The bulk of the sample is relatively nearby (median = 24.9 Mpc), luminous (median mag), and well resolved. The typical seeing of CGS is , and the sample has a median isophotal angular diameter of = 33 at a surface brightness level of mag arcsec.
Paper I describes the observing strategy, data reductions, and photometric calibration of the optical imaging component of the project. We only repeat a few essential details here. The broadband BVRI images have a field-of-view of 8989 and a pixel scale of 0259, which is well matched to the good seeing typically achieved with the du Pont 2.5-m telescope at Las Campanas Observatory. The median seeing of the survey, as determined from over 6000 science images, is 117, 111, 101, and 096 in the , , , and band, respectively. A little more than half of the galaxies were observed under photometric conditions, with median photometric errors of 0.08, 0.04, 0.03, and
0.04 mag for the B, V, R and filters, respectively. We devised a calibration strategy to establish an approximate photometric zero point for the non-photometric observations, for which the corresponding photometric errors are 0.21, 0.11, 0.10, and 0.09 mag. After correcting for large-scale gradients in the background, the flatness of the final images is about 0.6%, and the typical depth of the surface brightness, defined as above the background, has a median value of and 25.3 in the and bands, respectively.
We derived a number of data products from the reduced, calibrated images. These include red–green–blue color composites generated from the , , and bands, images cleaned of foreground stars and background galaxies, a stacked image from a weighted combination of the four filters optimized to enhance regions of low surface brightness, structure maps designed to accentuate high-spatial frequency features, and color index maps from different combinations of the filters.
3 Sky Determination
Sky determination is a crucial, fundamental step in the data analysis. Many of the basic galaxy parameters we are interested in measuring (magnitudes, colors, characteristic size and brightness level, etc.) are predicated on having the sky level properly subtracted. Importantly, under-subtraction or over-subtraction of the sky value can introduce spurious curvature into the brightness profile, especially in the faint, outer regions of the galaxy (e.g., erwi08). maca03 studied the influence of the sky value on the bulge and disk parameters for a sample of spirals, and concluded that the disk, but to a lesser extent even the bulge, parameters are sensitive to the sky value.
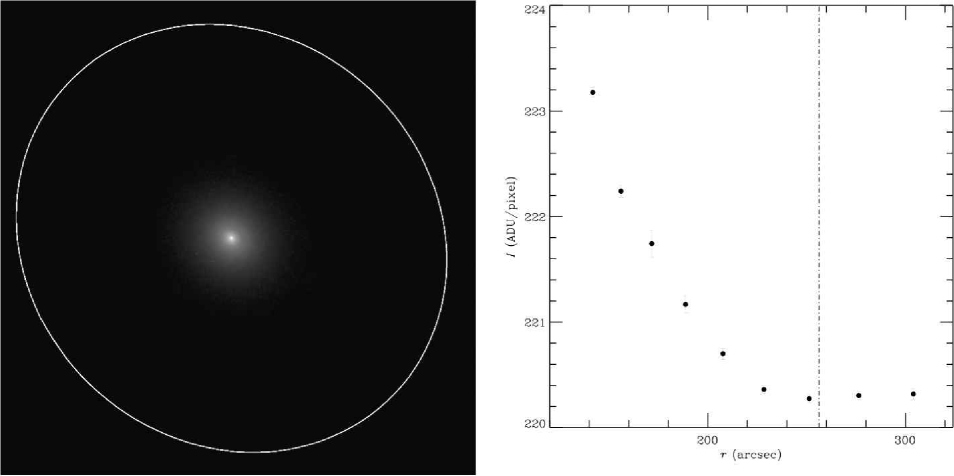
There are a variety of ways to measure the sky value of a CCD image. Science data such as ours, however, wherein an extended object fills a substantial portion of the chip, pose unique challenges. This is especially so because the background of our images is not always entirely uniform (Paper I). We adopt a two-step approach. As in noovan07, we generate the isophotal intensity radial profile of the galaxy to the edge of the field to determine the radius beyond which the sky background dominates the signal. As illustrated in Figure 1, the transition from the galaxy’s outer boundary to the sky-dominated region manifests itself as flattening of the radial profile, beyond which it oscillates about a constant intensity level. To be specific, we define the outer radius to be the first data point where the measured isophotal intensity rises instead of decreases monotonically. Typically the outer radius is large enough to avoid the spiral arms or other features that may cause a real rise in the outer brightness profile. In the standard procedure of noovan07, the average value of this isophotal intensity outside the outer radius and the associated standard deviation gives estimates of the sky level and its uncertainty. However, this technique is reliable only if the background is uniform and well measured (erwi08). The field-of-view of our images is typically only a factor of 2 larger than the galaxies, generally too marginal to provide enough data points in the sky-dominated region to yield a statistically robust measurement of the background and its error. The situation is further exacerbated by the occasional presence of residual large-scale non-uniformities in the background. In view of these complications, we use Noordermeer & van der Hulst’s method only to determine the radius of the sky-dominated region (Figure 1), which we record in the image header under the keyword SKY_RAD.
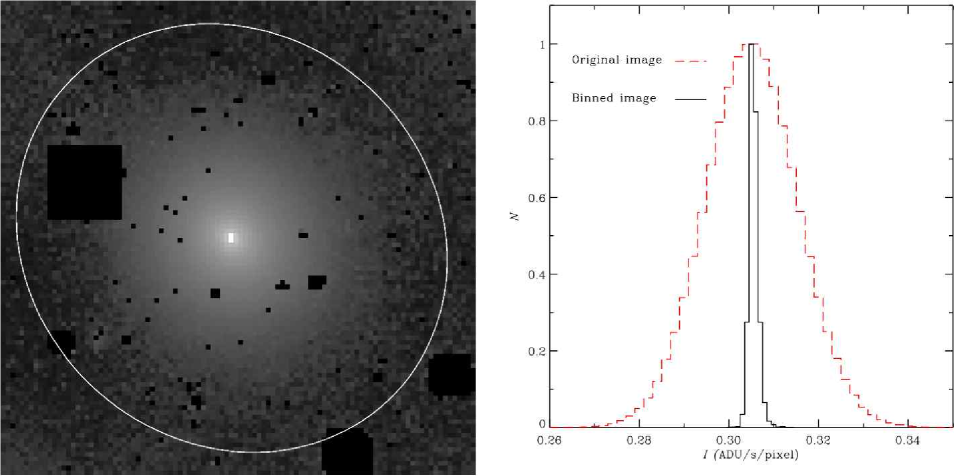
To estimate the actual sky value and its associated error, we follow a method similar to that used by erwi08. We first smooth the original pixel image by binning it down to a pixel image. This highlights underlying large-scale, systematic fluctuations in the background, which is the main factor that ultimately limits the accuracy with which
![[Uncaptioned image]](/html/1111.4606/assets/x3.png)
Empirical relationship between sky/sky and , for each of the four filters. For 1.3, as indicated by the best-fitted red solid lines with slopes close to 0, but when 1.3, is systematically larger than . The green solid lines represent the best-fit linear relations given by Equations (1)–(4). (A color version of this figure is available in the online journal.)