Characterizing Lenses and Lensed Stars of High-Magnification Single-lens Gravitational Microlensing Events With Lenses Passing Over Source Stars
Abstract
We present the analysis of the light curves of 9 high-magnification single-lens gravitational microlensing events with lenses passing over source stars, including OGLE-2004-BLG-254, MOA-2007-BLG-176, MOA-2007-BLG-233/OGLE-2007-BLG-302, MOA-2009-BLG-174, MOA-2010-BLG-436, MOA-2011-BLG-093, MOA-2011-BLG-274, OGLE-2011-BLG-0990/MOA-2011-BLG-300, and OGLE-2011-BLG-1101/MOA-2011-BLG-325. For all events, we measure the linear limb-darkening coefficients of the surface brightness profile of source stars by measuring the deviation of the light curves near the peak affected by the finite-source effect. For 7 events, we measure the Einstein radii and the lens-source relative proper motions. Among them, 5 events are found to have Einstein radii less than 0.2 mas, making the lenses candidates of very low-mass stars or brown dwarfs. For MOA-2011-BLG-274, especially, the small Einstein radius of mas combined with the short time scale of days suggests the possibility that the lens is a free-floating planet. For MOA-2009-BLG-174, we measure the lens parallax and thus uniquely determine the physical parameters of the lens. We also find that the measured lens mass of is consistent with that of a star blended with the source, suggesting that the blend is likely to be the lens. Although we find planetary signals for none of events, we provide exclusion diagrams showing the confidence levels excluding the existence of a planet as a function of the separation and mass ratio.
Subject headings:
gravitational lensing: micro – Galaxy: bulge1. Introduction
When an astronomical object (lens) is closely aligned with a background star (source), the light from the source is deflected by the gravity of the lens, resulting in brightening of the source star. The magnification of the source flux is related to the projected lens-source separation by
| (1) |
where the separation is expressed in units of the angular Einstein radius . The Einstein radius is related to the physical parameters of the lens system by
| (2) |
where mas , is the mass of the lens, is the relative source-lens parallax, and and are the distances to the lens and source star, respectively. The relative motion between the source, lens, and observer leads to light variation of the source star (lensing event). The first microlensing events were detected by Alcock et al. (1993) and Udalski et al. (1993) from the experiments conducted based on the proposal of Paczyński (1986). With the development of observational strategy combined with upgraded instrument, the detection rate of lensing events has been dramatically increased from several dozen events per year during the early phase of lensing experiments to more than a thousand events per year in current experiments.
The magnification of source star flux increases as the lens approaches closer to the source star. For a small fraction of events, the lens-source separation is even smaller than the source radius and the lens passes over the surface of the source star. These events are of scientific importance due to various reasons.
First, a high-magnification event with a lens passing over a source star provides a rare chance to measure the brightness profile of a remote star. For such an event, in which the lens-source separation is comparable to the source size near the peak of the event, different parts of the source star are magnified by different amounts. The resulting lensing light curve deviates from the standard form of a point-source event (Witt & Mao, 1994; Gould, 1994; Nemiroff & Wickramasinghe, 1994; Alcock et al., 1997) and the analysis of the deviation enables to measure the limb-darkening profile of the lensed star (Witt, 1995; Loeb & Sasselov, 1995; Valls-Gabaud, 1998; Bryce et al., 2002; Heyrovský, 2003). With the same principle, it is also possible to study irregular surface structures such as spots (Heyrovský & Sasselov, 2000; Han et al., 2000; Hendry et al., 2002; Rattenbury et al., 2002).
| event | reference |
|---|---|
| OGLE-2004-BLG-254 | Cassan et al. (2006) / this work |
| OGLE-2004-BLG-482 | Zub et al. (2011) |
| MOA-2006-BLG-130/OGLE-2006-BLG-437 | Baudry et al. (2011) / under analysis |
| OGLE-2007-BLG-050/MOA-2007-BLG-103 | Batista et al. (2009) |
| MOA-2007-BLG-176 | this work |
| OGLE-2007-BLG-224/MOA-2007-BLG-163 | Gould et al. (2009) |
| MOA-2007-BLG-233/OGLE-2007-BLG-302 | this work |
| OGLE-2008-BLG-279/MOA-2008-BLG-225 | Yee et al. (2009) |
| OGLE-2008-BLG-290/MOA-2008-BLG-241 | Fouque et al. (2010) |
| MOA-2009-BLG-174 | this work |
| MOA-2009-BLG-411 | Fouque et al. (2011) / under analysis |
| MOA-2010-BLG-311 | Hung et al. (2011) / under analysis |
| MOA-2010-BLG-436 | this work |
| MOA-2010-BLG-523 | Gould et al. (2011) / under analysis |
| MOA-2011-BLG-093 | this work |
| MOA-2011-BLG-274 | this work |
| OGLE-2011-BLG-0990/MOA-2011-BLG-300 | this work |
| OGLE-2011-BLG-1101/MOA-2011-BLG-325 | this work |
Second, it is possible to measure the Einstein radius of the lens and the relative lens-source proper motion. The light curve at the moment of the entrance (exit) of the lens into (from) the source surface exhibits inflection of the curvature. The duration of the passage over the source as measured by the interval between the entrance and exit of the lens over the surface of the source star is
| (3) |
where is the source radius in units of (normalized source radius), is the lens-source separation normalized by at the moment of the closest approach (impact parameter), and is the time scale for the lens to transit (Einstein time scale). The impact parameter and the Einstein time scale are measured from the overall shape of the light curve and the duration of the event. With the known and combined with the measured duration of passage over the source, the normalized source radius is measured from the relation (3). With the additional information about the angular source size, , then the Einstein radius and the lens-source proper motion are measured as and , respectively. For general lensing events, the Einstein time scale is the only measurable quantity related to the physical parameters of the lens. However, the time scale results from the combination of 3 physical parameters of the mass of the lens, , the distance to the lens, , and the lens-source transverse speed, , and thus the information about the lens is highly degenerate. The Einstein radius, on the other hand, does not depend on and thus the physical parameters of the lens can be better constrained. For a fraction of events with long time scales, it is possible to additionally measure the lens parallax, , from the deviation of the light curve induced by the orbital motion of the Earth around the Sun. With the Einstein radius and the lens parallax measured, the physical parameters of the lens are uniquely determined (Gould, 1997).
Third, high-magnification events are sensitive to planetary companions of lenses. This is because a planet induces a small caustic near the primary lens and a high-magnification event resulting from the source trajectory passing close to the primary has a high chance to produce signals indicating the existence of the planet (Griest & Safizadeh, 1998). For an event with a lens passing over a source star, the planetary signal is weakened by the finite-source effect (Bennett & Rhie, 1996). Nevertheless, two of the microlensing planets were discovered through this channel: MOA-2007-BLG-400 (Dong et al., 2009) and MOA-2008-BLG-310 (Janczak et al., 2010).
Fourth, high-magnification events provide a chance to spectroscopically study remote Galactic bulge stars. Most stars in the Galactic bulge are too faint for spectroscopic observations even with large telescopes. However, enhanced brightness of lensed stars of high-magnification events allows spectroscopic observation possible, enabling population study of Galactic bulge stars (Johnson et al., 2008; Bensby et al., 2009, 2011; Cohen et al., 2009; Epstein et al., 2010).
In this work, we present integrated results of analysis for 14 high-magnification events with lenses passing over source stars that have been detected since 2004. Among them, 8 events were newly analyzed and one event was reanalyzed with additional data.
| event | MOA | OGLE | FUN | PLANET | RoboNet |
|---|---|---|---|---|---|
| (RA,DEC)J2000 | /MiNDSTEp | ||||
| OGLE-2004-BLG-254 | (39/5) | (74) | |||
| (,) | (377) | (129) | (59) | ||
| (112) | |||||
| MOA-2007-BLG-176 | (68) | (26) | (2) | ||
| (,) | (1388) | (41/4) | (4) | ||
| (33) | |||||
| (66) | |||||
| (129) | |||||
| MOA-2007-BLG-233 | (80/5) | (60/5) | (125) | ||
| /OGLE-2007-BLG-302 | (645) | (628) | (23) | (23) | |
| (,) | (19) | (80) | |||
| (80) | |||||
| MOA-2009-BLG-174 | (147) | (40) | (7) | ||
| (,) | (2189) | (111) | |||
| (130) | |||||
| (286/7) | |||||
| (90) | |||||
| (60) | |||||
| MOA-2010-BLG-436 | (14/3) | (3) | |||
| (,) | (2581) | ||||
| MOA-2011-BLG-093 | (76/21) | (254) | (3) | ||
| (,) | (2247) | (292) | (124) | (19) | |
| MOA-2011-BLG-274 | (53) | ||||
| (,) | (3447) | (76) | (4) | ||
| (16) | |||||
| (49) | |||||
| (15) | |||||
| OGLE-2011-BLG-0990 | (275) | (10) | |||
| /MOA-2011-BLG-300 | (1708) | (3434) | (23) | (95/6) | |
| (,) | |||||
| OGLE-2011-BLG-1101 | (60) | (98) | (65) | ||
| /MOA-2011-BLG-325 | (609) | (192) | (126/12) | (145) | |
| (,) | (24) | (27) | |||
| (107) | |||||
| (113) |
Note. — Mt. John: Mt. John Observatory, New Zealand; LCO: Las Campanas Observatory, Chile; Auckland: Auckland Observatory, New Zealand; Bronberg: Bronberg Observatory, South Africa; CAO: CAO San Pedro Observatory, Chile; Cragie: Craigie Observatory, Australia; CTIO: Cerro Tololo Inter-American Observatory, Chile; FCO: Farm Cove Observatory, New Zealand; Kumeu: Kumeu Observatory, New Zealand; Lemmon: Mt Lemmon Observatory, Arizona, USA; OPD: Observatorio do Pico dos Dias, Brazil; PEST: Perth Exoplanet Survey Telescope, Australia; Possum: Possum Observatory, New Zealand; SSO: Southern Stars Observatory, French Polynesia; VLO: Vintage Lane Observatory, New Zealand; Boyden: Boyden Observatory, South Africa; Canopus: Canopus Hill Observatory, Tasmania, Australia; Perth: Perth Observatory, Australia; SAAO: South African Astronomical Observatory, South Africa; Steward: Steward Observatory, Arizona, USA; FTN: Faulkes North, Hawaii; FTS: Faulkes South, Australia; LT: Liverpool Telescope, La Palma, Spain; Danish: Danish Telescope, European Southern Observatory, La Silla, Chile. The subscription after each observatory represents the filter used for observation and the value in parenthesis is the number of data points. The filter “N” denotes that no filter is used.
2. Event Selection
The sample of events in our analysis is selected under the definition of a single-lens event where the lens-source separation at the time of the peak magnification is less than the radius of the source star, i.e. and thus the lens passes over the surface of the source star. To obtain a sample of events, we begin with searching for high-magnification events that have been detected since 2004. Events with lenses passing over source stars can be usually distinguished by the characteristic features of their light curves near the peak. These features are the inflection of the curvature at the moment when the finite source first touches and completely leaves the lens and the round shape of the light curve during the passage of the lens over the source. To be more objective than visual inspection, we conduct modeling of all high-magnification events with peak magnifications to judge the qualification of events. From these searches, we find that there exist 18 such events. Among them, analysis results of 12 events were not published before. We learn that 4 unpublished events MOA-2006-BLG-130/OGLE-2006-BLG-437 (Baudry et al., 2011), MOA-2009-BLG-411 (Fouque et al., 2011), MOA-2010-BLG-523 (Gould et al., 2011), and MOA-2010-BLG-311 (Hung et al., 2011) are under analysis by other researchers and thus exclude them in our analysis. We note that there exist 4 known source-crossing events detected before 2004, including MACHO Alert 95-30 (Alcock et al., 1997), OGLE sc26_2218 (Smith et al., 2003), OGLE-2003-BLG-238 (Jiang et al., 2004), and OGLE-2003-BLG-262 (Yoo et al., 2004). We also note that MOA-2007-BLG-400 (Dong et al., 2009) and MOA-2008-BLG-310 (Janczak et al., 2010) exhibit characteristic features of source-crossing single-lens events but we exclude them in the sample because the lenses of the events turned out to have planetary companions.
In this work, we conduct analyses of 9 events. Among them, 8 events are newly analyzed in this work. These events include MOA-2007-BLG-176, MOA-2007-BLG-233/OGLE-2007-BLG-302, MOA-2009-BLG-174, MOA-2010-BLG-436, MOA-2011-BLG-093, MOA-2011-BLG-274, OGLE-2011-BLG-0990/MOA-2011-BLG-300, and OGLE-2011-BLG-1101/MOA-BLG-2011-325. For OGLE-2004-BLG-254, which was analyzed before by Cassan et al. (2006), we conduct additional analysis by adding more data sets taken from CTIO and FCO. 111Besides the data sets listed in Table 2, there exists an additional data set taken by using the Danish telescope. However, we do not use these data because it has been shown by Heyrovský (2008) that the large scatter of the data results in poor measurement of lensing parameters including the limb-darkening coefficient. In Table 1, we summarize the status of analysis for the total 18 events that have been detected since 2004.
3. Observation
For almost all events analyzed in this work, the source-crossing part of the light curve was densely covered. This was possible due to the coordinated work of survey and follow-up observations. Survey groups issued alerts of events. For a fraction of the events with high-magnifications, additional alerts were issued. In other cases, follow-up teams issued high-magnification alerts independently. The peak time of a high-magnification event was predicted by real-time modeling based on the rising part of the light curve. Finally, the peak was densely covered by many telescopes that were prepared for follow-up observations at the predicted time of the peak. For MOA-2010-BLG-436, the rising part of the light curve was not covered by survey observations due to the short time scale of the event and thus no alert was issued. Nevertheless, the event was positioned in a high frequency field of the MOA survey and thus the peak was covered densely enough to be confirmed as an event with the lens passing over the source.
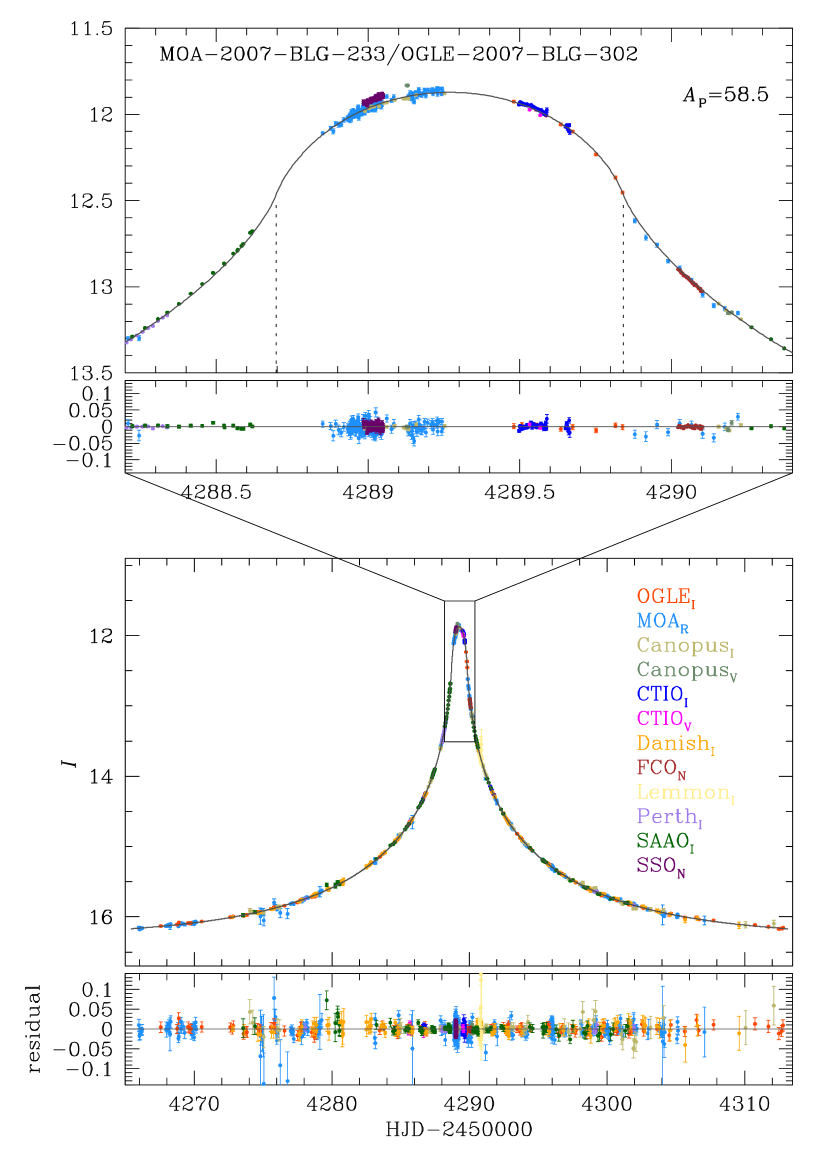
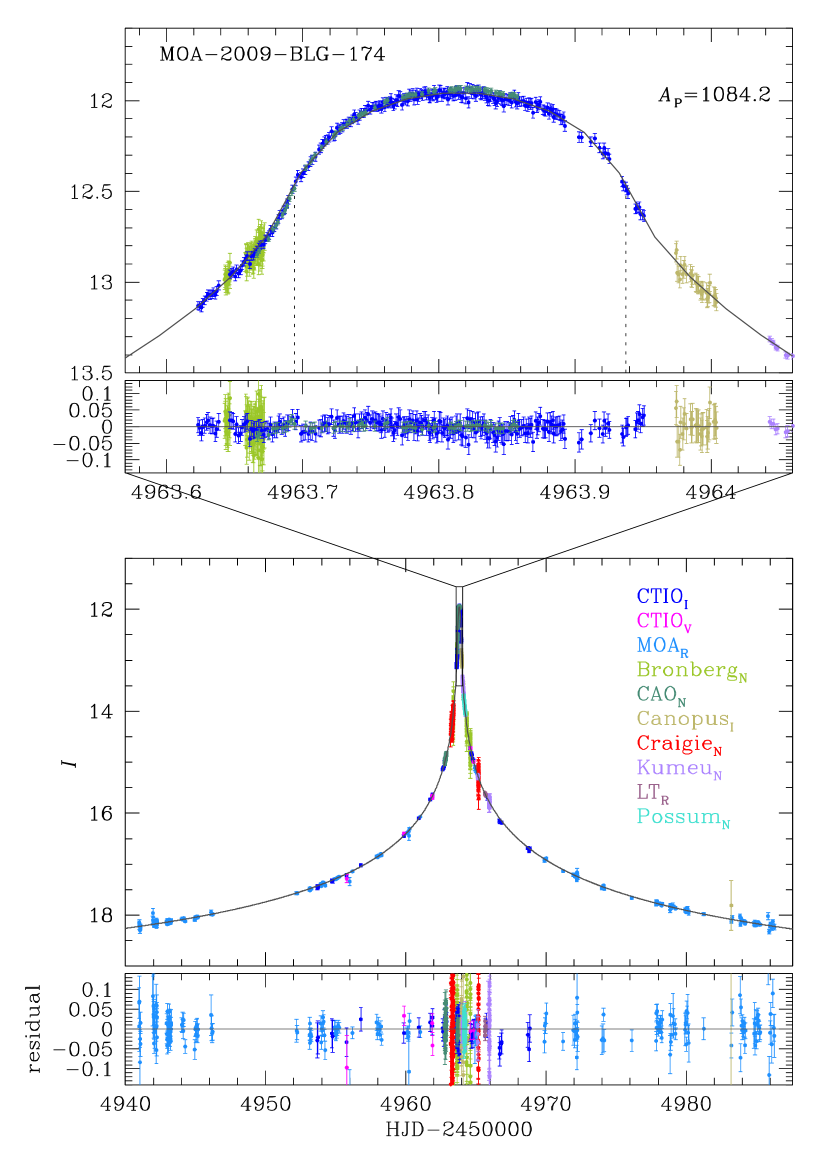
Table 2 shows the observatories of the telescopes that were used for observations of the individual events along with the observed passbands (marked as subscripts after the observatory names) and the numbers of data points (values in parentheses). Also marked are the coordinates (RA,DEC) of the events. Survey observations were conducted by MOA and OGLE groups using the 1.8 m telescope at Mt. John Observatory in New Zealand and the 1.3m Warsaw University telescope at Las Campanas Observatory in Chile, respectively. Follow-up observations were carried out by FUN, PLANET, RoboNet, and MiNDSTEp groups using 22 telescopes located in 8 different countries. These telescopes include 1.3 m SMARTS CTIO, 0.4 m CAO in Chile, 0.4 m Auckland, 0.4 m FCO, 0.4 m Possum, 0.4 m Kumeu, 0.4 m VLO in New Zealand, 1.0 m Lemmon in Arizona, USA, 0.4 m Bronberg in South Africa, 0.6 m Pico dos Dias in Brazil, 0.25 m Craigie, 0.3 m PEST in Australia, 0.28m SSO in French Polynesia, 1.0 m SAAO, 1.5 m Boyden in South Africa, 1.0 m Canopus, 0.6 m Perth in Australia, 1.5 m Steward in Arizona, USA, 2.0 m FTN in Hawaii, USA, 2.0 m FTS in Australia, 2.0 m LT in La Palma, Spain, and 1.54 m Danish in La Silla, Chile.
Reduction of data was conducted by using photometry codes that were developed by the individual groups. The MOA and OGLE data were reduced by photometry codes developed by Bond et al. (2001) and Udalski (2003), respectively, which are based on Difference Image Analysis method (Alard & Lupton, 1998). The FUN data were processed using a DoPHOT pipeline (Schechter, 1993). For PLANET and MiNDSTEp data, a pySIS pipeline (Albrow et al., 1998) is used. For RoboNet data, a DanDIA pipeline (Bramich, 2008) is used.
The error bars estimated from different observatories are rescaled so that per degree of freedom becomes unity for the data set of each observatory where is computed based on the best-fit model. According to this simple scheme, however, we find a systematic tendency for some data sets that error bars near the peak of a light curve are overestimated. We find that this is caused by the inclusion of redundant data at the baseline in error normalization. In this case, the data at the baseline greatly outnumber accurate data points near the peak and thus error-bar normalization is mostly dominated by the baseline data. To minimize this systematics, we restrict the range of data for error normalization not to be too wide so that error estimation is not dominated by data at the baseline, but not to be too narrow so that lensing parameters can be measured accurately. For the final data set used for modeling, we eliminate data points lying beyond 3 from the best-fit model.
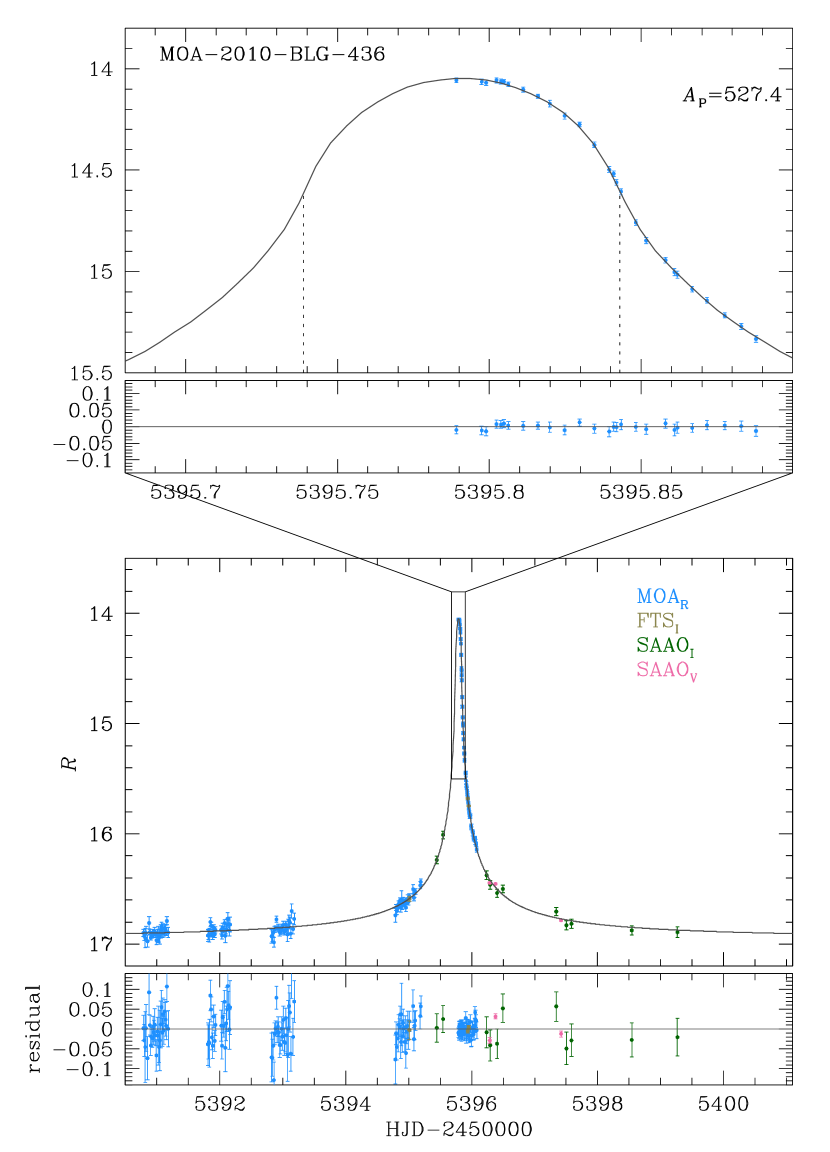
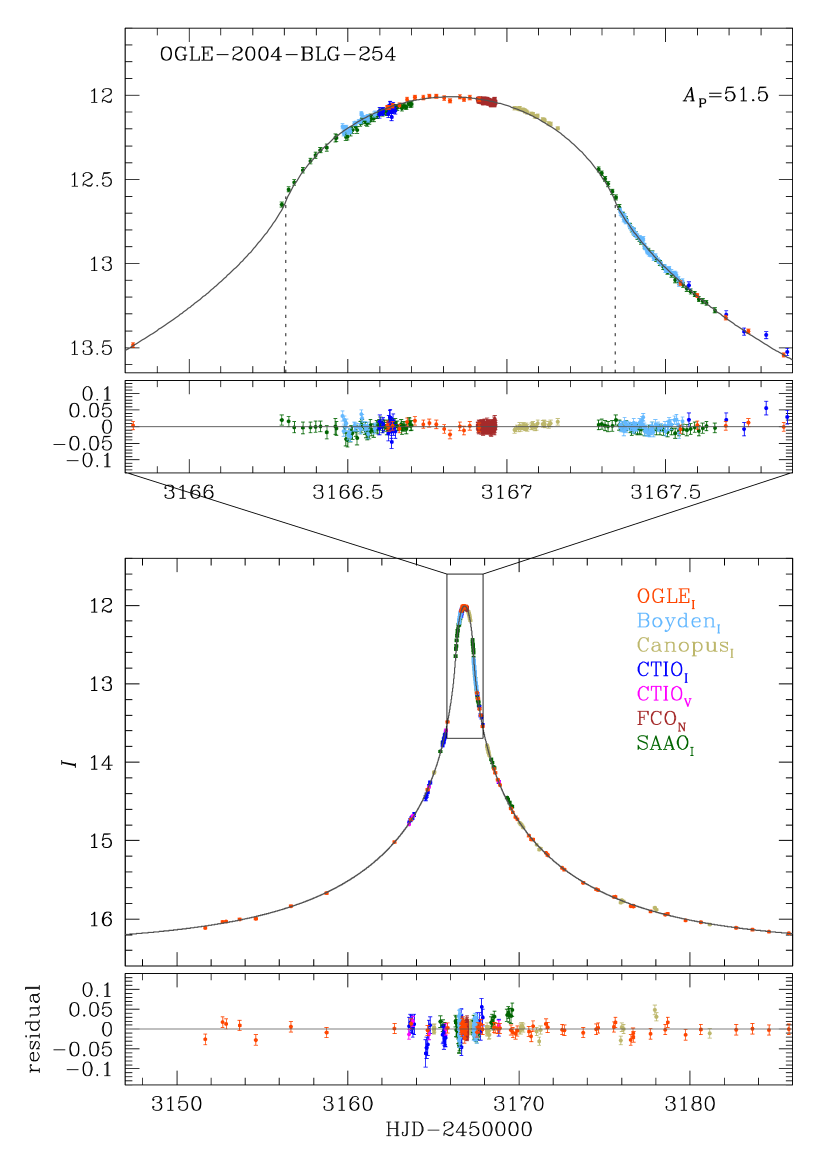
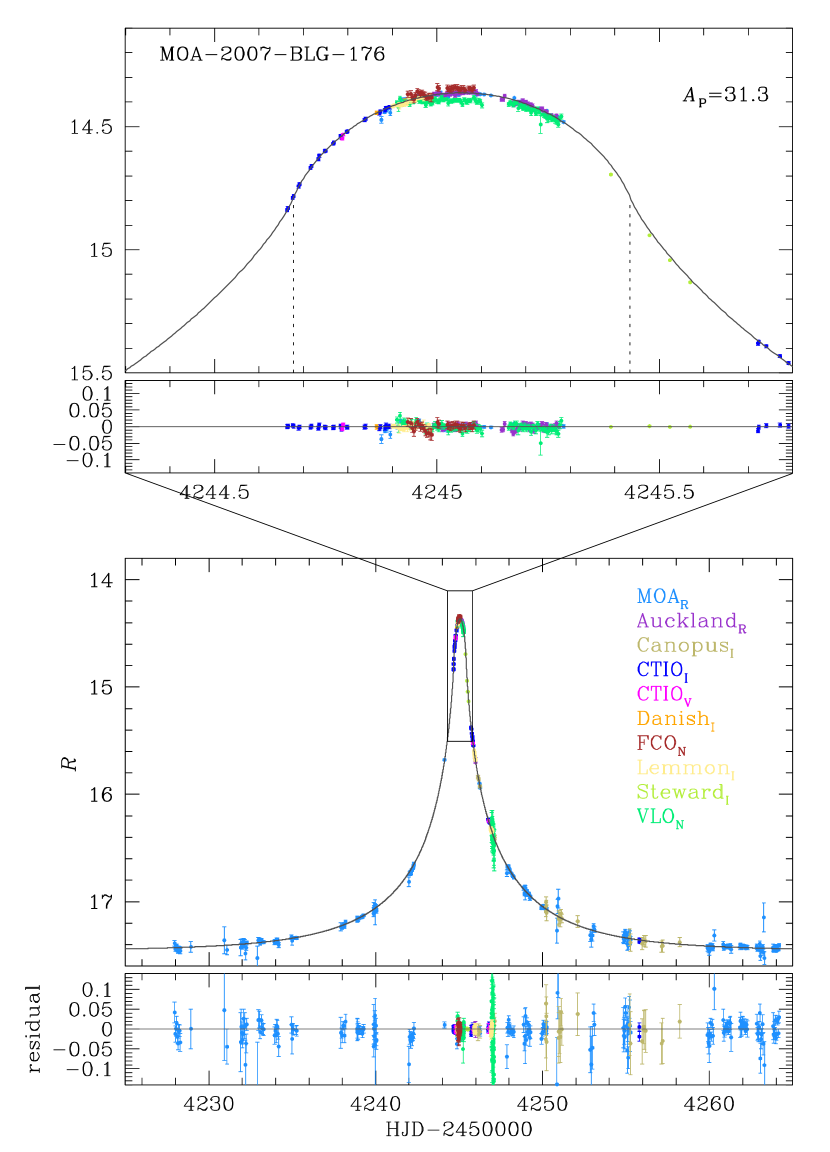
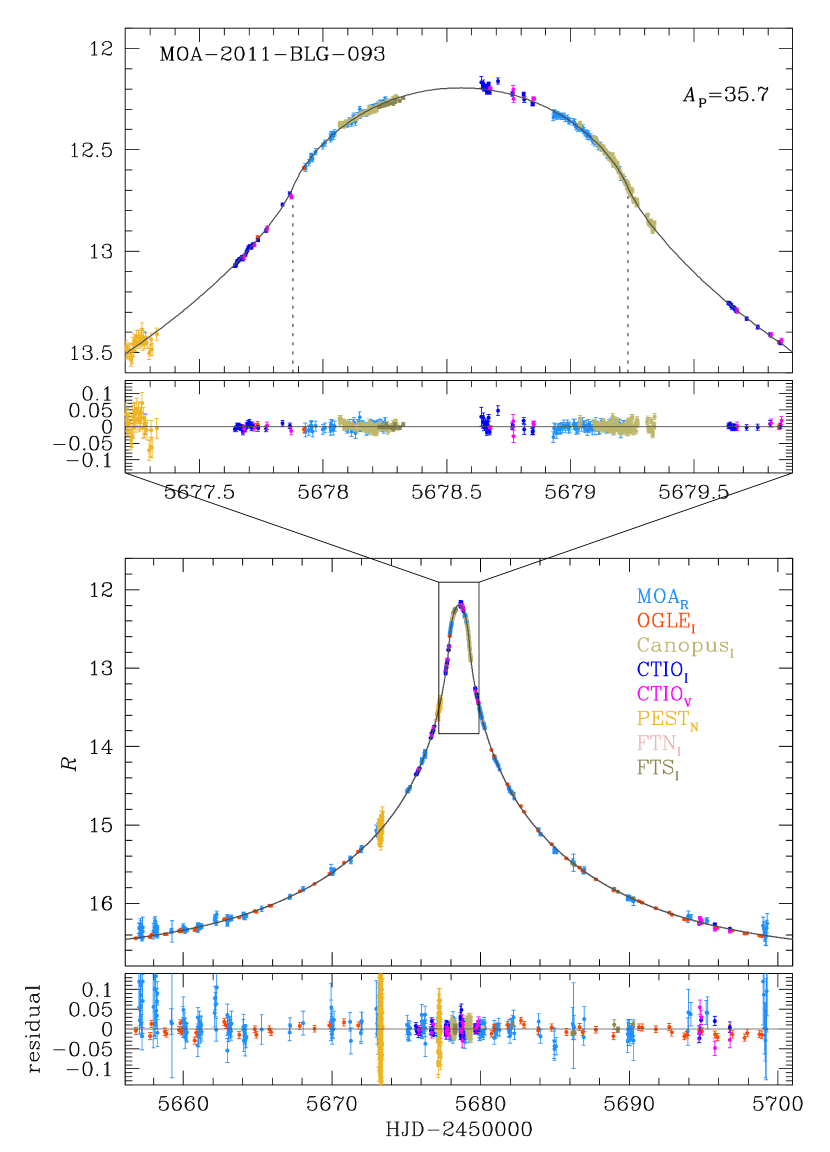
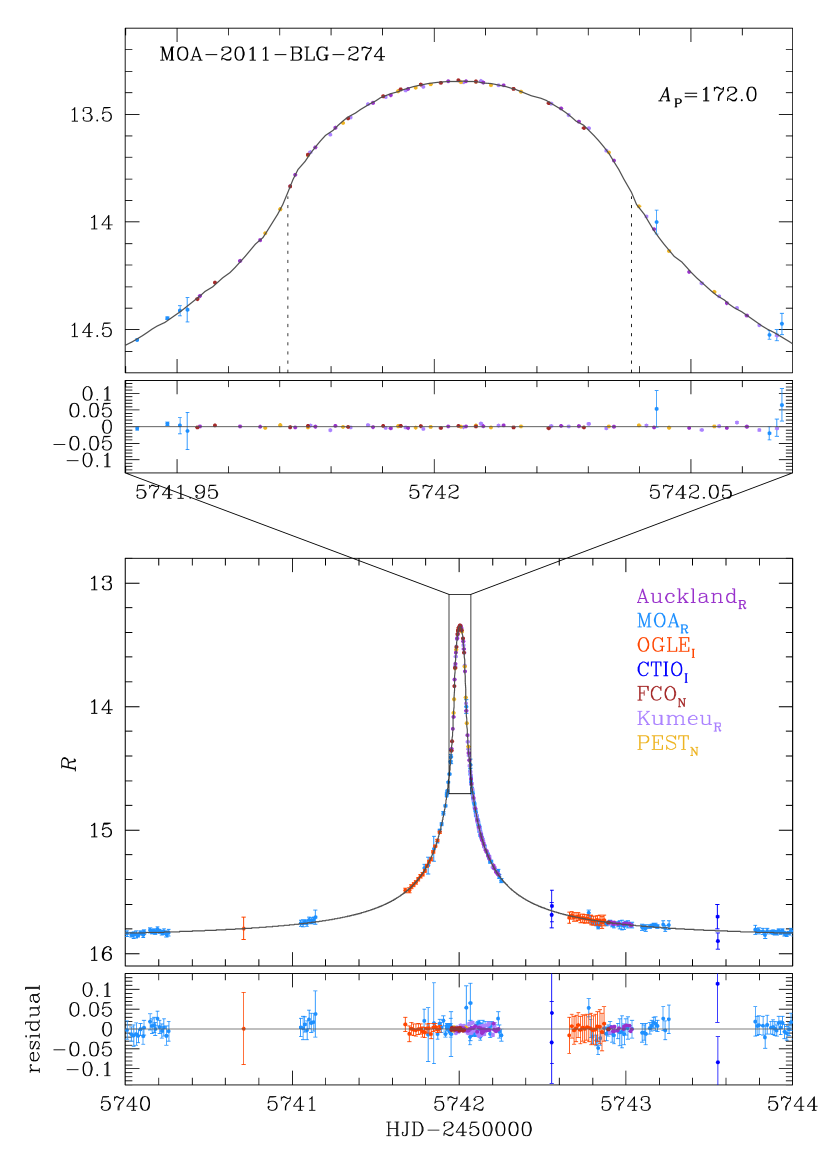
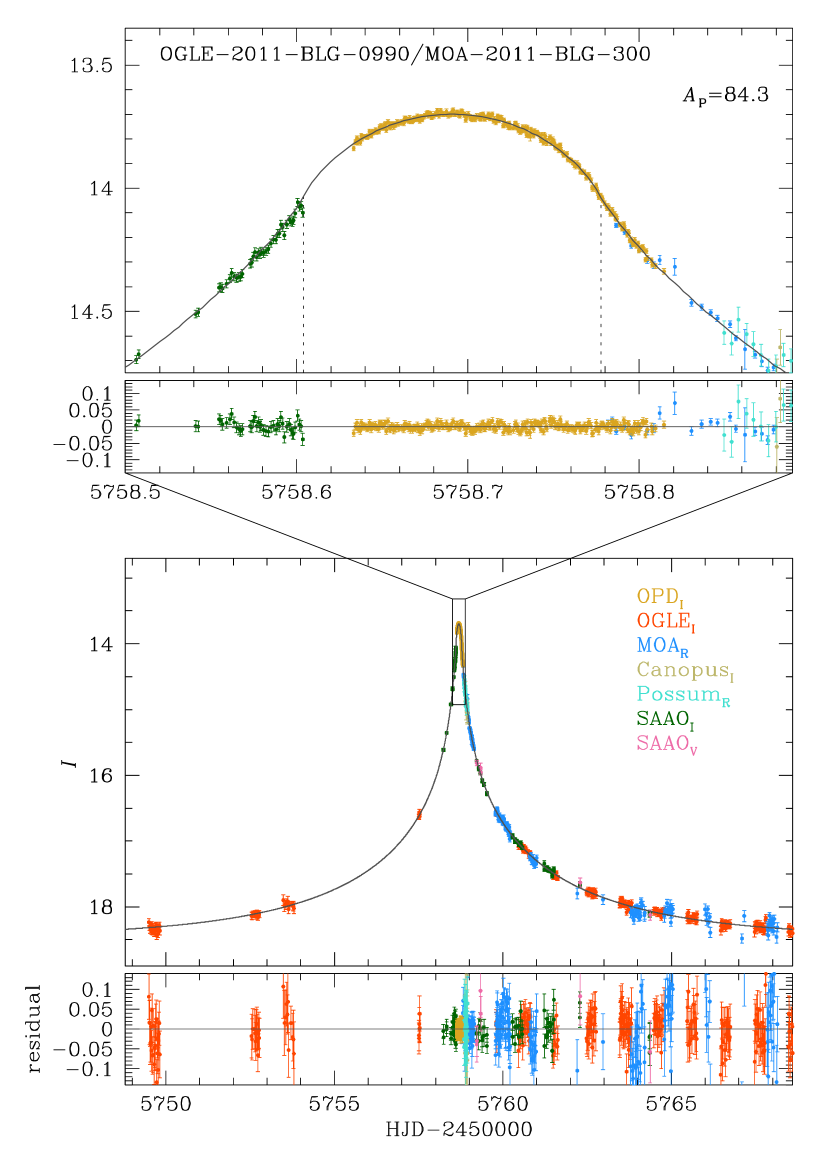
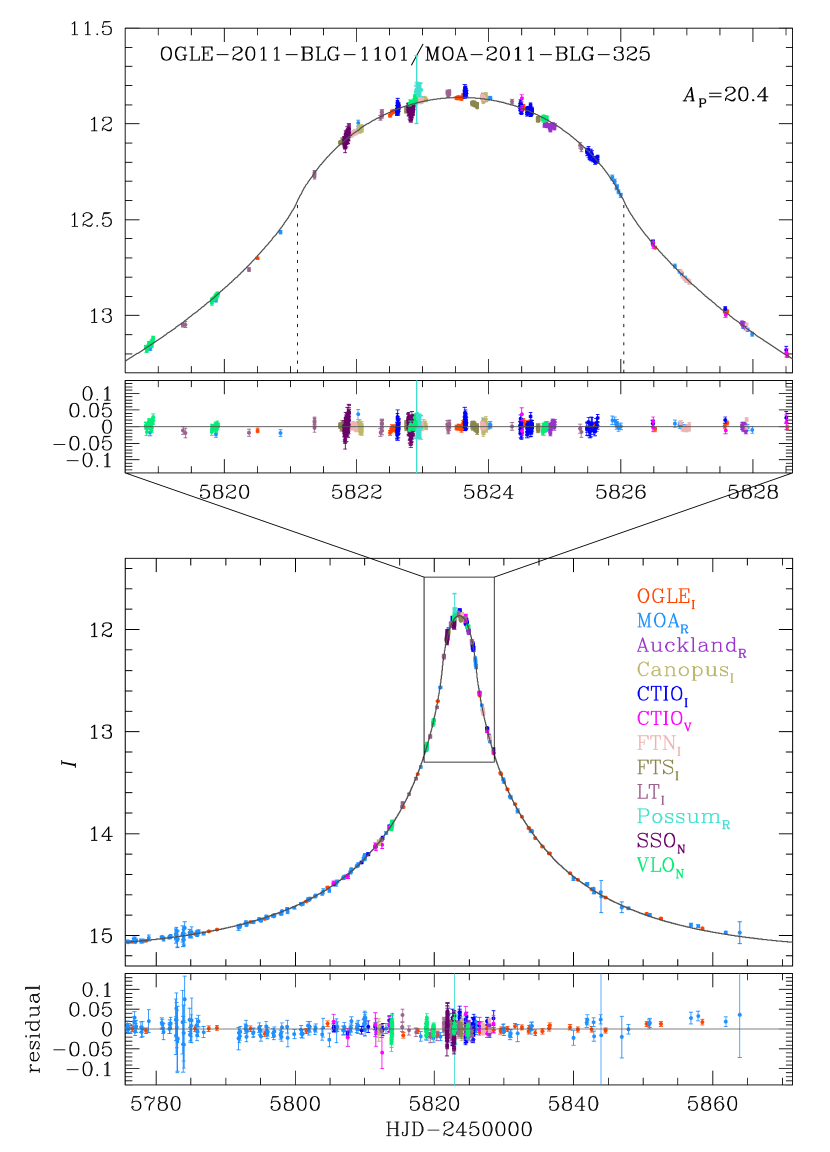
In Figure 1-9, we present the light curves of the individual events. In each figure, the lower two panels show the overall shape of the light curve and residual and the upper two panels show the enlargement of the peak region of the light curve and residual. For each figure, we mark the moments of the lens’entrance and exit of the source by two dotted vertical lines. Also marked is the peak source magnification. We note that the same color of data points is used for each observatory throughout the light curves and colors of data points are chosen to match those of labels of observatories. We note that the magnitude scale corresponds to one of the observatories in the list, while data from the other observatories have adjusted blends and are vertically shifted to match the first light curve. The choice of reference is based on data from survey observation, i.e. OGLE and MOA data. If both OGLE and MOA data are available, the OGLE data is used for reference.
4. Modeling
Modeling the light curve of each event is conducted by searching for a set of lensing parameters that best describes the observed light curve. For all events, the light curves appear to have a standard form except the peak region and thus we start with a simple single-lens modeling. The light curve of a standard single-lensing event is characterized by 3 parameters, that are the time of the closest lens-source approach, , the lens-source separation at that moment, , and the Einstein time scale, . Based on the initial solution, we refine the solution by considering additional second-order effects.
To precisely describe the peak region of the light curve of an event with a lens passing over a source, additional parameters are needed to describe the deviation caused by the finite-source effect. To the first order approximation, the finite-source effect is described by the normalized source radius, . For more refined description of the deviation, additional parameters of the limb-darkening coefficients, , are needed to account for the variation of the deviation caused by the brightness profile of the source star surface. With the coefficients, the limb-darkening profile is modeled by the standard linear law
| (4) |
where is the intensity of light at the center of the stellar disk and is the angle between the normal to the stellar surface and the line of sight toward the observer.
For an event with a time scale comparable to the orbital period of the Earth, the position of the observer changes by the Earth’s orbital motion during the event and the resulting light curve deviates from a symmetric standard form. This parallax effect is described by 2 parameters of and , that represent the two components of the lens parallax vector projected on the sky in the north and east equatorial coordinates, respectively. The direction of the parallax vector corresponds to the lens-source relative motion in the frame of the Earth. The size of the parallax vector corresponds to the ratio of the Earth’s orbit, i.e. 1 AU, to the Einstein radius projected on the observer’s plane.
For a high-magnification event, the peak of the light curve can exhibit additional deviations if the lens has a companion. For a planetary companion located near the Einstein ring of the primary lens or a binary companion with a separation from the primary substantially smaller or larger than the Einstein radius, a small caustic is induced near the location of the primary lens. Then, the source trajectory of a high-magnification event passing close to the primary lens has a high chance to approach the caustic, resulting in a perturbation near the peak of the light curve. Description of the perturbation induced by a lens companion requires 3 additional parameters of the mass ratio between the binary lens components, , the projected separation in units of the Einstein radius, , and the angle between the source trajectory and the binary axis, .
For each event, we search for a solution of the best-fit lensing parameters by minimizing in the parameter space. For the minimization, we use a Markov Chain Monte Carlo (MCMC) method. We compute finite magnifications by using the ray-shooting technique (Schneider & Weiss, 1986; Kayser et al., 1986; Wambsganss, 1997). In this method, rays are uniformly shot from the image plane, bent according to the lens equation, and land on the source plane. Then, a finite magnification is computed by comparing the number densities of rays on the image and source planes. Precise computation of finite magnifications by using this numerical technique requires a large number of rays and thus demands heavy computation. To minimize computation, we limit finite-magnification computation by using the ray-shooting method only when the lens is close to the source. Once a solution of the parameters is found, we estimate the uncertainties of the individual parameters based on the chain of solutions obtained from MCMC runs.
| event | (HJD-2450000) | (days) | ||||
|---|---|---|---|---|---|---|
| OGLE-2004-BLG-254 | 1326/593 | 3166.8194 | 0.0046 | 13.23 | 0.0400 | – |
| 0.0002 | 0.0008 | 0.05 | 0.0002 | – | ||
| OGLE-2004-BLG-482 | 756.9/693 | 3235.7816 | 0.000 | 9.61 | 0.1309 | – |
| 0.0007 | 0.002 | 0.02 | 0.0005 | – | ||
| OGLE-2007-BLG-050 | 1760.5/1745 | 4221.9726 | 0.002 | 68.09 | 0.0045 | 0.12 |
| /MOA-2007-BLG-103 | 0.0001 | 0.000 | 0.66 | 0.0001 | 0.03 | |
| OGLE-2007-BLG-224 | – | – | 0.00029 | 6.91 | 0.0009 | 1.97 |
| /MOA-2007-BLG-163 | – | – | 0.13 | 0.0002 | 0.13 | |
| OGLE-2008-BLG-279 | – | 4617.34787 | 0.00066 | 106.0 | 0.00068 | 0.15 |
| /MOA-2008-BLG-225 | 0.00008 | 0.00005 | 0.9 | 0.00006 | 0.02 | |
| OGLE-2008-BLG-290 | 2317.7/2015 | 4632.56037 | 0.00276 | 16.36 | 0.0220 | – |
| /MOA-2008-BLG-241 | 0.00027 | 0.0002 | 0.08 | 0.0001 | – | |
| OGLE-2004-BLG-254 | 785.2/784 | 3166.823 | 0.0111 | 12.84 | 0.0418 | – |
| 0.001 | 0.0004 | 0.09 | 0.0004 | – | ||
| MOA-2007-BLG-176 | 1756.0/1747 | 4245.056 | 0.0363 | 8.13 | 0.0590 | – |
| 0.001 | 0.0005 | 0.07 | 0.0006 | – | ||
| MOA-2007-BLG-233 | 1779.4/1757 | 4289.269 | 0.0060 | 15.90 | 0.0364 | – |
| /OGLE-2007-BLG-302 | 0.001 | 0.0002 | 0.05 | 0.0001 | – | |
| MOA-2009-BLG-174 | 2816.5/3051 | 4963.816 | 0.0005 | 64.99 | 0.0020 | 0.06 |
| 0.001 | 0.0001 | 0.61 | 0.0001 | +0.07-0.02 | ||
| MOA-2010-BLG-436 | 2599.4/2593 | 5395.791 | 0.0002 | 12.78 | 0.0041 | – |
| 0.001 | 0.0002 | 1.08 | 0.0003 | – | ||
| MOA-2011-BLG-093 | 3038.0/3024 | 5678.555 | 0.0292 | 14.97 | 0.0538 | – |
| 0.001 | 0.0002 | 0.05 | 0.0002 | – | ||
| MOA-2011-BLG-274 | 3657.7/3649 | 5742.005 | 0.0029 | 2.65 | 0.0129 | – |
| 0.001 | 0.0001 | 0.06 | 0.0003 | – | ||
| OGLE-2011-BLG-0990 | 5551.6/5540 | 5758.691 | 0.0151 | 6.70 | 0.0199 | – |
| /MOA-2011-BLG-300 | 0.001 | 0.0004 | 0.07 | 0.0003 | – | |
| OGLE-2011-BLG-1101 | 1562.6/1562 | 5823.574 | 0.0485 | 29.06 | 0.0979 | – |
| /MOA-2011-BLG-325 | 0.002 | 0.0005 | 0.11 | 0.0006 | – |
Note. — The parameters of the first 6 events are adopted from previously analyses and those of the other 9 events are determined in this work. For OGLE-2004-BLG-254, the event was reanalyzed by adding more data sets. The references of the previous analyses are presented in Table 1.
| event | source type | limb-darkening coefficients | ||
|---|---|---|---|---|
| OGLE-2004-BLG-254 | KIII | – | 0.700.05 | 0.550.05 |
| OGLE-2004-BLG-482 | MIII | – | 0.880.02 | 0.710.01 |
| OGLE-2007-BLG-050 | subgiant | – | – | – |
| /MOA-2007-BLG-103 | ||||
| OGLE-2007-BLG-224 | FV | – | – | – |
| /MOA-2007-BLG-163 | ||||
| OGLE-2008-BLG-279 | GV | – | – | – |
| /MOA-2008BLG-225 | ||||
| OGLE-2008-BLG-290 | KIII | 0.770.01 | 0.620.07 | 0.550.01 |
| /MOA-2008-BLG-241 | ||||
| OGLE-2004-BLG-254 | KIII | – | – | 0.700.07 (OGLE) |
| (2.0, 4750 K) | 0.560.10 (CTIO) | |||
| 0.690.10 (Boyden) | ||||
| 0.780.09 (Canopus) | ||||
| 0.550.06 (SAAO) | ||||
| 0.61 (Claret 2000) | ||||
| MOA-2007-BLG-176 | KIII | – | 0.530.04 (MOA) | 0.500.05 (CTIO) |
| (2.0, 4500 K) | 0.510.05 (Auckland) | 0.440.06 (Lemmon) | ||
| 0.73 (Claret 2000) | 0.63 (Claret 2000) | |||
| MOA-2007-BLG-233 | GIII | – | 0.560.02 (MOA) | 0.530.04 (OGLE) |
| /OGLE-2007-BLG-302 | (2.5, 5000 K) | 0.68 (Claret 2000) | 0.560.02 (CTIO) | |
| 0.490.02 (Canopus) | ||||
| 0.59 (Claret 2000) | ||||
| MOA-2009-BLG-174 | FV | – | – | 0.330.02 (CTIO) |
| (4.5, 6750 K) | 0.46 (Claret 2000) | |||
| MOA-2010-BLG-436 | – | – | 0.520.10 (MOA) | – |
| MOA-2011-BLG-093 | GIII | 0.690.05 (CTIO) | 0.550.04 (MOA) | 0.510.10 (OGLE) |
| (3.0, 5500 K) | 0.70 (Claret 2000) | 0.63 (Claret 2000) | 0.580.04 (CTIO) | |
| 0.510.03 (Canopus) | ||||
| 0.54 (Claret 2000) | ||||
| MOA-2011-BLG-274 | GV | – | 0.480.02 (Kumeu) | – |
| (4.0, 6000 K) | 0.510.01 (Auckland) | |||
| 0.59 (Claret 2000) | ||||
| OGLE-2011-BLG-0990 | – | – | – | 0.560.04 (OPD) |
| /MOA-2011-BLG-300 | ||||
| OGLE-2011-BLG-1101 | KIII | 0.890.14 (CTIO) | 0.770.08 (MOA) | 0.740.07 (OGLE) |
| /MOA-2011-BLG-325 | (2.0, 4250 K) | 0.83 (Claret 2000) | 0.76 (Claret 2000) | 0.810.07 (CTIO) |
| 0.770.06 (Canopus) | ||||
| 0.780.05 (FTS) | ||||
| 0.65 (Claret 2000) | ||||
Note. — The parameters of the first 6 events are adopted from previously analyses and those of the other 9 events are analyzed in this work. For OGLE-2004-BLG-254, the event was reanalyzed by adding more data sets. The references of the previous analyses are presented in Table 1. The limb-darkening coefficients, , are presented for the individual data sets used for measurements and they are compared with theoretical values predicted by Claret (2000). Also presented are the adopted values of and . The unit of the stellar surface gravity is cm/s2
5. Result
In Table 3, we present the lensing parameters of the best-fit solutions of the individual events determined from modeling. To provide integrated results of events with lenses passing over source stars, we also provide solutions of events that were previously analyzed. For OGLE-2004-BLG-254, we provide both solutions of the previous analysis and this work for comparison.
For all events analyzed in this work, we are able to measure the limb-darkening coefficients of source stars. In Table 4, we present the measured limb-darkening coefficients. We measure the coefficients corresponding to the individual data sets covering the peak of each light curve instead of the individual passbands. This is because the characteristics of filters used for different telescopes are different from one another even though they are denoted by a single representative band and thus joint fitting of data measured in different filter systems may result in erroneous measurement of limb-darkening coefficients (Fouque et al., 2010). To compare with theoretical values, we also provide values of coefficients predicted by Claret (2000) for the Bessell , , and filters. Also provided are the source types and the adopted values of and where the typical uncertainties of the surface gravity and the effective temperature are and K, respectively. We adopt a solar metallicity. We note that the measured coefficients are generally in good agreement with theoretical values, . From the table, it is found that for 23 out of the total 29 measurements the measured coefficients are within 20% range of the fractional difference as measured by . The cases of large differences with include (Canopus) for OGLE-2004-BLG-254, (MOA), (Auckland), and (Lemmon) for MOA-2007-BLG-176, (CTIO) for MOA-2009-BLG-174, and (CTIO) for OGLE-2011-BLG-1101/MOA-2011-BLG-325. From the inspection of the individual data points on the light curves, we find the major reasons for the large differences between the measured and theoretical values are due to poor coverage [(Canopus) for OGLE-2004-BLG-254, (MOA, Auckland) and (Lemmon) for MOA-2007-BLG-176, (CTIO) for MOA-2009-BLG-174] or poor data quality [(CTIO) for OGLE-2011-BLG-1101/MOA-2011-BLG-325]. Other possible reason for differences from the predicted values include differences of individual filters from the standard Bessel filters, as well as differences in the method to compute the theoretical values (Heyrovský, 2007).
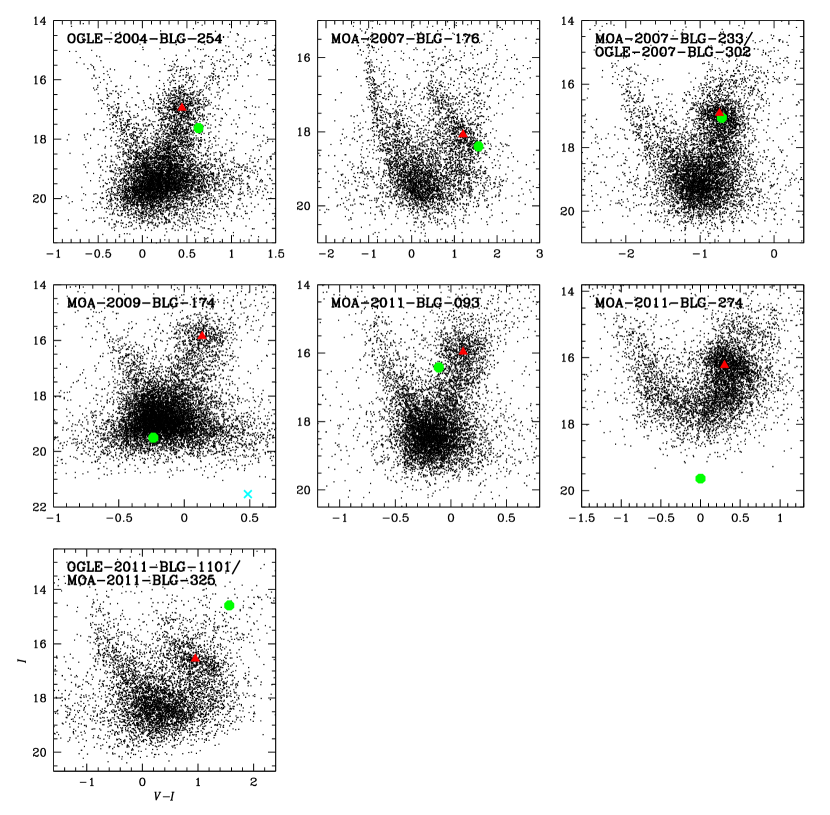
The source type of each event is determined based on the location of the source in the color-magnitude diagram (CMD) of stars in the same field. CMDs are obtained from CTIO images taken in and bands. To locate the lensed star in the CMD, it is required to measure the fraction of blended light in the observed light curve. This is done by including a blending parameter in the process of light curve modeling. For MOA-2011-BLG-274, a CMD taken from CTIO is available but images were taken after the event and thus we could not determine the source color and magnitude by the usual method. Instead we employ the method of Gould et al. (2010). In this method, we first measure the source instrumental magnitudes by fitting the OGLE () and PEST (unfiltered, ) data to the light curve model. We then align each of these data sets to CTIO () using comparison stars, which effectively transforms to . In figure 10, we present the CMDs of stars in the fields of the individual events and the locations of source stars.222We note that high-resolution spectra are available for some events with lenses passing over source stars. These events are OGLE-2004-BLG-254 (Cassan et al., 2006), OGLE-2004-BLG-482 (Zub et al., 2011), OGLE-2007-BLG-050/MOA-2007-BLG-103 (Johnson et al., 2011), MOA-2009-BLG-174, MOA-2010-BLG-311, MOA-2010-BLG-523 (Bensby et al., 2011), and MOA-2011-BLG-093 (McGregor et al., 2011). For those who are more interested in the source stars of these events, see the related references. For MOA-2010-BLG-436 and OGLE-2011-BLG-0990/MOA-2011-BLG-300, there exists SAAO data taken in I and V bands, but the number and quality of V-band data are not numerous and good enough to specify the source type.
In Table 5, we present the measured Einstein radii. The Einstein radius of each event is determined from the angular source radius, , and the normalized source radius, , as . The normalized source radius is measured from modeling. To measure the angular source radius, we use the method of Yoo et al. (2004), where the de-reddened color is measured from the location of the source in the CMD, is converted into using the relation of Bessel & Brett (1988), and then the angular source radius is inferred from the color and the surface brightness relation given by Kervella et al. (2004). In this process, we use the centroid of bulge clump giants as a reference for the calibration of the color and brightness of a source under the assumption that the source and clump giants experience the same amount of extinction and reddening. We note that no CMD is available for MOA-2010-BLG-436 and OGLE-2011-BLG-0990/MOA-2011-BLG-300 and thus the Einstein radius is not provided. Also provided in Table 5 are the relative lens-source proper motions as measured by .
| event | ||||
|---|---|---|---|---|
| OGLE-2004-BLG-254 | 0.114 | 3.1 | – | – |
| OGLE-2004-BLG-482 | 0.4 | 16 | – | – |
| OGLE-2007-BLG-050/MOA-2007-BLG-103 | 0.480.01 | 2.630.08 | 0.500.14 | 5.50.4 |
| OGLE-2007-BLG-224/MOA-2007-BLG-163 | 0.910.04 | 482 | 0.0560.004 | 0.530.04 |
| OGLE-2008-BLG-279/MOA-2008-BLG-225 | 0.810.07 | 2.70.2 | 0.640.10 | 4.00.6 |
| OGLE-2008-BLG-290/MOA-2008-BLG-241 | 0.300.02 | 6.70.4 | – | – |
| OGLE-2004-BLG-254 | 0.140.01 | 4.060.35 | – | – |
| MOA-2007-BLG-176 | 0.140.01 | 6.210.54 | – | – |
| MOA-2007-BLG-233/OGLE-2007-BLG-302 | 0.170.01 | 3.810.33 | – | – |
| MOA-2009-BLG-174 | 0.430.04 | 2.400.24 | 0.840.37 | 6.391.11 |
| MOA-2010-BLG-436 | – | – | – | – |
| MOA-2011-BLG-093 | 0.070.01 | 1.800.16 | – | – |
| MOA-2011-BLG-274 | 0.080.01 | 11.180.97 | – | – |
| OGLE-2011-BLG-0990/MOA-2011-BLG-300 | – | – | – | – |
| OGLE-2011-BLG-1101/MOA-2011-BLG-325 | 0.240.02 | 2.990.26 | – | – |
Note. — The parameters of the first 6 events are adopted from previously analyses and those of the other 9 events are analyzed in this work. For OGLE-2004-BLG-254, the event was reanalyzed by adding more data sets. The references of the previous analyses are presented in Table 1.
We note that the measured Einstein radii of some events are substantially smaller than a typical value. These events include OGLE-2004-BLG-254 (), MOA-2007-BLG-176 (), MOA-2007-BLG-233/OGLE-2007-BLG-302 (), MOA-2011-BLG-093 (), and MOA-2011-BLG-274 (). The lens mass and distance are related to the Einstein radius by
| (5) |
Hence, the small of these events implies that lenses are either very close to the source or very low-mass objects. Most of these events have proper motions that are typical of bulge lenses (2–7 ) and so may be quite close to the source (see Table 5). But MOA-2011-BLG-274 has a substantially higher proper motion, . It is therefore a good candidate for a sub-stellar object or even a free-floating planet (Sumi et al., 2011). Because of its high proper motion, it should be possible to detect the lens within a few years using high-resolution infrared imaging, provided it is luminous. In this case a null result would confirm its substellar nature.
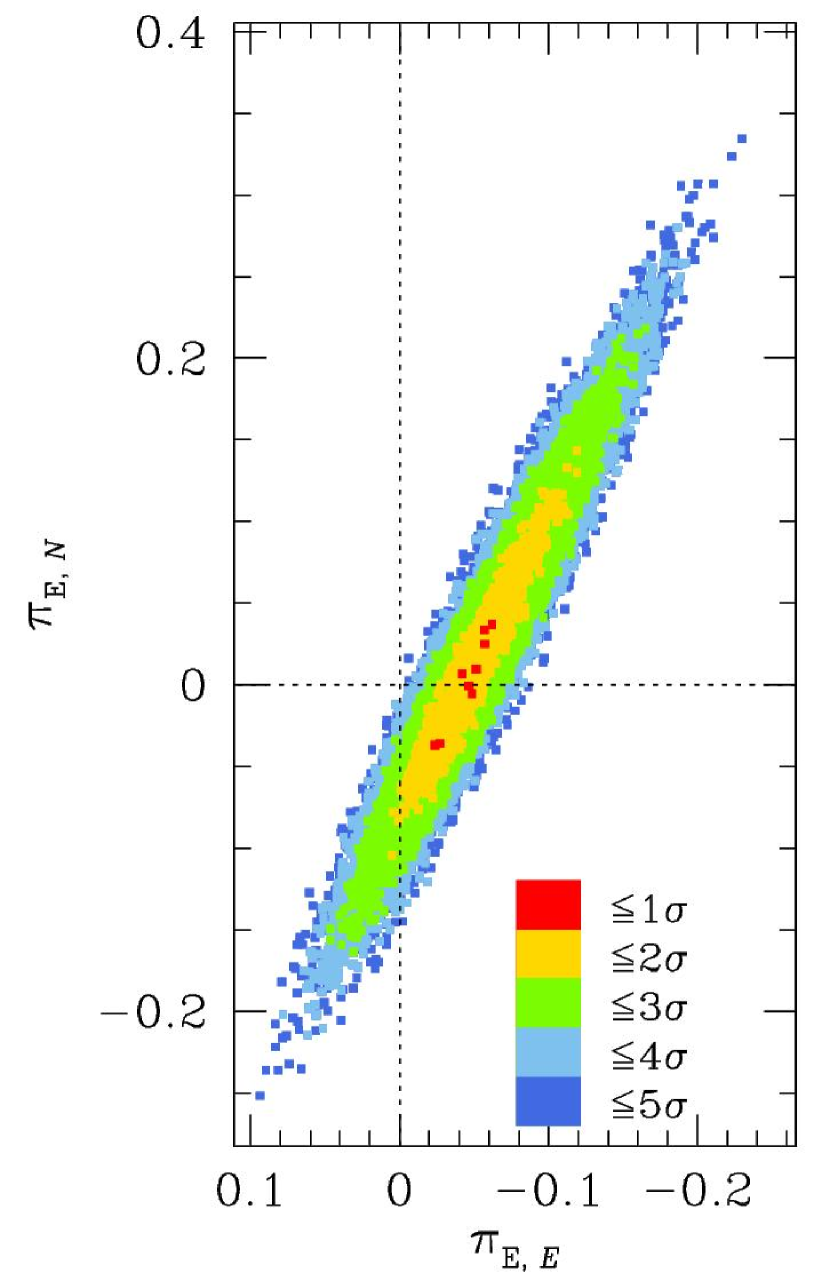
For MOA-2009-BLG-174, the lens parallax is measured with . The measured parallax parameters are
| (6) |
where and are the components of the lens parallax vector that are parallel with and perpendicular to the projected position of the Sun. These values correspond to the standard parallax components of . In Figure 11, we present contours of in the space of the parallax parameters. Combined with the measured Einstein radius, the physical parameters of the lens are uniquely determined as
| (7) |
and
| (8) |
respectively. We find that the measured lens mass is consistent with the de-reddened color of blended light , which approximately corresponds to the color of an early K-type main-sequence star with a mass equivalent to the estimated lens mass, suggesting that the blend is very likely to be the lens. We mark the position of the blend in the corresponding CMD in Figure 10.
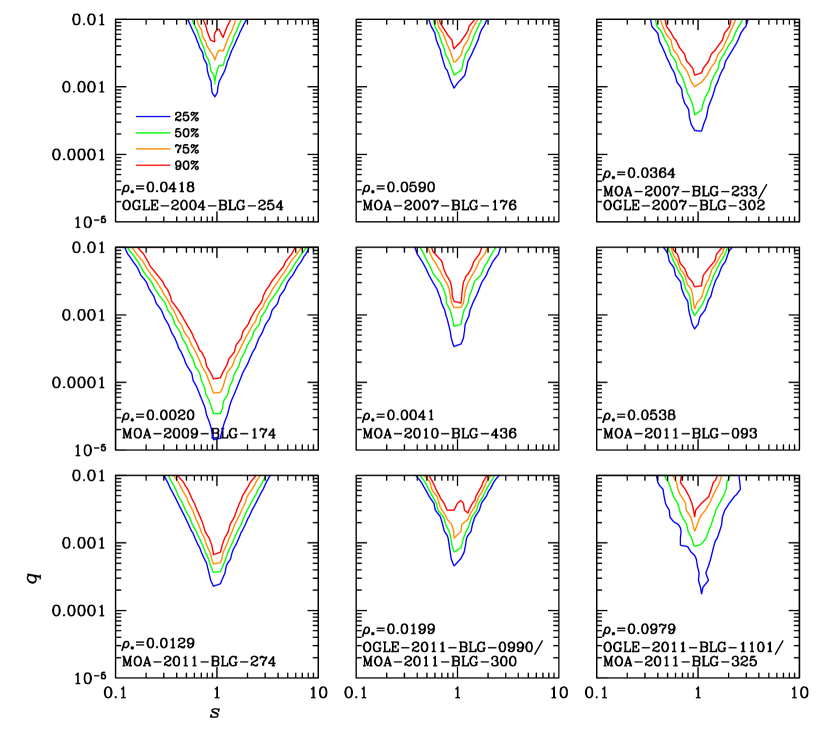
A high-magnification event is an important target for planet search due to its high efficiency to planetary perturbations. Unfortunately, we find no statistically significant deviations from the single-lens fit for any of the events analyzed in this work. However, it is still possible to place limits on the range of the planetary separation and mass ratio. For this purpose, we construct so-call “exclusion diagrams” which show the confidence levels of excluding the existence of a planet as a function of the normalized star-planet separation and the planet/star mass ratio. We construct diagrams by adopting Gaudi & Sackett (2000) method. In this method, binary models are fitted to observed data with the 3 binary parameters (, , ) are held fixed. Then, the confidence level of exclusion for planets with and is estimated as the fraction of binary models not consistent with the best-fit single-lens model among all tested models with various values of . For fitting binary models, it is required to produce many light curves with finite magnifications. We produce light curves by using the “map-making method” (Dong et al., 2006), where a magnification map for a given and is constructed and light curves with various source trajectories are produced based on the map. In Figure 12, we present the obtained exclusion diagrams for all analyzed events. Here we adopt a threshold of planet detection as , where and represent the values for the best-fit planetary and single-lens models, respectively. For most events, the constraints on the excluded parameter space is not strong mainly due to the severe finite-source effect. However, the constraint is strong for MOA-2009-BLG-174 because of the small source size () and dense coverage of the peak.
6. Summary
We provide integrated results of analysis for 14 high-magnification lensing events with lenses passing over the surface of source stars that have been detected since 2004. Among them, 8 events are newly analyzed in this work. The newly analyzed events are MOA-2007-BLG-176, MOA-2007-BLG-233/OGLE-2007-BLG-302, MOA-2009-BLG-174, MOA-2010-BLG-436, MOA-2011-BLG-093, MOA-2011-BLG-274, OGLE-2011-BLG-0990/MOA-2011-BLG-300, and OGLE-2011-BLG-1101/MOA-2011-BLG-325. Information about the lenses and lensed stars obtained from the analysis is summarized as follows.
-
1.
For all newly analyzed events, we measure the linear limb-darkening coefficients of the surface brightness profile of the source stars.
-
2.
For all events with available CMDs of field stars, we measure the Einstein radii and the lens-source proper motions. Among them, 5 events (OGLE-2004-BLG-254, MOA-2007-BLG-176, MOA-2007-BLG-233/OGLE-2007-BLG-302, MOA-2011-BLG-093, and MOA-2011-BLG-274) are found to have Einstein radii less than 0.2 mas, making the lenses of the events candidates of very low-mass stars or brown dwarfs.
-
3.
The measured time scale days combined with the small Einstein radius of mas of the event MOA-2011-BLG-274 suggests the possibility that the lens is a free-floating planet.
-
4.
For MOA-2009-BLG-174, we additionally measure the lens parallax and thus uniquely determine the physical parameters of the lens. The measured lens mass of is consistent with that of a star blended with the source, suggesting the possibility that the blend comes from the lens.
-
5.
We find no statistically significant planetary signals for any of the events analyzed in this work. However, it is still possible to place constraint on the range of the planetary separation and mass ratio. For this purpose, we provide exclusion diagrams showing the confidence levels of excluding the existence of a planet as a function of the separation and mass ratio.
References
- Alard & Lupton (1998) Alard, C., & Lupton, R. H. 1998, ApJ, 503, 325
- Albrow et al. (1998) Albrow, M. D., et al. 2009, MNRAS, 397, 2099
- Alcock et al. (1993) Alcock, C., et al. 1993, Nature, 365, 621
- Alcock et al. (1997) Alcock, C., et al. 1997, ApJ, 491, 436
- Batista et al. (2009) Batista, V., et al. 2009, A&A, 508, 467
- Baudry et al. (2011) Baudry, J., et al. 2011, in preparation
- Bennett & Rhie (1996) Bennett, D. P., & Rhie, S. H. 1996, ApJ, 472, 660
- Bensby et al. (2009) Bensby, T., et al. 2009, A&A, 499, 737
- Bensby et al. (2011) Bensby, T., et al. 2011, A&A, 533, A134
- Bessel & Brett (1988) Bessel, M. S., & Brett, J. M. 1998, PASP, 100, 1134
- Bond et al. (2001) Bond, I. A., et al. 2001, MNRAS, 327, 868
- Bramich (2008) Bramich, D. M. 2008, MNRAS, 386, L77
- Bryce et al. (2002) Bryce, H. M., Hendry, M. A., & Valls-Gabaud, D. 2002, A&A, 388, L1
- Cassan et al. (2006) Cassan, A., et al. 2006, A&A, 460, 277
- Claret (2000) Claret, A. 2000, A&A, 363, 1081
- Cohen et al. (2009) Cohen, J. G., et al. 2009, ApJ, 699, 66
- Dong et al. (2006) Dong, S., et al. 2006, ApJ, 642, 842
- Dong et al. (2009) Dong, S., et al. 2009, ApJ, 698, 1826
- Epstein et al. (2010) Epstein, C. R., Johnson, J. A., Dong, S., Udalski, A., Gould, A., & Becker, G. 2010, ApJ, 709, 447
- Fouque et al. (2010) Fouque, P., et al. 2010, A&A, 518, A51
- Fouque et al. (2011) Fouque, P., et al. 2011, in preparation
- Gaudi & Sackett (2000) Gaudi, B. S., & Sackett, D. D. 2000, ApJ, 566, 463
- Gould (1994) Gould, A. 1994, ApJ, 421, L71
- Gould (1997) Gould, A. 1997, ApJ, 480, 188
- Gould et al. (2009) Gould, A., et al. 2009, ApJ, 698, L147
- Gould et al. (2010) Gould, A., Dong, S., Bennett, D.P., Bond, I.A., Udalski, A., & Kozlowski, S. 2010, ApJ, 710, 1800
- Gould et al. (2011) Gould, A., et al. 2011, in preparation
- Griest & Safizadeh (1998) Griest, K. & Safizadeh, N. 1998, ApJ, 500, 37
- Han et al. (2000) Han, C., Park, S.-H., Kim, H.-I., & Chang, K. 2000, MNRAS, 316, 665
- Hendry et al. (2002) Hendry, M. A., Bryce, H. M., & Valls-Gabaud, D. 2002, MNRAS, 335, 539
- Heyrovský & Sasselov (2000) Heyrovský, D. & Sasselov, D. 2000, ApJ, 529, 69
- Heyrovský (2003) Heyrovský, D. 2003, ApJ, 594, 646
- Heyrovský (2007) Heyrovský, D. 2007, ApJ, 656, 483
- Heyrovský (2008) Heyrovský, D. 2008, Proceedings of the Manchester Microlensing Conference, ed. E. Kerins, S. MAO, N. Rattenbury, & Ł. Wyrzykowski, 28
- Hung et al. (2011) Hung, L.-W., et al. 2011, in preparation
- Jiang et al. (2004) Jiang, G., et al. 2004, ApJ, 617, 1307
- Janczak et al. (2010) Janczak, J., et al. 2010, ApJ, 711, 731
- Johnson et al. (2008) Johnson, J. A., Gaudi, B. S., Sumi, T., Bond, I. A., & Gould, A. 2008, ApJ, 685, 508
- Johnson et al. (2011) Johnson, J. A., et al. 2011, in preparation
- Kayser et al. (1986) Kayser, R., Refsdal, S., & Stabell, R. 1986, A&A, 166, 36
- Kervella et al. (2004) Kervella, P., Thévenin, F., Di Folco, E., & Ségransan, D. 2004, A&A, 426, 297
- Loeb & Sasselov (1995) Loeb, A. & Sasselov, D. 1995, ApJ, 449, L33
- McGregor et al. (2011) McGregor, D., et al. 2011, in preparation
- Nemiroff & Wickramasinghe (1994) Nemiroff, R. J. & Wickramasinghe, W. A. D. T. 1994, ApJ, 424, L21
- Paczyński (1986) Paczyński, B. 1986, ApJ, 304, 1
- Rattenbury et al. (2002) Rattenbury, N. J., Bond, I. A., Skuljan, J., & Yock, P. C. M. 2002, MNRAS, 335, 159
- Schechter (1993) Schechter, P. L., Mateo, M., & Saha, A. 1993, PASP105, 1342
- Schneider & Weiss (1986) Schneider, P., & Weiss, A. 1986, A&A, 164, 237
- Smith et al. (2003) Smith, M. C., et al. 2003, MNRAS, 343, 1172
- Sumi et al. (2011) Sumi, T., et al. 2011, Nature, 473, 349
- Udalski et al. (1993) Udalski, A., Szymański, M., Kałużny, J., Kubiak, M., Krzemiński, W., Mateo, M., Preston, G. W., & Paczyński, B. Acta Astro., 43, 289
- Udalski (2003) Udalski, A. 2003, Acta Astron., 53, 291
- Valls-Gabaud (1998) Valls-Gabaud, D. 1998, MNRAS, 294, 747
- Wambsganss (1997) Wambsganss, J. 1997, MNRAS, 284, 172
- Witt & Mao (1994) Witt, H. J. & Mao, S. 1994, ApJ, 430, 505
- Witt (1995) Witt, H. J. 1995, ApJ, 449, 42
- Yee et al. (2009) Yee, J. C., et al. 2009, ApJ, 703, 2082
- Yoo et al. (2004) Yoo, J., et al. 2004, ApJ, 603, 139
- Zub et al. (2011) Zub, M., et al. 2011, A&A, 525, A15