Off-line data processing and analysis for the GERDA experiment
Abstract
Gerda is an experiment designed to look for the neutrinoless double beta decay of 76Ge. The experiment uses an array of high-purity germanium detectors, enriched in 76Ge, directly immersed in liquid argon. Gerda is presently operating eight enriched coaxial detectors (approximately 15 kg of 76Ge) and about 30 new custom-made enriched BEGe detectors will be deployed in the next phase (additional 20 kg of 76Ge). The paper describes the Gerda off-line analysis of the high-purity germanium detector data. Firstly we present the signal processing flow, focusing on the digital filters and on the algorithms used. Secondly we discuss the rejection of non-physical events and the data quality monitoring. The analysis is performed completely with the Gerda software framework (Gelatio), designed to support a multi-channel processing and to perform a modular analysis of digital signals.
1 Introduction
Gerda [1] is a low-background experiment searching for the neutrinoless double beta decay of 76Ge, using an array of bare high-purity germanium (HPGe) detectors isotopically enriched in 76Ge. The detector array is operated directly in ultra radio-pure liquid argon, allowing a substantial background reduction at the -value of 76Ge with respect to the previous experiments [2]. In the present phase (Phase I) eight enriched coaxial detectors are being used, totaling approximately 15 kg of 76Ge. In Phase II, about 30 new custom-made enriched BEGe detectors [3] will be deployed (additional 20 kg of 76Ge). The experiment is located in the underground Laboratori Nazionali del Gran Sasso of the INFN (Italy).
The background suppression in Gerda is achieved by the specific innovative design (namely, detectors operated naked in a cryogenic liquid) and by a strict material selection. In addition, part of the remaining background events can be identified by an off-line analysis of the HPGe detector signals, i.e. detector anti-coincidence and pulse shape discrimination techniques [4].
For this purpose, a software framework (Gelatio) for advanced digital signal processing and analysis has been recently developed [5]. It is implemented in C++ and is based on the MGDO library [6]. The framework is designed to support a multi-channel data processing and a modular analysis of digital signals. Signals are analyzed by using chains of modules completely customizable by the user. Each module handles a precise and self-consistent task of the signal processing and is implemented as a dedicate C++ class. The output of the modules, which is either a scalar parameter (e.g. the amplitude of the signals) or a shaped trace, can be used as input for other modules and/or stored to disk.
The framework was used for the reference analysis of the data acquired in the Gerda commissioning phase (from June 2010 to October 2011), when up to seven HPGe detectors have been operated simultaneously. The commissioning data were used as a benchmark to validate Gelatio against other independent analysis codes and to prove its suitability for the use in the Gerda Phase I.
This paper describes the basic off-line analysis of the Gerda data performed with the Gelatio framework. In section 2 we present the flow of the signal processing and analysis along the module chains and the shaping algorithms. Then, in section 3, we discuss the identification of non-physical events or of signals not properly processed along the analysis pipeline. Also, the monitoring of the data quality will be described. Finally, summary and conclusions are presented in section 4.
2 Signal processing flow
The charge pulses from the HPGe detectors operated in Gerda are digitized by 14-bit flash-ADCs [7] (FADC) running at 100 MHz sampling rate. For each event, the FADC computes in run-time two traces that are eventually written to disk. The first trace is sampled at 100 MHz and is 4 s long (high-frequency-short trace). It includes the signal leading edge and it is used for identifying background events through pulse shape discrimination techniques. The second trace has a sampling frequency of 25 MHz and is 160 s long (low-frequency-long trace). It is used for those operations, as energy reconstruction, which involve the integration of the signal.
The two traces are processed along different chains of Gelatio modules, as shown in Figure 1.
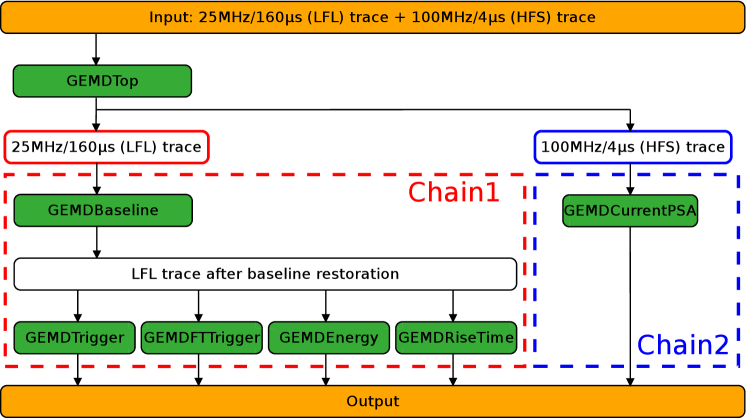
The first module is GEMDTop. It takes care of extracting the traces from the input file and making them available to the other modules. It also checks, and possibly changes, the pulse polarity in order to always have positive-polarity pulses. The output traces are the starting point for two chains: the low-frequency-long trace is processed along Chain1 while the high-frequency-short trace along Chain2.
Chain1 starts with GEMDBaseline. This module analyzes the baseline of the signal by computing the average value, the rms and the linear slope in the pre-trigger region. In addition, the module performs a baseline restoration — a subtraction of the average baseline value to the trace — and provides the new signal to the other modules:
-
•
GEMDTrigger. The module implements a leading-edge discriminator with threshold defined dynamically as three times the rms of the signal baseline. After the trigger, the signal has to remain above threshold for at least 40 s, otherwise the trigger is rejected. Before searching for the trigger, the pulse is integrated using a 160 ns moving average filter in order to reduce the high-frequency noise.
-
•
GEMDFTTrigger. The module applies to the input signal a 1.5 s moving differentiation filter and a 1 s moving average filter for noise reduction (see Figure 3). The resulting trace has a peak for each sharp variation of the signal (such as the leading edge of a pulse) and is analyzed by a leading-edge discriminator. The peak width is similar to the size of the moving differentiation and was chosen to maximize the pile-up identification efficiency and to avoid the mis-identification of highly-multiple-site events. The number and the position of the peaks are estimated by applying a leading-edge discriminator, whose threshold is four times the rms of the baseline. After this condition is met, the signal must remain above the threshold for at least 1 s. While GEMDTrigger is tuned to determine the trigger position with high precision and stability (it requires that the signal remains above the threshold for 40 s), this module is important to identify events with multiple physical signals occurring within the same trace.
-
•
GEMDEnergyGauss. The module reconstructs the event energy using an approximate Gaussian filter [8]. The pulse is differentiated by a moving differentiation filter and then integrated 15 times by a moving average filter to achieve an approximated Gaussian shape111Historically, the energy reconstruction filters for -ray spectroscopy also perform a deconvolution of the exponential function which is folded in the signal by the charge sensitive pre-amplifier. However, the approach suggested in this paper was found to provide better results on the Gerda data with respect to the usual filters. . The energy information is eventually stored in the maximum amplitude of the quasi-Gaussian pulse. The width of the moving filters has been set to 10 s in order to minimize losses due to ballistic effects. The intermediate steps of the shaping are shown in Figure 3.

Figure 2: Digital signal processing performed by GEMDFTTrigger. The incoming signal (top trace) is differentiated (middle) and then integrated. Each sharp variation of the incoming pulse creates a peak in the output trace (bottom trace). 
Figure 3: Digital signal processing performed by GEMDEnergyGauss. The incoming signal (top trace) is differentiated (second trace) and then integrated several times (following traces) by a moving average filter. -
•
GEMDRiseTime. The module computes the rise time between 10% and 90% of the maximum amplitude of the pulse. The maximum amplitude is computed as the difference between the maximum of the pulse and the average baseline value. Then, the first samples below the 10% and 90% of the maximum amplitude are found by moving backwards from the position of the maximum.
The second chain is used to evaluate parameters relevant for pulse shape discrimination techniques and it will be better defined during the future data taking. The chain presently includes only one module, GEMDCurrentPSA, which computes the current pulse as the derivative of the signal and then extracts the basic features of the current peak, like rise time, width and area.
3 Data selection and monitoring
In the Gerda data sets there are two main classes of signals that have to be identified and tagged: 1) signals corrupted or produced by non-physical events, i.e. discharges, cross-talk, pick-up noise; 2) signals which are not properly processed along the analysis pipeline, as pile-ups and accidental coincidences.
The first class includes signals with anomalous shape, wrong polarity, extremely short/long rise time or exceeding the dynamic range of the FADC (see Figure 5). To identify these events a sequence of cuts based on four parameters is applied. The first parameters are the trigger position computed by GEMDTrigger and the time position of the maximum amplitude of the Gaussian pulses (maxAmpTime) computed by GEMDEnergyGauss. If the signal has a leading edge at the proper position, followed by an exponential decay tail due to the charge sensitive pre-amplifier, then the trigger has to be reconstructed roughly in the center of the trace and maxAmpTime has to be in a well-defined range. The third parameter is the 10-90% rise time which can be used to identify signals that are extremely fast or slow, and hence inconsistent with well-behaved physical events. Finally, signals that saturate the dynamic range of the FADC are identified by scanning the individual samples of the traces.
The second class includes signals generated by the superimposition of multiple physical pulses, or having the leading edge not aligned with the center of the trace (see Figure 5).


These signals can be identified using the baseline slope computed by GEMDBaseline, the number of pulses provided by GEMDFTTrigger and the trigger position yielded by GEMDTrigger. Their amount is proportional to the event rate and can reach up to 15% in the calibration data sets, while it is usually negligible in the physics data sets. Therefore, the identification of these signals is a critical issue to derive from the calibration data a sample of events which is as similar as possible to the physics run data.
Besides cuts for removing undesirable classes of signals, there are also parameters which can be used to monitor the quality of the data taking and the stability of the set-up, the most important being the average value and the rms of the baseline. These parameters are sensitive to noise changes and to gain variations in the read-out chain. Figure 6 shows these parameters as a function of time for a 10-day commissioning run.

The parameters are stable over the whole data taking, except for a few hours during day 7. These instabilities can be correlated with hardware operations in the set-up and the corresponding data can be removed by applying a cut on the two parameters.
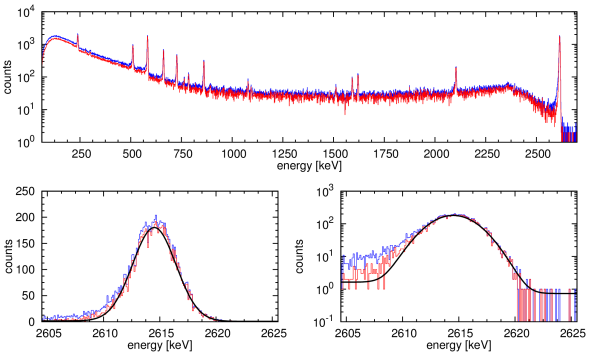
The results of the data selection performed according to the criteria described above are shown in Figure 7. The figure shows the energy spectrum of a HPGe detector operated in the Gerda set-up irradiated with a 228Th source. The cuts remove efficiently bad signals and pile-up events, improving the shape of the -ray peaks and the agreement with the standard analytical functions used to model -line peaks.
4 Conclusions
The Gerda experiment is currently starting the data taking of Phase I. The off-line analysis of the HPGe detector signals will be performed with the Gelatio software framework, a tool specifically developed for Gerda, which supports a multi-channel analysis and implements a signal processing based on a modular approach. A reference analysis pipeline has been defined and optimized. The signal processing is performed along chains of modules and includes the estimate of the trigger position, of the amplitude and of several basic pulse shape analysis parameters. The digital filters have been improved and optimized during the Gerda commissioning phase and the shaping parameters have been tuned. Also, a set of cuts has been defined to identify signals induced by non-physical events or signals which are not properly processed. In addition, a set of parameters was identified to monitor the data quality and possibly to discriminate corrupted data.
The software and the digital filters have been validated during the Gerda commissioning and in several R&D activities related to the experiment. The new pipeline has been tested and it proved to be stable and ready to be used for the reference analysis of Gerda Phase I data.
We would like to acknowledge our colleagues of the Gerda Collaboration, especially D. Budjáš and B. Schwingenheuer, for many invaluable advices concerning signal analysis and data quality control. We want also to thank C. A. Ur, D. Bazzacco and T. Kihm for all the stimulating discussions and suggestions concerning digital signal processing and the algorithms used in -ray spectroscopy.
This work was supported in part by the Transregio Sonderforschungsbereich SFB/TR27 “Neutrinos and Beyond” by the Deutsche Forschungsgemeinschaft and by the Munich Cluster of Excellence “Origin and Structure of the Universe”.
References
References
- [1] GERDA Collaboration, Abt I et al. 2004 GERDA: The GERmanium Detector Array for the Search of Neutrinoless Decay of 76Ge at LNGS Laboratori Nazionali del Gran Sasso - Proposal \nonumGERDA Collaboration, Schönert S et al. 2005 The GERmanium Detector Array (GERDA) for the search of neutrinoless beta beta decays of Ge-76 at LNGS Nucl. Phys. Proc. Suppl. B 145 242-245
- [2] Gunther M et al. 1997 Heidelberg - Moscow beta-beta experiment with Ge-76: Full setup with five detectors Phys. Rev. D 55 54-67 \nonumKlapdor-Kleingrothaus H V, Krivosheina I V, Dietz A and Chkvorets O 2004 Search for neutrinoless double beta decay with enriched Ge-76 in Gran Sasso 1990-2003 Phys. Lett. B 586 198-212 \nonumIGEX Collaboration, Aalseth C E et al. 2002 The IGEX Ge-76 neutrinoless double beta decay experiment: Prospects for next generation experiments Phys. Rev. D 65 092007
- [3] CANBERRA Broad Energy Ge (BEGe) Detector, URL http://www.canberra.com/products/485.asp
- [4] Budjáš D, Barnabé Heider M, Chkvorets O, Khanbekov N and Schönert S 2009 Pulse shape discrimination studies with a Broad-Energy Germanium detector for signal identification and background suppression in the GERDA double beta decay experiment JINST 4 P10007 (preprint arXiv:0909.4044) \nonumAgostini M et al. 2011 Signal modeling of HPGe detectors with a small read-out electrode and application to neutrinoless double beta decay search in Ge-76 JINST 6 P03005 (preprint arXiv:1012.4300) \nonumGonzalez D et al. 2003 Pulse shape discrimination in the IGEX experiment Nucl. Instrum. Meth. A 515 634-643 \nonumHellmig J and Klapdor-Kleingrothaus H V 2000 Identification of single-site events in germanium detectors by digital pulse shape analysis Nucl. Instrum. Meth. A 455 638-644
- [5] Agostini M, Pandola L, Zavarise P and Volynets O 2011 GELATIO: a general framework for modular digital analysis of high-purity Ge detector signals JINST 6 P08013 (preprint arXiv:1106.1780)
- [6] Agostini M et al. 2011 The MGDO software libraries for Germanium neutrinoless double beta decay experiments J. Phys.: Conf. Series to appear in TAUP 2011
- [7] MIZZI Computer Software GmbH, URL www.mizzi-computer.de \nonumIsocrate R et al. 2004 MD2S - Digital sampling electronics for the MARS detector, A data acquistion system for the MD2S digital sampling electronics Laboratori Nazionali di Legnaro - Annual Report 226-227 \nonumUr C A et al. 2004 A data acquistion system for the MD2S digital sampling electronics Laboratori Nazionali di Legnaro - Annual Report 228-229
- [8] Smith S W 1999 The Scientist and Engineer’s Guide to Digital Signal Processing (California: California Technical Publishing San Diego)