Evidence for a non-universal stellar initial mass function in low-redshift high-density early-type galaxies
Abstract
We determine an absolute calibration of stellar mass-to-light ratios for the densest of early-type galaxies in the local universe (redshift ) from SDSS DR7. This sample of galaxies has, assuming a Chabrier IMF, effective stellar surface densities, , stellar population synthesis (SPS) stellar masses , and aperture velocity dispersions of (68% range). In contrast to typical early-type galaxies, we show that these dense early-type galaxies follow the virial fundamental plane, which suggests that mass-follows-light. With the additional assumption that any dark matter does not follow the light, the dynamical masses of dense galaxies provide a direct measurement of stellar masses. Our dynamical masses (), obtained from the spherical Jeans equations, are only weakly sensitive to the choice of anisotropy () due to the relatively large aperture of the SDSS fiber for these galaxies: . Assuming isotropic orbits () we find a median , consistent with a Salpeter IMF, while more bottom heavy IMFs and standard Milky-Way IMFs are strongly disfavored. Our results are consistent with, but do not require, a dependence of the IMF on dynamical mass or velocity dispersion. We find evidence for a color dependence to the IMF such that redder galaxies have heavier IMFs with . This may reflect a more fundamental dependence of the IMF on the age or metallicity of a stellar population, or the density at which the stars formed.
keywords:
galaxies: elliptical and lenticular, cD – galaxies: fundamental parameters – galaxies: kinematics and dynamics – galaxies: structure1 Introduction
The stellar initial mass function (IMF) is a fundamental property of a stellar population, with wide ranging implications for many areas of astrophysics. Observations in the Galactic disk suggest that the IMF has a power-law shape, , with at masses above (Salpeter 1955), and that it turns over at lower masses (Kroupa 2001; Chabrier 2003). For simplicity, the IMF is generally assumed to be universal, although there is increasing evidence that the IMF depends on the mass (or velocity) of a galaxy. Spiral galaxies require IMFs lighter than Salpeter (Bell & de Jong 2001; Dutton et al. 2011 a,b; Brewer et al. 2012) and maybe even lighter than Chabrier (Bershady et al. 2011). While elliptical galaxies favor Salpeter-type IMFs (Auger et al. 2010), and possibly bottom heavy () IMFs in the most massive ellipticals (van Dokkum & Conroy 2010).
Total mass measurements from dynamics or strong lensing only give an upper limit to stellar mass-to-light ratios due to the unknown dark matter fraction. However, if we can identify a population of galaxies that are baryon dominated (i.e., the dark matter fraction within a specific radius ), these can be used to provide a direct dynamical constraint to stellar mass-to-light ratios, and hence the IMF.
In this Letter we show that early-type galaxies with the highest stellar surface densities within an effective radius have a Fundamental Plane (FP; Dressler et al. 1987; Djorgovski & Davis 1987) correlation that is consistent with the virial prediction: At fixed SPS stellar mass, velocity dispersions and half-light radii scale as . This is strong evidence that the dynamical masses are proportional to the stellar masses. Under the additional assumption that any dark matter does not trace the light, the dynamical masses are equal to the stellar masses. Here we use spherical Jeans models to calculate dynamical masses and compare these with SPS stellar masses. We adopt a cosmology with , and .
2 SAMPLE SELECTION
Our selection of early-type galaxies is designed to select non-star forming galaxies regardless of their morphology or structure, and is the same as in Dutton et al. (2011a). Our starting sample consists of galaxies from the Sloan Digital Sky Survey (SDSS; York et al. 2000) data release seven (DR7) (Abazajian et al. 2009) with spectroscopic redshifts (), stellar velocity dispersions, , from the “Princeton” catalog, structural parameters (using the Sérsic plus fits) from Simard et al. (2011), and stellar masses computed assuming a Chabrier (2003) IMF from the MPA/JHU group (available at http://www.mpa-garching.mpg.de/SDSS/DR7/). We select galaxies that have been spectroscopically classified as early-type (eCLASS ), have red colors, and have minor-to-major axis ratios greater than 0.5. We also apply redshift dependent minimum stellar mass. Our selection yields early-type galaxies at redshifts of (68% range).
Using the stellar masses, , and the circularized band effective radii, , we compute the average surface density within the effective radius: . We select a sample of dense galaxies with the criteria . This yields galaxies, i.e., of our full early-type galaxy sample. While the exact value of this minimum density is somewhat arbitrary, its approximate value will become apparent below. In order to minimize the impact of galaxies scattered to high stellar densities by the dex measurement errors on stellar masses, we clean the sample by using the relation between and . This relation has a slope of and a scatter of dex. We remove the outlier galaxies that are more than offset from the median relation. This removes galaxies leaving a dense sample of .
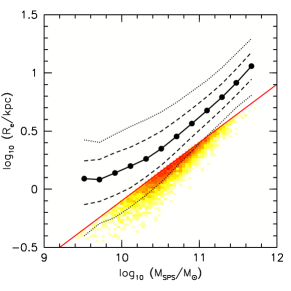
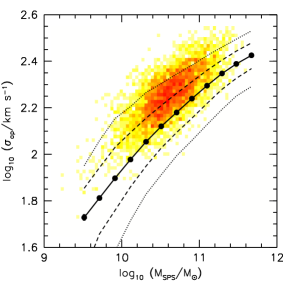
The velocity-mass and size-mass scaling relations for our full and dense samples of early-type galaxies are shown in Fig. 1. The median relations of the full samples are shown with points and solid lines, while the high density galaxies are shown with a color scale. In the size-mass relation our selection corresponds to a line of slope 1/2. All of the dense galaxies are offset by at least from the median size-mass relation. In the velocity-mass plane the dense galaxies have a slope of 0.25 and a are offset to high velocity dispersions.
3 EVIDENCE FOR MASS FOLLOWS LIGHT
The assumption of mass-follows-light (MFL) is sometimes used when modeling the stellar kinematics of luminous early-type galaxies (e.g., Cappellari et al. 2006). There are two issues with MFL models: 1) MFL models only provide an upper limit to the stellar mass due to the unknown dark matter fraction; 2) If there is a significant amount of dark matter, then the assumption of MFL likely fails and the dynamical masses will be biased. One can get around these two problems by selecting galaxies for which the dark matter fraction is negligible. To select such a sample we use the correlations between velocity and size at fixed stellar mass.
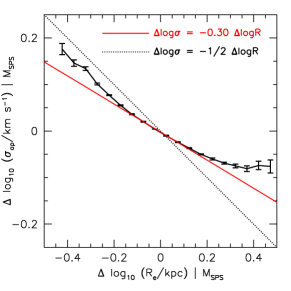
The simplest mass follows light models have the scaling . It is well known that the Fundamental Plane is tilted with respect to this model. Here we express the FP relation as the correlation between residuals from the velocity dispersion vs stellar mass () and effective radius vs stellar mass () relations. We label the slope of the correlation as . The value of is related to the dark matter fraction within the radius the velocities are measured (Courteau & Rix 1999; Dutton et al. 2007). Models with no dark matter nominally have , while dark matter dominated galaxies have .
In Fig. 2 the solid black line shows the FP relation for all early-type galaxies. Fitting a linear relation gives a slope (red line) which is shallower than the virial prediction (dotted line). This recovers the well known tilt of the FP. It is also apparent that the local value of varies monotonically with size offset. Galaxies with the most negative offsets have , while galaxies with the most positive offsets have . This trend is qualitatively consistent with the expectations for galaxies embedded in extended dark matter haloes.
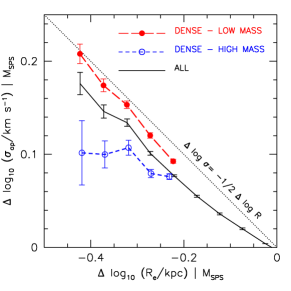
From Fig. 2 we see that galaxies with have a local slope of and thus are consistent with the assumption of MFL. This offset is the motivation behind our particular density selection as shown in Fig. 1. The colored points in Fig. 3 show the FP relation for galaxies in our dense sample, split into high and low stellar masses. The low mass galaxies in our sample, , (red points) have which suggests that these galaxies are dominated by stars within an effective radius (Courteau & Rix 1999). However, the massive galaxies, , (blue points) have a weaker correlation, suggesting that mass does not follow light.
The possibility that dark matter follows the light in the inner regions of elliptical galaxies has been discussed by Thomas et al. (2011). However, this scenario seems unlikely for our dense galaxies, since at the effective radius the slopes of the stellar mass profiles are , while the dark matter is expected to have .
Thus in what follows we can only strictly justify MFL models for the lower mass dense galaxies. However, using relations from Macciò et al. (2008) and Dutton et al. (2010), we estimate the dark matter fractions within to be just . We will still compute MFL models for the high mass dense galaxies, with the caveat that dark matter may provide a non-negligible contribution to the dynamical masses. Our dense-low mass sample consists of galaxies with median SPS masses , velocity dispersions , and fiber aperture radii of . The relatively large aperture radii results in an additional benefit when deriving dynamical masses from aperture velocity dispersions. For small apertures relative to the effective radius (e.g., one eighth of an effective radius), the derived dynamical masses are strongly dependent on the anisotropy profile. When the aperture is larger than the effective radius the anisotropy is only of secondary importance.
4 Dynamical mass vs Stellar Population Synthesis Mass
For each galaxy in our high-density sample we calculate a dynamical mass using the following procedure. Given a galaxy light profile (parameterized by circularized and deprojected Sérsic and components — see Dutton et al. 2011a) with mass normalized to , we calculate the radial velocity dispersion profile by solving the spherical Jeans equations assuming a constant anisotropy, (e.g., Binney & Mamon 1982). We then compute the projected velocity dispersion (convolved with 1.4 arcsec FWHM seeing) within the 3 arcsec diameter aperture used by SDSS. Finally, we compute a dynamical mass by scaling the model aperture velocity dispersion to match the observed aperture velocity dispersion:
Note that since the model velocity dispersions scale as (because we assume mass-follows-light) our dynamical masses are actually independent of the SPS masses. Our procedure also takes into account structural non-homology, which can significantly effect dynamical masses (e.g., Taylor et al. 2010). While our models do not account for rotation, Cappellari et al. (2006) have shown that two and three integral models yield dynamical masses that are consistent with those obtained from a simple virial relation for both fast- and slow-rotators, which thus supports our use of spherical Jeans models. In addition we have verified that the dynamical masses show no correlation with axis ratio.
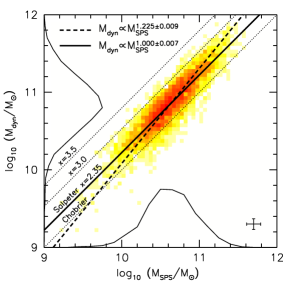
For isotropic orbits () the median offset between dynamical and SPS masses for the full dense sample is . For the low- and high-mass subsamples we find , and , respectively. As expected the dynamical masses are only weakly dependent on the assumed velocity anisotropy (). For reasonable values of velocity anisotropy () for early-type galaxies (Gerhard et al. 2001; Koopmans et al. 2009) the dynamical masses differ by just 4% (with lower dynamical masses for higher ). Thus, on average, our results are in excellent agreement with a Salpeter IMF (), but are strongly inconsistent with lighter Milky-Way IMFs (e.g., Kroupa 2001; Chabrier 2003), or heavier IMFs found in the centers of more massive ellipticals (van Dokkum & Conroy 2010).
4.1 Variation of the IMF with galaxy mass
Fig. 4 shows the relation between dynamical and SPS masses for . The dotted lines show the relations expected for various IMFs, ranging from Chabrier to . Due to the non-uniform distribution of (which is well approximated by a log-normal), and the scatter in of dex, the slope of the true relation between and will depend on the origin of the scatter. If the scatter is entirely due to the slope is (solid line), while if the scatter is entirely due to the slope is (dashed line). In practice there are likely errors on both masses, and the true slope of the relation between and will fall between these two limiting cases. The nominal measurement errors on of dex, imply a true relation of .
Since dynamical mass is proportional to the square of velocity dispersion, our results are consistent with the notion that the IMF depends on the velocity dispersion of the galaxy, with heavier IMFs in higher dispersion galaxies (Treu et al. 2010; van Dokkum & Conroy 2011). Such a trend is also consistent with the lighter IMFs favored for spiral galaxies (e.g., Bershady et al. 2011), which tend to have lower velocities than ellipticals. However, since velocity dispersion correlates with other physical galaxy properties (e.g., Graves et al. 2009), variation in the IMF may be driven by other properties of a stellar population, such as age or metallicity.
4.2 Variation of the IMF with galaxy color
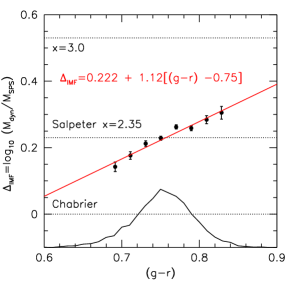
Fig. 5 shows that the IMF offset parameter is correlated with color, with the sense that redder galaxies have heavier IMFs. This relation is given by
| (1) |
Here the colors and luminosities have been k-corrected to (but not evolution corrected). Extrapolating Eq. 1 to bluer colors, a Chabrier IMF (i.e., ) occurs at a color of , which is typical for a late-type galaxy (e.g., Fig.1 of Dutton et al. 2011a).
A color dependence to the IMF could plausibly be related to the idea that the characteristic mass scale of the IMF is set by the Jeans mass of the ISM, which depends on both temperature and density (Bate & Bonnel 2005; Larson 2005). A density dependence would take the form of heavier IMFs for stars formed in denser regions. Since more massive galaxies formed their stars at higher densities, and more massive galaxies have older and redder stellar populations, it follows that galaxies that formed their stars at higher densities (with heavier IMFs) should have redder colors.
4.3 Dynamical mass-to-light ratio vs color
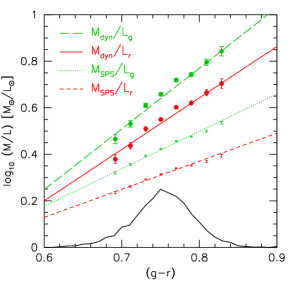
With the goal of providing a useful estimator of stellar mass-to-light ratios, Fig. 6 shows the relations between dynamical (and SPS) mass-to-light ratio vs color for a model with isotropic orbits . SPS mass-to-light ratios scale as and . These slopes are very similar to those of Bell et al. (2003), who report and for the - and -bands, respectively. The relations between dynamical mass-to-light ratios and color in the - and -bands from Fig. 6 are given by the following equations:
| (2) |
| (3) |
The steeper slopes of the vs. compared to the vs relations confirm that the trend between IMF offset and galaxy color shown in Fig. 5 is not due to correlations between and .
5 Summary
We have determined an absolute calibration of stellar mass-to-light ratios from the densest of early-type galaxies in the local universe (redshifts ) from the SDSS DR7. The fundamental plane scaling relations of these galaxies (with SPS masses , assuming a Chabrier IMF) are consistent with the virial plane: , suggesting that mass-follows-light. With the additional assumption that any dark matter will not follow the light, we infer that these galaxies are dominated by stars, i.e., they contain little or no dark matter within an effective radius.
We compute dynamical masses using spherical Jeans models with constant velocity anisotropy, . For isotropic orbits () the dynamical masses are on average dex heavier than the SPS masses obtained with a Chabrier (2003) IMF. For radially anisotropic orbits with the median offset is just 0.02 dex lower. The dependence on the anisotropy is small because the velocity dispersions are measured within a fairly large aperture: .
The relation between dynamical and SPS masses, , has a slope depending on the source of the scatter in this relation, with a most likely value of . Our results are thus consistent with, but do not require, a dependence of the IMF on dynamical mass or velocity dispersion. We find a strong dependence between and color, with the sense that redder galaxies have heavier IMFs. If this trend reflects a more fundamental dependence of the IMF on the age and/or metallicity of a stellar population, it implies that the IMF varies within as well as between galaxies.
Future applications of this method. This method has the potential to be applied to galaxies at higher redshifts, and thus probe the evolution of the IMF. Since the sizes of early-type galaxies are known to decrease as we look backward in time (e.g., Trujillo et al. 2006), we expect our method to be applicable to a larger fraction of early-type galaxies, and specifically higher mass galaxies, at higher redshifts.
Acknowledgments
We thank Tommaso Treu, Charlie Conroy and Frank van den Bosch for valuable discussions. A.A.D. acknowledges financial support from the Canadian Institute for Theoretical Astrophysics (CITA) National Fellows program.
References
- Abazajian et al. (2009) Abazajian, K. N., et al. 2009, ApJS, 182, 543
- Auger et al. (2010) Auger, M. W., Treu, T., Gavazzi, R., Bolton, A. S., Koopmans, L. V. E., & Marshall, P. J. 2010, ApJL, 721, L163
- Bate & Bonnell (2005) Bate, M. R., & Bonnell, I. A. 2005, MNRAS, 356, 1201
- Bell & de Jong (2001) Bell, E. F., & de Jong, R. S. 2001, ApJ, 550, 212
- Bell et al. (2003) Bell, E. F., McIntosh, D. H., Katz, N., & Weinberg, M. D. 2003, ApJS, 149, 289
- Bershady et al. (2011) Bershady, M. A., Martinsson, T. P. K., Verheijen, M. A. W., et al. 2011, ApJL, 739, L47
- Binney & Mamon (1982) Binney, J., & Mamon, G. A. 1982, MNRAS, 200, 361
- Brewer et al. (2012) Brewer, B. J., Dutton, A. A., Treu, T., et al. 2012, arXiv:1201.1677
- Cappellari et al. (2006) Cappellari, M., et al. 2006, MNRAS, 366, 1126
- Chabrier (2003) Chabrier, G. 2003, PASP, 115, 763
- Courteau & Rix (1999) Courteau, S., & Rix, H.-W. 1999, ApJ, 513, 561
- Djorgovski & Davis (1987) Djorgovski, S., & Davis, M. 1987, ApJ, 313, 59
- Dressler et al. (1987) Dressler, A., Lynden-Bell, D., Burstein, D., et al. 1987, ApJ, 313, 42
- Dutton et al. (2007) Dutton, A. A., van den Bosch, F. C., Dekel, A., & Courteau, S. 2007, ApJ, 654, 27
- Dutton et al. (2010) Dutton, A. A., Conroy, C., van den Bosch, F. C., Prada, F., & More, S. 2010, MNRAS, 407, 2
- Dutton et al. (2011a) Dutton, A. A., Conroy, C., van den Bosch, F. C., et al. 2011a, MNRAS, 416, 322
- Dutton et al. (2011b) Dutton, A. A., Brewer, B. J., Marshall, P. J., et al. 2011b, MNRAS, 417, 1621
- Gerhard et al. (2001) Gerhard, O., Kronawitter, A., Saglia, R. P., & Bender, R. 2001, AJ, 121, 1936
- Graves et al. (2009) Graves, G. J., Faber, S. M., & Schiavon, R. P. 2009, ApJ, 693, 486
- Koopmans et al. (2009) Koopmans, L. V. E., Bolton, A., Treu, T., et al. 2009, ApJL, 703, L51
- Kroupa (2001) Kroupa, P. 2001, MNRAS, 322, 231
- Larson (2005) Larson, R. B. 2005, MNRAS, 359, 211
- Macciò et al. (2008) Macciò, A. V., Dutton, A. A., & van den Bosch, F. C. 2008, MNRAS, 391, 1940
- Salpeter (1955) Salpeter, E. E. 1955, ApJ, 121, 161
- Simard et al. (2011) Simard, L., Mendel, J. T., Patton, D. R., Ellison, S. L., & McConnachie, A. W. 2011, ApJS, 196, 11
- Taylor et al. (2010) Taylor, E. N., Franx, M., Brinchmann, J., van der Wel, A., & van Dokkum, P. G. 2010, ApJ, 722, 1
- Thomas et al. (2011) Thomas, J., Saglia, R. P., Bender, R., et al. 2011, MNRAS, 415, 545
- Treu et al. (2010) Treu, T., Auger, M. W., Koopmans, L. V. E., Gavazzi, R., Marshall, P. J., & Bolton, A. S. 2010, ApJ, 709, 1195
- Trujillo et al. (2006) Trujillo, I., Förster Schreiber, N. M., Rudnick, G., et al. 2006, ApJ, 650, 18
- van Dokkum & Conroy (2010) van Dokkum, P. G., & Conroy, C. 2010, Nature, 468, 940
- van Dokkum & Conroy (2011) van Dokkum, P. G., & Conroy, C. 2011, ApJL, 735, L13
- York et al. (2000) York, D. G., et al. 2000, AJ, 120, 1579