DISTINCT OXYGEN HOLE DOPING IN DIFFERENT LAYERS OF SUPERLATTICES
Abstract
X-ray absorption in (SCO-LCO) superlattices shows a variable occupation with doping of a hole state different from holes doped for in bulk and suggests that this hole state is on apical oxygen atoms and polarized in the plane. Considering the surface reflectivity gives a good qualitative description of the line shapes of resonant soft X-ray scattering. The interference between superlattice and surface reflections was used to distinguish between scatterers in the SCO and the LCO layers, with the two hole states maximized in different layers of the superlattice.
I Introduction
Hole doping of is described in the Zhang-Rice singlet (ZRS)-upper Hubbard band (UHB) model for as ZRS states on in-plane oxygen atoms. These holes are visible as a feature in X-ray absorption spectroscopy (XAS) at the O K edge, called the mobile carrier peak (MCP). The MCP gains intensity with doping at the expense of LHB (lower Hubbard band) states and concurrent “spectral weight transfer” from UHB states. This model, expanding the Cu one-band Mott-Hubbard model to the Cu , O , O three bands of the planes, describes well the variation, observed with XAS at the O K edge, of unoccupied density of states in cuprates for relatively low doping () 1991Eskes ; 1991Chen .
However, the variation of the maximum critical temperature between different superconducting compounds cannot be explained within the UHB-ZRS model and its in-plane orbitals only and possible extensions of the model to out-of-plane orbitals have been intensively investigated. Since there can be only one Fermi surface for an isolated plane, other indications of the relevance of out-of-plane orbitals came from angle-resolved photoemission (ARPES) measurements of square- and diamond-shaped Fermi surfaces for (Ref. 3) and (Ref. 4). The most relevant out-of-plane orbital that hybridizes with states in the plane is the apical oxygen orbital mixed with the Cu (Refs. 5,6) or (Ref. 7) orbital in the planes. The occupation of the apical oxygen orbitals modifies the bond valence sums and was used to explain general trends of . 1990deLeeuw ; 1991Ohta The effect of apical oxygen energy level on parameters of an expanded model has been considered for different materials. 2009Yin In contrast, the axial hybrid between the O and Cu orbitals, with -states occupied, has been addressed in Ref. 7. These calculations predicted that an empty apical oxygen orbital modifies the in-plane hole hopping parameter between sites along the orthorhombic axes, consistent with ARPES measurements, with a suppressed from the presence of unoccupied apical oxygen orbitals correlating with a smaller . 2009Yin ; 2001Pavarini ; 1996Raimondi
In addition, the depletion of the UHB states in bulk at , 1991Chen shows that the ZRS-UHB model also needs to be modified to describe the hole doping for higher . However, because of limits of bulk crystal growth, doping dependence studies have been limited to doping near , realized in bulk with a very large , 2006Yang ; 1994Al-Mamouri ; 1999Choy ; 1994Shimakawa ; 1995Zhang ; 2007Yang ; 2009Geballe where the oxygen atoms are removed from the structure (), and for relatively low , near the superconducting dome, where there is evidence of a qualitative change with in the doping process near . Specifically, the effective Cu ion magnetic moment in and the magnetic exchange between Cu spins are strongly reduced 1989Johnston at and the -independent Pauli paramagnetism is replaced at by -dependent Curie paramagnetism with increased doping. 2005Wakimoto Calculations 1991DiCastro ; 1992Feiner suggested that the doping mechanism is different for , as the number of -symmetry states, related to the Cu orbital 2009Yin and exceeding the optimal doping , correlated with . A small but growing contribution from apical oxygen orbital holes mixed with Cu orbitals at MCP was inferred from angle-resolved XAS measurements 1992Chen and from the variation of the Cu-apical oxygen distance with doping 2005Bozin , which also correlates with a variation in . 2009Butko ; 2003Karimoto Recently, a saturation of the XAS MCP intensity with increasing doping near was observed 2009Peets and dynamical mean-field theory calculations 2010Millis concluded that either additional orbitals become relevant in this doping range or that new model parameters would be needed to account for multiple-hole interactions. The additional orbital or band to consider in the hole doping process between and is not known.
In this study, doping in the range , inaccessible with bulk crystal growth techniques, was obtained with (SCO-LCO) superlattice (SL) growth. We observed that occupations of two distinct oxygen hole states are gradually modified with doping. Using the interference of the SL reflections with the surface reflection, we determined that the two hole states are maximized in different layers. This suggests that the states emptied preferentially in the SCO layers are the additional states in the extension of the ZRS-UHB model to this doping range.
II Experiments
II.1 Superlattice structure
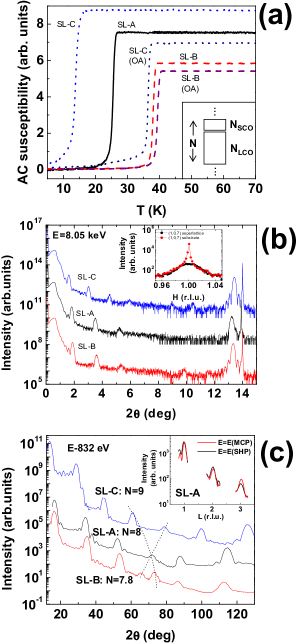
The superlattice samples were grown by molecular beam epitaxy on (LSAO) substrates at Brookhaven National Laboratory. Three SL, called SL-A, SL-B and SL-C in the following, were chosen after atomic force microscopy (AFM) and hard X-ray diffraction (HXD) measurements. HXD measurements [Fig. 1(b)] were made using a Philips X’ Pert diffractometer. From a Nelson-Riley fitting, the number of layers in one superperiod for SL-A and SL-C is and respectively, where is the average d-spacing of one SL “formula-unit” layer (half the unit cell), given by the (002) reflection. The SL structure was further characterized with resonant soft X-ray scattering (RSXS) measurements at beamline X1B at the National Synchrotron Light Source. Reflectivity measurements near the La edge [Fig. 1(c)] for , where is the scattering momentum in units of SL superperiod , show superperiods with an integer number of layers, and for SL-A and SL-C respectively, consistent with the HXD measurements. The slightly worse SL-B has . The thickness of the SCO layers within a SL superperiod is for all samples, but somewhat larger for SL-A compared to SL-B or SL-C, because of larger doping (Sec. II B). The number of repeats was 8, 7 and 8 for SL-A, SL-B and SL-C, respectively. A sketch of one SL superperiod is shown in Fig. 1(a) (inset).
The superconducting critical temperatures from AC susceptibility measurements were 25 K for SL-A, 38/39.5 K for for SL-B and 14/36.5 K for SL-C, where the first and second values for SL-B and SL-C are for measurements before and after ozone annealing at for min [Fig. 1(a)]. AFM images were taken on a Dimension 3100 instrument. They showed a surface covered by islands approximately 150 nm wide and 2 nm high for SL-B (data not shown); SL-A or SL-C did not have these features. The AFM surface RMS roughnesses for SL-A, SL-B and SL-C were 0.61 nm, 0.76 nm, and 0.43 nm, respectively.
The interface roughness can be characterized with HXD reflectivity. The reflection width [Fig. 1(b)], dominated by the total SL thickness and not sufficiently sensitive to small-scale roughness, was approximately the same for all SL. However, the linewidth was the same for SL-A and SL-C and higher for SL-B. Also, the ratio was the same for SL-A and SL-C and smaller for SL-B. These observations suggest that SL-A or SL-C have a smaller interface roughness than SL-B, consistent with the AFM and superperiod measurements. In addition, although the surface roughness of SL-A is larger than that of SL-C, their interface roughnesses are similar. This will be used to explain the difference in scattering at the O edge between SL-A and SL-C (Sec. III B). For an estimate of the doping range we use a SL interface RMS roughness . The maximum Sr doping is estimated with either a “flat-top” or a Poisson distribution as and for a SL with 2 ML and 3 ML thick SCO layers, respectively, outside the current possibilities of bulk crystal growth. Therefore, the middle nominally SCO layer in a 3 ML thick SCO layer is approximately and the two nominally SCO layers in a 2 ML thick SCO layer are approximately . The shorthand notation “SCO” and “LCO” from the deposition sequence will continue to be used for simplicity for the SL layers. Our conclusions do not depend on the exact values of SCO and LCO layer thickness or interface roughness.
II.2 Oxygen edge fluorescence yield
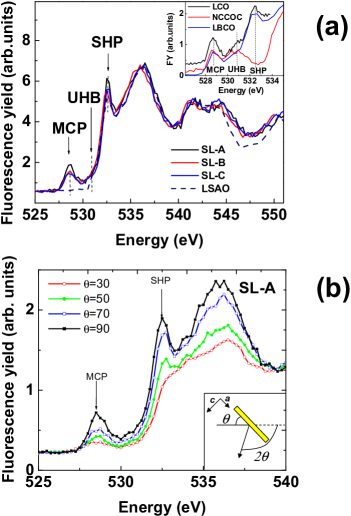
The first indication of hole doping at two distinct energies comes from XAS measurements with fluorescence yield (FY) detection and -polarized incident light, made at beamline X1B at the National Synchrotron Light Source. The sample and detector angles were and respectively, defined as shown in Fig. 2(b) (inset). SL measurements are shown in Fig. 2(a). FY of bulk (LSCO) has three main low-energy features 1991Chen : the MCP of the ZRS state, the UHB feature and a peak called here the “second hole peak” (SHP). The highest peak at , sometimes associated with orbitals mixed with La states 1991Kuiper , is followed by “continuum oscillations”. There is no clearly discernible UHB peak in SL FY. The UHB intensity in bulk LSCO is negligible 1991Chen for ; therefore, the nominally undoped LCO layers in the SL are instead thoroughly doped with MCP holes (the occupation factor ), consistent with estimates based on roughness and hole diffusion length 2009S .
The SL FY spectra in Fig. 2(a) have been aligned below and above the edge. The alignment normalizes out the variation in the number of oxygen atoms and therefore, the remaining differences between FY spectra are due to electronic contrast from the difference in valences of oxygen atoms. For SL-A and SL-C this occurs exclusively at MCP and SHP energies. Therefore, the SHP peak is related to doping of oxygen states, not to a structural defect, e. g. a vacancy or interstitial oxygen. Further support for this interpretation comes from FY measurements of bulk LSAO, where the SHP peak is observed (Fig. 2); since LSAO has no vacancies or interstitial atoms, SHP cannot be related to these defects. This is also consistent with the observation that SL-A has a larger SHP intensity than SL-C, while compounds without apical oxygen atoms, e. g. NCCOC, have a smaller intensity at SHP [Fig. 2(a), inset]. These FY results are a clear indication that the ZRS-UHB model extension in our doping range beyond the MCP and UHB levels is related to SHP and not to the vacancies of bulk SCO.
The SHP energy is relatively insensitive to the type of oxygen neighbors. For instance, it is not influenced by the Cu states since in LSAO has no states or by replacing La with Sr. The FY increase from SL-C to SL-A is at the same energy (SHP) as the energy of a peak of the undoped LCO compound, which suggests that the SHP state, partly empty in undoped LCO, is gradually emptied further, rather then removed, with additional hole doping in SL-A compared to SL-C; that is, doping also makes holes at SHP. Therefore, the total numbers of MCP and SHP holes in one superperiod are related by the charge conservation equation as , where sums over one superperiod, is the number of SCO layers and is the total number of doped holes in one superperiod (each layer dopes 2 holes when ).
Knowledge of the SCO oxygen vacancy site would suggest the site of SHP; however, the question of the vacancy site is not settled. 2009Geballe The absence of this feature in the cuprate NCCOC, which does not have the apical oxygen (Fig. 2), suggests that SHP is an apical oxygen state. It is possible that SHP is absent in NCCOC for other reasons than the absence of the apical oxygen. For instance, in an alternative view of angle-resolved FY measurements on bulk LNO 1991Kuiper ; 1998Kuiper , SHP are considered in-plane oxygen states mixed with Ni, and polarized in-plane. However, the SHP energy is not influenced by the Cu states or replacing La with Sr, which suggests various hybridizations are not essential. The incipient out-of-plane doping for low (Refs. 2, 22) supports the view that doping is not confined to the planes for high . Indeed, more detailed early calculations of the system 1988Guo suggested that the shift with doping in the relative alignment of the in-plane [O(1)] oxygen and apical [O(2)] oxygen ionization potentials will eventually lead to the preferential emptying of the apical oxygen orbitals at larger . If SHP is an apical state, the Cu ions would be surrounded by holes on all six neighboring oxygen atoms. This transition to a gradual emptying of apical oxygen orbitals, balancing the valences of all six oxygen atoms near a Cu site (this hole distribution is seen in undoped 1991Kuiper ) is a sensible intermediate step toward the process of vacancy creation in SCO. This kind of change with doping in the site of the doped holes has been seen in other cuprates, for instance in , where the holes stay in chains in Cu and O orbitals up to , only then doping the oxygen states in the planes. 2006Liang ; 2011Hawthorn
To address the question of the orientation of the state behind SHP, angle-resolved FY measurements have been made. A quantitative analysis of the angular dependence of FY requires measurements on bulk crystals cut at a series of angles with respect to the crystallographic planes, to account for footprint and self-absorption effects 1993Eisebitt . Superlattice samples cannot be grown at arbitrary angles. However, the SL footprint effects are almost identical for MCP and SHP energies because of the very similar scattering geometry. Self-absorption effects would have to be very strong for the observed suppression of intensity at SHP. That SL self-absorption effects are relatively small is supported by the very small difference in the momentum linewidth between MCP and SHP [Fig. 1(c), inset], which shows that the entire SL is probed at both energies. In addition, the O edge step height is approximately the same before the alignment in Fig. 2(b), which also suggests that self-absorption effects are relatively small at the O edge.
The MCP and SHP intensities follow a similar angular dependence [Fig. 2(b)]. We assume that the SHP state can be associated with a single orbital (if localized) or a collection of orbitals of the same type (if delocalized, as for the ZRS state, corresponding to MCP), in which case the SHP state would correspond to a band of a specific symmetry. The similar variation with angle of MCP and SHP intensity in angle-resolved FY measurements [Fig. 2(b)] suggests that the state corresponding to the SHP energy is oriented as the in-plane ZRS. Also, the MCP and SHP scattering amplitudes remain similar over a wide angular range (Fig. 4), which would be difficult to explain if they were polarized in different directions. Therefore, our data provide evidence that SHP is a state at the apical oxygen site polarized in the plane. There are three relevant apical oxygen orbitals: pointing to the Cu in the neighboring plane, pointing to Sr or La in the same LaO plane and pointing to the Sr or La in the neighboring LaO plane. The only possibility consistent with this interpretation is the orbital pointing to the La atoms in the same LaO plane.
II.3 Fluorescence yield and scattering at the La and Cu edges
RSXS can measure bulk 2002Abbamonte ; 2004Abbamonte ; 2005Abbamonte and SL 2007S ; 2009S ; S-LNOLCO charge order. SL scattering measurements were made with -polarized light at beamline X1B in an UHV diffractometer. Before the more complex SL reflectivity at the O edge, we present the measurements at the La and Cu edges, which will be used to illustrate the model of Sec. III A.
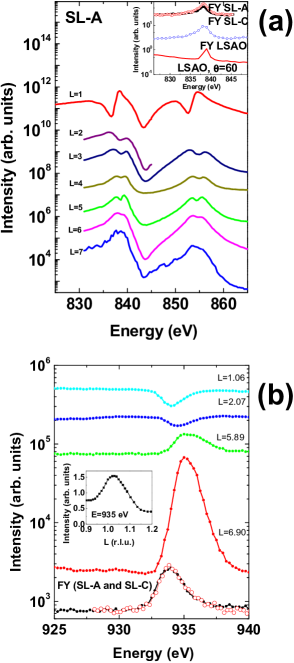
FY measurements at the La edge for SL-A and SL-C are shown in Fig. 3(a). The scattering contrast between the SL layers from to , , is given mainly by the difference between the number of La atoms in the LCO and SCO layers, and . Consistent with this observation, there is a large non-resonant tail in scattering at the La edge for SL peaks, which was used to characterize the SL structure [Fig. 1(c)]. The line shape in Fig. 3(a) is approximately the same for different because of the relatively small contribution from the surface reflectivity compared to the SL reflection (Sec. III A).
FY measurements at the Cu edge [Fig. 3(b)] are very similar for SL-A and SL-C; the scattering contrast at this edge is given by a small difference in the Cu valence, , the difference in the dispersion corrections at the Cu edge between the SCO and LCO layers. Even for the SL higher doping levels, holes do not appear to empty unusual Cu states, unlike the case of YBCO. 2011Hawthorn Small SL imperfections shift the peaks from integer values. The line shape changes with from a dip on resonance (low ) to a peak (high ). This change is not due to absorption (the calculated absorption depth is much larger than the SL thickness), refraction (from two-dimensional profiles, data not shown) or multiple-scattering at low (similar effects are seen at high in manganite SL, data not shown).
II.4 Scattering at the O edge
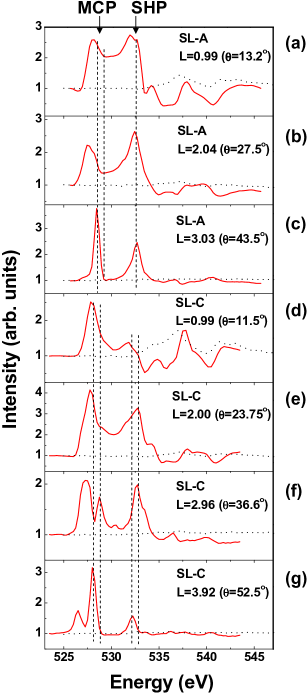
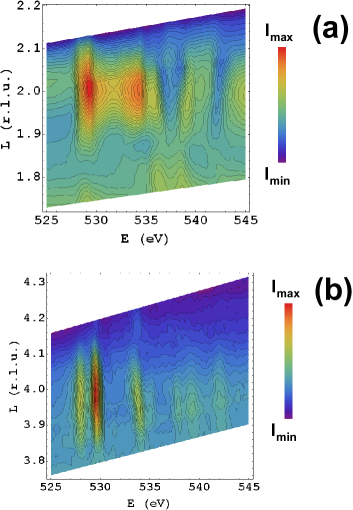
RSXS measurements at the O edge (Figs. 4 and 5) probe the spatial distribution of holes in the SL. Consistent with FY measurements (Sec. II B), the absence of a scattering peak at UHB shows that the UHB states have been uniformly removed in all layers. The scattering contrast in Fig. 4 occurs mostly at the two energies (MCP and SHP), where SL-A and SL-C differed in the FY (Fig. 2). Because scattering peaks at SL reflections (Fig. 5), the charge density is modulated at MCP and SHP energies between SCO and LCO layers of the SL.
Sharpening of the features is observed at higher (Fig. 4). The MCP and SHP peaks are well-separated (the additional splitting of the MCP in SL-C will be discussed in Sec. III B). It is difficult to explain this clear separation with a difference in the energy of the same MCP hole state in the LCO and SCO layers, given the inherent interface roughness of the structure. This is strong evidence for considering SHP a qualitatively distinct hole state.
The low L line shapes for SL-A, SL-B (not shown) and SL-C are more similar than the high L line shapes because of the reduced importance of roughness (Sec. III B). At low L, the energy profiles show increased intensity between MCP and SHP [Figs. 4 and 5(a)], unlike the La and edges (Fig. 3). Although the O edge line shapes are more complex, they can be qualitatively analyzed with the same model as for the La and Cu edges (Sec. III A). The difference in the MCP and SHP line shapes at low is due to different interference conditions with the surface reflection (Sec. III B).
Vacancies are present 2009Geballe in bulk SCO as well as at certain interfaces, even when the bulk materials do not contain vacancies. 2006Nakagawa If there were vacancies in the SCO layers or at interfaces, these would give a peak in scattering at all O edge energies. However, we do not observe large features above the SHP energy that would indicate a structural difference (either vacancies or oxygen atoms at interstitial sites), between the LCO and SCO layers (Fig. 5). Since the samples were annealed in ozone, the SCO layer thickness is relatively small, and there is little SL scattering at the O edge other than at MCP and SHP (Fig. 5), we will neglect vacancies in the following analysis, that is . The number of oxygen atoms is approximately the same throughout the SL, while their valence is different in the SCO and LCO layers, giving the scattering contrast. Therefore, SL scattering at the MCP and SHP energies probes the difference between SCO and LCO layers form factors , measuring the change in the dispersion corrections with doping.
III Discussion
III.1 Scattering model
To analyze the line shapes at the O edge, we develop a model for the interference between the surface and a SL reflection. The X-ray scattering intensity is , with the structure factor given by:
| (1) |
where is the incident X-ray energy, is the scattering momentum in the reflectivity geometry, and is the occupation factor in atomic plane of element and valence . S-LNOLCO The form factor for soft X-ray momenta is . For only one source of scatterers (), the variables and in the structure factor are separable, that is . This implies identical line shapes (up to an overall scaling factor) for the same edge at all . This is not observed at the Cu edge or for the MCP state [Figs. 3(a) and 4]. Therefore, at least two scattering sources, interfering in the total structure factor , need to be considered. “Stray light” only contributes an overall background level. To interfere, the contributions to must be coherent and of the same energy.
With the above approximation for , the structure factor for more than one type of scatterer (the condition of a SL) becomes:
| (2) |
where is the Fourier transform of the distribution of in-plane averages of the occupation factors for layer and element and valence . Considering only two elements, and as an example, and for all , we obtain a total structure factor made of two terms:
| (3) |
and
| (4) |
where , , are the number of ML in one A layer, one B layer and one superperiod, is the average of the SL layers form factors, is the contrast between the form factors of the SL layers, and the substrate contribution has been neglected.
A complex oxide SL has more than two constitutive elements. We neglect for soft X-ray momenta the small difference in between the and planes, or equivalently between oxygen sites O(1) (in-plane) and O(2) (apical), within 1 ML. In this case, becomes the average total form factor and Eqs. 3-4 can be applied by replacing with , with , and with , the total form factors of 1 ML.
The indices and are dotted with the light polarization vectors and as . Only the in-plane remains at the Cu edge, at MCP, as well as at SHP from the similar angular dependence of FY (Sec. II B). In this case, the angular dependence given by the double product simplifies to , with an additional factor [] that can be absorbed into the arbitrary units.
The momentum dependence of and in Eqs. 3-4 is contained in the functions , and . For a SCO-LCO superlattice with no roughness, they are ( is the number of repeats):
| (5) | |||
| (6) |
and
| (7) |
Except near , where is an integer, the functions and are related as . Therefore, they are out-of-phase:
| (8) |
where .
The term in Eq. 3 gives the reflection from the discontinuity in the index of refraction , or equivalently in the average form factor , at the sample surface. For a SCO-LCO SL, , which can be calculated from tabulated 1993Henke values. is made mostly of non-resonant terms at the Cu and O edges (but not at the La edge INPREP ) and, because of this, does not depend strongly on energy or polarization. Considering the substrate extends the sum in Eq. 2 to an infinite number of layers, with the function replaced by and replaced by , where is the substrate contribution and is a weighting factor which depends on the scattering geometry () and energy () through a variable absorption depth.
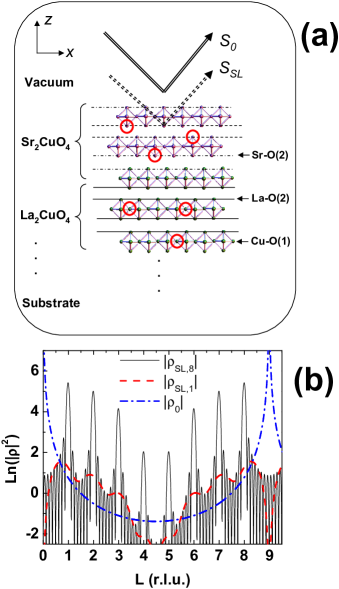
The term is the reflection from the SL modulation. The modulation of the La and Sr numbers in the SL also gives modulations of the form factors at the Cu () and O () edges. Therefore, the interference at different edges will be analyzed in terms of two main components: a SL reflection and a surface reflection [Fig. 6(a)]. Fig. 6(b) shows the functions and for a structure. The dependence of and is very different; while has peaks at , where is an integer, follows a momentum dependence with pronounced peaks at integer . is therefore much higher than at these values: . It would appear that the surface reflection can be neglected near SL reflections. However, is considerably larger than at certain edges, with the SL and surface structure factors comparable in magnitude .
Including both terms, the intensity of X-ray scattering can be written as:
| (9) |
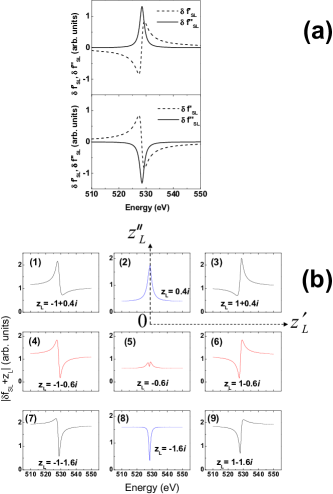
with (independent of ) absorbed into the arbitrary units. It is not possible at present to calculate from first principles the energy-dependent form factor for a correlated oxide SL. However, FY measurements (Fig. 2) show that the energies of MCP and SHP do not depend on the environment of the oxygen atom, which suggests a simplified model. Therefore, the line shapes at different edges will be modeled with a harmonic oscillator functional dependence. The function used for the imaginary part of the form factor is . This is Kramers-Kronig transformed to obtain the real part [Fig. 7(a)]. Fig. 7(b) shows for different .
The interference between the surface and superlattice terms can qualitatively describe the scattering line shapes at all edges. At the La edge, is comparable to , and little change of the resonance line shapes with is expected. Indeed, there is little change with at the La edge [Fig. 3(a)], except at low L. Measurements on the substrate at the La edge [Fig. 3(a)] indicate a strong resonance in , and therefore , which is responsible for the variation in the line shape at low . Refraction effects shift the peaks and complicate the interpretation of the measurements at low ; because of this, the measurements at the La edge will be discussed in detail separately. INPREP The scattering line shape at the and edges has the same shape because it originates in states on the same La atoms; this is in contrast to the scattering at the O edge at low , where the line shape at the MCP and SHP resonances is different (Sec. III B).
At the Cu edge, is the change in the dispersion corrections with doping and, because of the small modulation in the Cu valence, and . Strong interference effects are expected and observed [Fig. 3(b)]. The scattering shows a strong surface contribution to reflectivity. The non-resonant ( and ) form factors have large imaginary parts because of the neighboring La edge and the line shapes resemble those of panels (2) and (8) in Fig. 7(b).
The O edge scattering, with , is an intermediate case. is relatively large and is smaller than at the Cu edge, with the line shapes in a different region of Fig. 7(b): for low the MCP and SHP are of the type (4) and (6), for high of the type (5) and (2). Scattering line shapes are the most variable, with large complex changes with . The scattering at the O edge is analyzed in more detail in the next section.
III.2 Locus of MCP and SHP scatterers
Interference between the surface and the SL reflections determines the line shape. This can be used to find the locus of the MCP and SHP scatterers within the SL structure.
As pointed out, the functions cannot be calculated. However, the change with doping in the dispersion corrections at MCP and SHP energies can be estimated by looking at the difference in FY () between two differently-doped SL, which gives the scattering contrast between SL layers () in one SL (either SL-A or SL-C). Specifically, when comparing SL-A with SL-C, FY intensity increases concurrently at MCP and SHP [Fig. 2(a)]. Therefore, for both MCP and SHP energies, the difference in the dispersion corrections in the SCO and LCO layers is positive:
| (10) |
The Kramers-Kronig transform of a peak gives the shape shown in Fig. 7(a) (top panel) for .
However, measurements show line shapes for the MCP and SHP states with a mirror symmetry at and (Figs. 4 and 5). It is necessary therefore to consider the contribution to scattering of , the other factor in Eq. 9. Measured line shapes for MCP [of type (3)-(6)-(9), right side] and SHP [of type (1)-(4)-(7), left side] are on opposite sides of the complex plane in Fig. 7(b). Therefore, for MCP and SHP have opposite phases.
Considering the factors combined in , since is the same at MCP and SHP, and cannot change sign over the between the MCP to SHP energies, as evidenced by the weak energy dependence of the substrate reflection (Fig. 4) and the large non-resonant component of , the difference between must be in , the Fourier transforms of the distributions and of the occupation factors at the two energies. Because and are inversely proportional, also has opposite phases at the MCP and SHP energies:
| (11) |
Therefore, the distributions are out-of-phase, with the spatial distributions of the MCP and SHP holes (Eq. 11) related in the same way as the spatial distributions of the LCO and SCO layers in the SL (Eq. 8). Then, it is necessary that the MCP and SHP hole distributions peak in different layers.
This conclusion, using measurements at low , where roughness effects are less important, is independent of the thickness of LCO and SCO layers in one superperiod or roughness amplitude. Roughness effects become more important at higher , where the MCP and SHP line shapes resemble line shapes closer to the origin of the complex plane in Fig. 7(b). We consider the dependence of the intensity in Eq. 9, contained in the phase and amplitude. The phases for the MCP and SHP holes follow those of the LCO and SCO layers, which are linear functions of : and . The other contributing factor to the change in the line shape with , is the variation in the amplitude. For Gaussian roughness, the ratio in depends on the surface and the interface roughness as , where and . The factor becomes increasingly important at higher . Therefore, the linear increase of the phase with and the reduction in the amplitude of at higher for combine to make the vector spiral inward in the (, ) plane of Fig. 7(b) with increasing , systematically sampling different line shapes at the same edge.
Fig. 4(c) for SL-A, with the first peak in the split MCP almost absent, shows the interference line shape in a slightly different location in the plane of Fig. 7(b) than the location corresponding to the line shape in Fig. 4(g) for SL-C, where both peaks are visible at MCP. This divergence between measurements for SL-A and SL-C with increasing (Fig. 4) can now be explained by considering the different roughness of SL-A and SL-C. SL-A has a larger surface than SL-C (Sec. II A) but similar interface roughness . Therefore, is smaller for SL-A, which makes the end of the vectors for SL-A and SL-C follow slightly different trajectories with increasing in the plane of Fig. 7(b).
The interference between and , resembling multi-wavelength anomalous diffraction in molecular crystallography, allows determining the superlattice MCP and SHP hole distributions on a relatively large scale. To confirm the FY measurements of Sec. II B and the site of the SHP state within 1 ML, a fit with the interference model of Sec. III A would be necessary for higher wave vectors (), giving better spatial resolution. In future work, fitting the evolution of measured interference line shapes (Figs. 4 and 5) with would also allow obtaining , and the energy-dependent (on which the amplitude depends), and or (on which the phase depends).
The MCP and SHP hole distributions, maximized in different layers, are consistent with the observation that the MCP holes are mobile 2009S and that remotely doping a new distinct type of holes (SHP) in the LCO layers from the Sr in the SCO layers is an unlikely strong long-range process. In contrast, the SHP holes remain centered on the SCO layers. The relatively smaller number of MCP holes in the SCO layers is consistent with the saturation of FY in Ref. 25 and observations in Ref. 32, where the apical hole site is favored at high doping. The distributions of MCP and SHP holes are illustrated in Fig. 6(a).
IV Conclusion
Using X-ray absorption and resonant soft X-ray scattering, we found that doping in SCO-LCO superlattices empties two distinct oxygen hole states. The location of sub-surface scatterers within the superlattice was determined using the interference with the surface reflection, with the distributions of the two hole states maximized in different layers.
X-ray absorption measurements suggest that the hole state at the higher energy is on apical oxygen atoms and polarized in the plane. Since the creation of a vacancy removes two holes, this would suggest that the vacancies in bulk SCO are at the apical sites as well.
The increase in the density of the unoccupied states at SHP has to come from an occupied state. Photoemission experiments to determine if a change with doping occurs in the density of states of occupied states that mirrors the change with doping seen at SHP in this study would be interesting.
Calculations showed that making in-plane axial orbitals more localized, by gradually spatially removing the apical oxygen atoms, increases , 2001Pavarini and that, conversely, unoccupied apical oxygen orbitals lower . If similar ideas are applied to the SHP state, the doping of SHP holes might be responsible for the decrease of and the hole pair breaking at 1995Emery , and their partial removal, with the appearance of vacancies in SCO near , for the high of bulk SCO.
V Acknowledgments
We thank A. Gozar for useful discussions. This work was supported by the Department of Energy: RSXS measurements by grant DE-FG02-06ER46285, superlattice growth by MA-509-MACA, NSLS facilities by DE-AC02-98CH10886, and MRL facilities by DE-FG02-07ER46453 and DE-FG02-07ER46471. A. R. was also supported by MOE AcRF Tier-2 grant (MOE2010-T2-2-121) and NRF CRP.
References
- (1) H. Eskes and G.A. Sawatzky, Physical Review B 44, 9656 (1991).
- (2) C.T. Chen, F. Sette, Y. Ma, M.S. Hybertsen, E.B. Stechel, W.M.C. Foulkes, M. Schluter, S-W. Cheong, A.S. Cooper, L.W. Rupp, Jr., B. Batlogg, Y.L. Soo, Z.H. Ming, A. Krol, and Y.H. Kao, Physical Review Letters 66, 104 (1991).
- (3) K. Tanaka, T. Yoshida, A. Fujimori, D.H. Lu, Z.-X. Shen, X.-J. Zhou, H. Eisaki, Z. Hussain, S. Uchida, Y. Aiura, K. Ono, T. Sugaya, T. Mizuno, and I. Terasaki, Physical Review B 70, 092503 (2004).
- (4) F. Ronning, C. Kim, D.L. Feng, D.S. Marshall, A.G. Loeser, L.L. Miller, J.N. Eckstein, I. Bozovic, Z.-X. Shen, Science 282, 2067 (1998).
- (5) C. Di Castro, L.F. Feiner, and M. Grilli, Physical Review Letters 66, 3209 (1991).
- (6) L.F. Feiner, M. Grilli, and C. Di Castro, Physical Review B 45, 10647 (1992).
- (7) E. Pavarini, I. Dasgupta, T. Saha-Dasgupta, O. Jepsen, and O.K. Andersen, Physical Review Letters 87, 047003 (2001).
- (8) D.M. deLeeuw, W.A. Groen, L.F. Feiner, and E.E. Havinga, Physica C 166, 133 (1990).
- (9) Y. Ohta, T. Tohyama, and S. Maekawa, Physical Review B 43, 2968 (1991).
- (10) W.G. Yin and W. Ku, Physical Review B 79, 214512 (2009).
- (11) R. Raimondi, J.H. Jefferson, and L.F. Feiner, Physical Review B 53, 8774 (1996).
- (12) H. Yang, Q.Q. Liu, F.Y. Li, C.Q. Jin, and R.C. Yu, Applied Physics Letters 88, 082502 (2006).
- (13) M. Al-Mamouri, P.P. Edwards, C. Greaves, and M. Slaski, Nature 369, 382 (1994).
- (14) J. H. Choy, W. Lee, and S.-J. Hwang, Physica C 322, 93 (1999).
- (15) Y. Shimakawa, J.D. Jorgensen, J.F. Mitchell, B.A. Hunter, H. Shaked, D.G. Hinks, R.L. Hitterman, Z. Hiroi, and M. Takano, Physica C 228, 73 (1994).
- (16) H. Zhang, Y.Y. Wang, L.D. Marks, V.P. Dravid, P.D. Han, and D.A. Payne, Physica C 255, 257 (1995).
- (17) H. Yang, Q.Q. Liu, F.Y. Li, C.Q. Jin, and R.C. Yu, Physica C 467, 59 (2007).
- (18) T. H. Geballe and M. Marezio, Physica C 469, 680 (2009).
- (19) D.C. Johnston, Physical Review Letters 62, 957 (1989).
- (20) S. Wakimoto, R.J. Birgeneau, A. Kagedan, H. Kim, I. Swainson, K. Yamada, and H. Zhang, Physical Review B 72, 064521 (2005).
- (21) C. T. Chen, L.H. Tjeng, J. Kwo, H.L. Kao, P. Rudolf, F. Sette, and R. M. Fleming, Physical Review Letters 68, 2543 (1992).
- (22) E.S. Bozin and S.J.L. Billinge, Physical Review B 72, 174427 (2005).
- (23) V.Y. Butko, G. Logvenov, N. Bozovic, Z. Radovic, and I. Bozovic, Adv. Mater. 21, 1 (2009).
- (24) S. Karimoto, H. Yamamoto, H. Sato, A. Tsukada, and M. Naito, J. Low Temperature Physics 131, 619 (2003).
- (25) D.C. Peets, D.G. Hawthorn, K.M. Shen, Y.-J. Kim, D.S. Ellis, H. Zhang, S. Komiya, Y. Ando, G. A. Sawatzky, R. Liang, D.A. Bonn, and W.N. Hardy, Physical Review Letters 103, 087402 (2009).
- (26) X. Wang, L. de Medici, and A.J. Millis, Physical Review B 81, 094522 (2010).
- (27) S. Hendricks and E. Teller, Journal of Chem. Phys. 10(3), 147 (1942).
- (28) P. Kuiper, J. van Elp, G.A. Sawatzky, A. Fujimori, S. Hosoya, and D.M. de Leeuw, Physical Review B 44, 4570 (1991).
- (29) S. Smadici, J.C.T. Lee, S. Wang, P. Abbamonte, G. Logvenov, A. Gozar, C. Deville Cavellin, and I. Bozovic, Physical Review Letters 102, 107004 (2009).
- (30) S. Eisebitt, T. Boske, J-E. Rubensson, and W. Eberhardt, Physical Review B 47, 14103 (1993).
- (31) P. Kuiper, J. van Elp, D.E. Rice, D.J. Buttrey, H.-J. Lin, and C.T. Chen, Physical Review B 57, 1552 (1998).
- (32) Y. Guo, J.-M. Langlois, and W.A. Goddard III, Science 239, 896 (1988).
- (33) R. Liang, D.A. Bonn, and W.N. Hardy, Physical Review B 73, 180505 (R) (2006).
- (34) D.G. Hawthorn, K.M. Shen, J. Geck, D.C. Peets, H. Wadati, J. Okamoto, S.-W. Huang, D.J. Huang, H.-J. Lin, J. D. Denlinger, R. Liang, D.A. Bonn, W.N. Hardy, and G.A. Sawatzky, Physical Review B 84, 075125 (2011).
- (35) P. Abbamonte, L. Venema, A. Rusydi, G.A. Sawatzky, G. Logvenov, I. Bozovic, Science 297, 581 (2002).
- (36) P. Abbamonte, G. Blumberg, A. Rusydi, A. Gozar, P.G. Evans, T. Siegrist, L. Venema, H. Eisaki, E. D. Isaacs, and G.A. Sawatzky, Nature 431, 1078 (2004).
- (37) P. Abbamonte, A. Rusydi, S. Smadici, G.D. Gu, G.A. Sawatzky, and D.L. Feng, Nature Physics 1, 155-158 (2005).
- (38) S. Smadici, P. Abbamonte, A. Bhattacharya, X. Zhai, B. Jiang, A. Rusydi, J.N. Eckstein, S.D. Bader, and J-M. Zuo, Physical Review Letters 99, 196404 (2007).
- (39) S. Smadici, J.C.T. Lee, J. Morales, G. Logvenov, O. Pelleg, I. Bozovic, Y. Zhu, and P. Abbamonte, Physical Review B 84, 155411 (2011).
- (40) Manuscript in preparation.
- (41) N. Nakagawa, H.Y. Hwang, and D.A. Muller, Nature Materials 5, 204 (2006).
- (42) B.L. Henke, E.M. Gullikson, J.C. Davis, Atomic Data and Nuclear Data Tables 54, 181 (1993).
- (43) V.J. Emery and S.A. Kivelson, Nature 374, 434 (1995).