Extended hard X-ray emission from the Vela pulsar wind nebula
Abstract
The nebula powered by the Vela pulsar is one of the best examples of an evolved pulsar wind nebula, allowing to access the particle injection history and the interaction with the supernova ejecta. We report on the INTEGRAL discovery of extended emission above 18 keV from the Vela nebula. The northern side has no known counterparts and it appears larger and more significant than the southern one, which is in turn partially coincident with the cocoon, the soft X-ray and TeV filament towards the centre of the remnant. We also present the spectrum of the Vela nebula in the 18–400 keV energy range as measured by IBIS/ISGRI and SPI onboard the INTEGRAL satellite. The apparent discrepancy between IBIS/ISGRI, SPI, and previous measurements is understood in terms of point spread function, supporting the hypothesis of a nebula more diffuse than previously thought. A break at 25 keV is found in the spectrum within 6′ from the pulsar after including the Suzaku XIS data. Interpreted as a cooling break, this points out that the inner nebula is composed by electrons injected in the last 2000 years. Broad-band modeling also implies a magnetic field higher than 10 G in this region. Finally, we discuss the nature of the northern emission, which might be due to fresh particles injected after the passage of the reverse shock.
1 Introduction
Pulsar Wind Nebulae (PWNe) are the non-thermal bubbles inflated by the winds of rotation-powered pulsars. Recent observations have allowed to arrange the variety of their morphologies in an evolutionary sequence resulting from the interaction with their surroundings (Gaensler & Slane, 2006). A very complex phase occurs after the host remnant evolves into the Sedov-Taylor phase (10 kyr after the pulsar birth), when a reverse shock propagates inwards into the supernova ejecta and eventually collides with the PWN (van der Swaluw et al., 2001). Located at a distance of 290 pc (Dodson et al., 2003), the PWN powered by the Vela pulsar (PSR B0833–45, with spin-down luminosity erg s-1, and characteristic age 11.4 kyr; Dodson et al., 2007) is the best example of a PWN in such a phase, which is thought to be typical of composite supernova remnants.
The prime evidence of the pulsar wind is the structured PWN resolved by Chandra within 1′ from the pulsar (Helfand et al., 2001; Pavlov et al., 2001, 2003). The X-ray flux measured by Mangano et al. (2005) at varying integration radii shows that the Chandra PWN is surrounded by fainter emission up to at least 15′. At a larger scale, ROSAT found a X-ray filament (the so-called cocoon) extending 45′ south/south-west from the pulsar (Markwardt & Ögelman, 1995). The cocoon also stands out among the radio filaments composing the large (1.5∘ radius) Vela X nebula (Rishbeth, 1958). All these structures are embedded in the Vela supernova remnant, which has a radius of 4∘.
The cocoon is ascribed to an asymmetric reverse shock, which stripped the bulk of the particles from around the pulsar leaving a relic PWN (Blondin et al., 2001). This explanation has been confirmed by the detection of extended TeV emission matching the cocoon (Aharonian et al., 2006), with the brightness peak offset from the pulsar, and of thermal X-ray emission suggesting mixing with the shocked ejecta (LaMassa et al., 2008). However, an additional particle population, older and less energetic, is needed to explain the multiwavelength spectrum of Vela X (de Jager et al., 2008), complemented by the recent GeV detections by AGILE (Pellizzoni et al., 2010) and Fermi (Abdo et al., 2010). The angular resolution of IBIS/ISGRI on board the INTEGRAL observatory (Winkler et al., 2003) combined with its large field of view allows for the first time to address the problem of the full morphology of the hard X-ray nebula. Here we report on the INTEGRAL identification of extended hard X-ray emission from Vela.
2 Observations and analysis
2.1 IBIS/ISGRI imaging
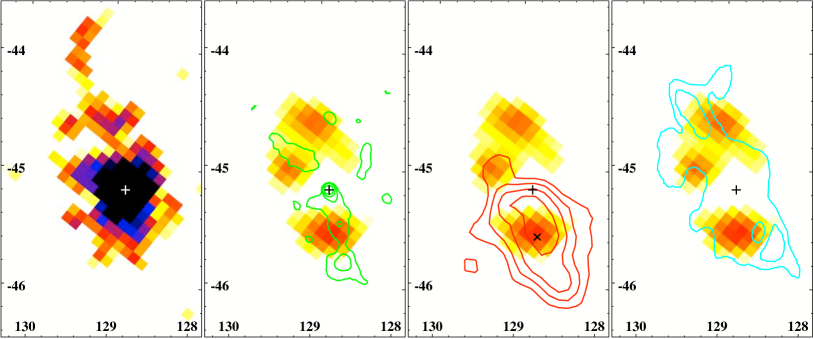
We analyzed all public INTEGRAL pointings within 12∘ from the Vela pulsar. We first analyzed the data from IBIS (Ubertini et al., 2003), the coded mask imager on board INTEGRAL, and in particular of its low energy detector ISGRI (15 keV–1 MeV, Lebrun et al., 2003). The IBIS/ISGRI data have been collected from 1976 pointings between 2003-03 and 2008-07, for a total exposure time of 5.6 Ms. In the 18–40 keV mosaicked image (Fig. 1), obtained with the Offline Scientific Analysis (Goldwurm et al., 2003) software v.8, we found a 110 point-like source at the pulsar position. The point spread function (hereafter PSF) encompasses the pulsar, the Chandra PWN, and part of the fainter region.
An extended emission in the NE/SW direction is also visible in the image, spanning 50′ on both sides. After subtraction of the point-like source by fitting it with a 2D Gaussian profile (′), the NE side appears larger and more significant than the SW side, which is coincident with the ROSAT and H.E.S.S. cocoon (Fig. 1, second and third panels). The extended emission also matches the one found by the Birmingham Spacelab 2 telescope in 2.5–10 keV (Fig. 1, fourth panel). The individual pixels of the IBIS/ISGRI feature are at the 3–6 significance level. Such a large cluster of low-significance pixels is not observed in the rest of the image, and it is not reminiscent of IBIS/ISGRI coding noise. After smoothing, it is the only residual excess besides the known point sources. A further evidence of extended hard X-ray emission beyond the inner PWN is provided by the spectral analysis.
2.2 INTEGRAL spectral analysis
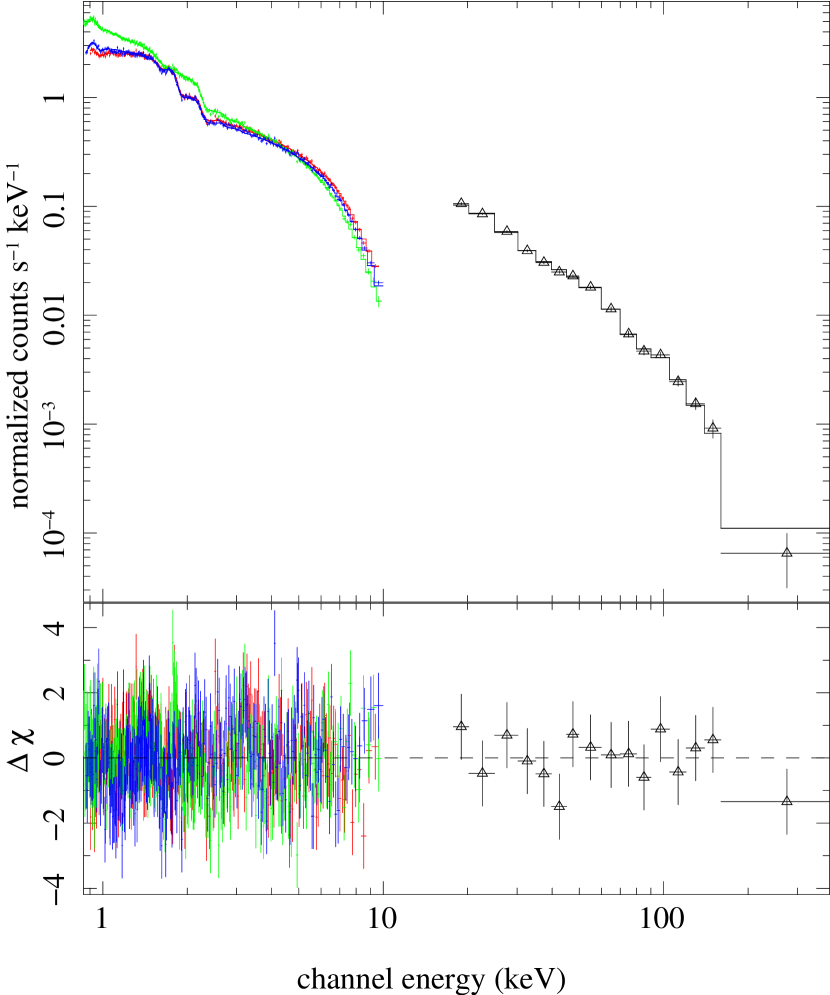
We extracted the IBIS/ISGRI spectrum of the point-like source from mosaicked images in narrow energy bands between 18 and 400 keV (Fig. 2). To account for the evolution of the instrument response, we produced an average of the responses weighted by the on-source exposures in their respective validity epochs. All the spectra in this work have been fitted using Xspec v.11.3 (Arnaud, 1996), and the uncertainties are reported at the 90% confidence level. A best fit with a single power law model yielded a photon index and a flux erg cm-2 s-1 in the 20–40 keV range (= 1.16/16 d.o.f.). This spectrum is 50 times higher than the phase-averaged one of the Vela pulsar at 20 keV (Hermsen and Kuiper, priv. comm.; Harding et al., 2002). Therefore, the IBIS/ISGRI emission is dominated by the nebula.
We also analyzed the data from the INTEGRAL spectrometer SPI (20 keV–8 MeV; Vedrenne et al., 2003) collected simultaneously to the IBIS data. SPI spectra have been extracted using the SPIROS package (Skinner & Connell, 2003) within the OSA analysis software. The SPI data are best fitted (= 0.7/10 d.o.f.) by a power law model in the 20–300 keV range with photon index , compatible within the errors with the IBIS/ISGRI one, but with a higher flux, erg cm-2 s-1 in 20–40 keV, with respect to IBIS/ISGRI. A joint fit to the IBIS/ISGRI and SPI spectra with a single power law yields a compatible photon index, but it requires a renormalization constant of 1.8 to recover the higher SPI flux. Such a discrepancy can not be accounted for by an intercalibration factor, which is in the 0.8–1.2 range for IBIS/ISGRI and SPI (e.g., Jourdain et al., 2008; Bouchet et al., 2009).
The photon index measured by BeppoSAX/PDS in the same energy range (, Mangano et al., 2005) is consistent with both the spectral indices derived above, whereas the flux lies between the IBIS/ISGRI and SPI one. As shown in Fig. 3, the IBIS/ISGRI, BeppoSAX/PDS, and SPI fluxes correlate with the respective PSF radii (HWHM: 6′, 39′111As the PDS had no imaging capabilities, this is the HWHM of the instrumental angular response (Frontera et al., 1997)., and 1.3∘), suggesting that each instrument samples a different portion of the nebula. Due to the coded mask deconvolution of IBIS/ISGRI, optimized for point sources, the reconstructed flux of an extended source of 60′ radius is lower than the real one by a factor 50 (Renaud et al., 2006). Therefore, a flux of erg cm-2 s-1 (the difference between the SPI and ISGRI fluxes) from such a source would be measured as low as 10-12 erg cm-2 s-1 by IBIS/ISGRI, close to its sensitivity limit.
To support the hypothesis that an extended source is present in the IBIS/ISGRI data but diluted by the coded mask deconvolution, we refined the analysis following the method developed by Renaud et al. (2006) for analyzing emission from extended sources.
We extracted the IBIS/ISGRI count rates from concentric circles centered on the pulsar with radii up to 80′, and converted them into flux by assuming a photon index as for the point-like source. This integrated flux as a function of the extraction radius does not reach a plateau after 15′, as expected for a point-like source, but slowly increases up to 60′ (Fig. 3). The integrated IBIS/ISGRI flux also recovers the BeppoSAX/PDS and SPI fluxes at radii comparable with their PSFs. This confirms the detection of extended hard X-ray emission beyond the inner PWN.
2.3 IBIS/ISGRI and Suzaku/XIS combined spectrum
The MECS and PDS instruments on board BeppoSAX allowed to measure a break at energy keV (Mangano et al., 2005). However, the different angular resolution of the two instruments required the authors to combine the PDS spectrum rescaled by an intercalibration factor with the MECS spectrum extracted from a 15′ radius region. With a much smaller PSF, INTEGRAL IBIS/ISGRI can be combined with Suzaku/XIS on the same extraction radius.
Suzaku observed the Vela pulsar and PWN on 2006 July 10 and 11. Event files from version 2.0.6.13 of the Suzaku pipeline were used and spectra were extracted using XSELECT. Response matrices and ancillary response files were generated for each XIS using XISRMFGEN and XISSIMARFGEN version 2007–05–14. The data of the XIS2 camera were not considered because of a more uncertain calibration. The effective exposure time for each XIS is about 60.3 ks. The source photons are extracted from a circular region with a radius of 6′ to match the IBIS/ISGRI PSF. Background photons are extracted from blank sky observations within the same region as the source.

We modeled the pulsar contribution by introducing two black bodies corrected by the interstellar absorption, with fixed parameters as measured by XMM-Newton (Manzali et al., 2007). An absorbed non-equilibrium plasma emission model (VMEKAL) is also included to account for the thermal supernova remnant; fixing the abundances as in LaMassa et al. (2008), we derived a temperature of keV. The XIS spectra show a bright power law component with photon index and flux (Table 1) compatible with the MECS at the same radius (Mangano et al., 2005). It is connected to the IBIS/ISGRI spectrum, confirming that the IBIS/ISGRI flux is due to the PWN. However, a spectral break is required to simultaneously fit the XIS and the IBIS/ISGRI data. The break is located at higher energies ( keV) than the one derived by BeppoSAX. A simultaneous fit with a single power law is statistically rejected (of 11252 for 6245 d.o.f.).
We also refined the spectral fit by replacing the broken power law with a Band model, an empirical four-parameter model consisting of two power law components smoothly joined by an exponential roll-over (Band et al., 1993). The fitted parameters are compatible with the ones derived with the broken power law model (Table 1), for a comparable . Notably, the two power laws intersect at keV, which corresponds to the break energy in the broken power-law model. In the next section we adopt the Band model, as a gradual transition should be more representative of the change of slope around a cooling break (e.g., Kardashev, 1962).
| Broken power law | Band | |
|---|---|---|
| 1.642 | 1.610 | |
| 2.07 0.05 | 2.2 | |
| (keV) | 27 3 | … |
| (keV) | … | 114 |
| 1.11 0.02 | 1.11 0.06 | |
| (d.o.f) | 1.03 (6235) | 1.03 (6235) |
Note. — Best-fit spectral parameters of the combined Suzaku/XIS–IBIS/ISGRI data within 6′ from the Vela pulsar. The uncertainties are at the 90% confidence level. ∗ is the folding energy in the Band model. The two power laws intersect at keV, which corresponds to the break energy in the broken power-law model . †Flux in the 20–100 keV energy band in units of 10-10 erg cm-2 s-1.
3 Discussion
Thanks to the deep INTEGRAL exposure, we were able to discover diffuse emission above 20 keV beyond the inner Vela PWN. Such emission is resolved in two different regions: a southern hot-spot coincident with the Vela cocoon, notably with the peak of the TeV brightness profile measured by H.E.S.S., and a more extended northern emission, without any counterpart at other wavelengths and outside Vela X. However, recent Suzaku/XIS observations showed non-thermal emission below 10 keV in a region located at the boundary of the IBIS northern emission (Katsuda et al., 2011). We then compared the IBIS spectrum to the ones of BeppoSAX/PDS and SPI, and explained the flux differences by their different PSFs, which sample different portions of the nebula, confirming a large extension (1∘ radius) at hard X-rays.
We also reported on the spectrum within 6′ from the pulsar using the IBIS/ISGRI and the XIS telescopes. This is the first broad-band X-ray spectrum of the Vela PWN taken within a region with the same angular extension below and above 10 keV. The change of slope around 25 keV ( for the Band model) is compatible with the standard value of 0.5 expected from a cooling break occurring in a continuously injected electron distribution affected by radiative losses. Indeed, the XIS and IBIS/ISGRI photon indices (1.6 and 2.2) are compatible with the synchrotron spectrum of a shock-accelerated electron distribution in the uncooled and cooled regime, respectively (e.g., Chevalier, 2000). In this framework, the cooling energy is expected to decrease with time, that is at increasing integration radii from the pulsar. The lower break energy measured by BeppoSAX MECS and PDS on a larger angular extension may indicate a cooling break propagating along the flow. Indeed, the cooling energy in the cocoon is expected around 1 keV (LaMassa et al., 2008). The similar photon indices found by IBIS, BeppoSAX/PDS, and SPI suggest that the radiative losses above 20 keV already balance the injection rate within the region enclosed by the IBIS/ISGRI PSF.
The measurement of a cooling energy at 25 keV in the photon spectrum allows us to set an upper limit on the time (residence time) spent by the particles in the region within 6′ from the pulsar, corresponding to a distance of 0.5 pc. Accounting for synchrotron losses and inverse Compton losses in the Thomson regime, the cooling frequency as a function of the residence time can be written
| (1) |
where and are the photon field and magnetic energy densities, respectively. Eq. (1) coincides with the cooling frequency calculated assuming only synchrotron losses (e.g., Chevalier, 2000) for . Solving it for , the residence time has a maximum occurring for a magnetic field independently from the cooling frequency. Such a magnetic field amounts to 1.9 G when the target photons are provided by the Cosmic Microwave Background radiation (CMB, eV cm-3). For a cooling energy of 25 keV ( Hz), the residence time of electrons is 1650 yr in this case, and shorter for any different intensity of the magnetic field and any additional photon field. Therefore, the electrons radiating in X-rays in the considered region can not be older than 1650 yr. We conclude that those injected before have flowed out of the region within 6′ from the pulsar. This requires a moderate average velocity ( km/s).
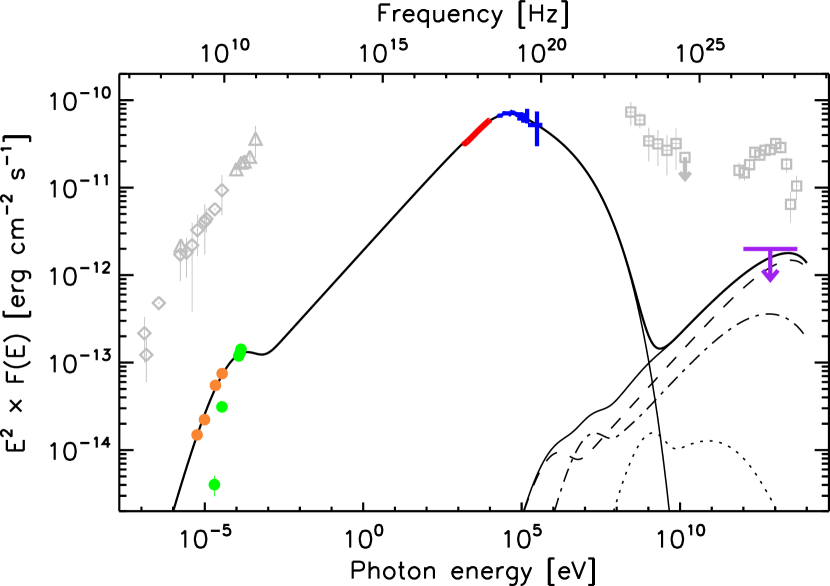
We explored the hypothesis that particles of all energies remain in this region for the residence time which yields a cooling break at 25 keV for a given . This is done by means of a time-dependent one-zone model of the spectral energy distribution (S.E.D., see Fig. 4). The injection spectrum is composed by a relativistic Maxwellian (Sironi & Spitkovsky, 2009) and a cut-off power law with index 2.2. The radiative losses depend on a magnetic field of constant intensity and a target photon field taken at the Vela position according to Moskalenko et al. (2006). The cut-off energy is fixed by through the condition that the acceleration rate equals the cooling rate (de Jager et al., 1996). The shape of the distribution is constant, whereas the normalization is proportional to the pulsar spin-down power:
| (2) |
where is the fraction of converted into the wind energy, and is the average Lorentz factor fixed by the energy conservation. Such an injection rate decreases in time following , where is the initial spin-down power, the spin-down time-scale, and for a braking index (Pacini & Salvati, 1973).
The S.E.D. in Fig. 4 is reproduced by this simple model for a range of values of . The upper limit on the integral flux above 1 TeV implies a firm lower limit on the magnetic field, G, higher than the one estimated in the cocoon (de Jager et al., 2008). This result depends on the relative intensity of the synchrotron and Compton peaks, which is not affected by the conversion efficiency (1.3% for G). It is also nearly irrespective of and : given the short evolution time, a manifold break around the cooling energy due to the pulsar spin-down (Gelfand et al., 2009) is not evident222We tested between 100 yr and 1000 yr, and both (dipolar rotator model) and (measured, Dodson et al., 2007). has been chosen to yield erg s-1 at the present time.. The extrapolation of the X-ray spectrum at lower energies falls squarely on the measured radio fluxes of the compact PWN. A fine tuning is obtained adopting a relativistic Maxwellian with a temperature of 3 GeV for G; alternatively, a low-energy break in the injected electron population is required at GeV energies, as found in young PWNe (e.g., Bucciantini et al., 2011). Additional measurements between radio and X-ray frequencies are needed to exclude a more complex spectrum (e.g., Slane et al., 2008).
The fact that diffuse hard X-ray emission is detected beyond 6′ from the pulsar in the northern direction strengthens the hypothesis of particle leakage. Unlike the southern hot-spot, which may simply be the high-energy counterpart of the X-ray cocoon, the northern emission may be generated by particles injected after the transit of the supernova reverse shock (3 kyr ago, Blondin et al., 2001). The original PWN is then set apart from the pulsar, becoming relic, while the latter forms a new PWN in subsonic expansion inside the supernova remnant (van der Swaluw et al., 2004). To understand the nature of the northern emission it will be crucial to extend the X-ray mapping of the Vela PWN with XMM-Newton and Suzaku and with the forthcoming focusing telescopes at higher energy X-rays (Nu-STAR and ASTRO-H).
References
- Abdo et al. (2010) Abdo, A. A., et al. 2010, ApJ, 713, 146
- Aharonian et al. (2006) Aharonian, F., et al. 2006, A&A, 448, L43
- Alvarez et al. (2001) Alvarez, H., Aparici, J., May, J., & Reich, P. 2001, A&A, 372, 636
- Arnaud (1996) Arnaud, K. A. 1996, Astronomical Data Analysis Software and Systems V, 101, 17
- Band et al. (1993) Band, D., et al. 1993, ApJ, 413, 281
- Blondin et al. (2001) Blondin, J. M., Chevalier, R. A., & Frierson, D. M. 2001, ApJ, 563, 806
- Bouchet et al. (2009) Bouchet, L., del Santo, M., Jourdain, E., et al. 2009, ApJ, 693, 1871
- Bucciantini (2011) Bucciantini, N. 2011, High-Energy Emission from Pulsars and their Systems, 473
- Bucciantini et al. (2011) Bucciantini, N., Arons, J., & Amato, E. 2011, MNRAS, 410, 381
- Chevalier (2000) Chevalier, R. A. 2000, ApJ, 539, L45
- de Jager et al. (2008) de Jager, O. C., Slane, P. O., & LaMassa, S. 2008, ApJ, 689, L125
- de Jager et al. (1996) de Jager, O. C., Harding, A. K., Michelson, P. F., Nel, H. I., Nolan, P. L., Sreekumar, P., & Thompson, D. J. 1996, ApJ, 457, 253
- Dodson et al. (2007) Dodson, R., Lewis, D., & McCulloch, P. 2007, Ap&SS, 308, 585
- Dodson et al. (2003) Dodson, R., Legge, D., Reynolds, J. E., & McCulloch, P. M. 2003, ApJ, 596, 1137
- Dodson et al. (2003) Dodson, R., Lewis, D., McConnell, D., & Deshpande, A. A. 2003, MNRAS, 343, 116
- Frontera et al. (1997) Frontera, F., Costa, E., dal Fiume, D., et al. 1997, A&AS, 122, 357
- Gaensler & Slane (2006) Gaensler, B. M., & Slane, P. O. 2006, ARA&A, 44, 17
- Gelfand et al. (2009) Gelfand, J. D., Slane, P. O., & Zhang, W. 2009, ApJ, 703, 2051
- Goldwurm et al. (2003) Goldwurm, A., et al. 2003, A&A, 411, L223
- Jourdain et al. (2008) Jourdain, E., Götz, D., Westergaard, N. J., Natalucci, L., & Roques, J. P. 2008, Proceedings of the 7th INTEGRAL Workshop
- Hales et al. (2004) Hales, A. S., et al. 2004, ApJ, 613, 977
- Harding et al. (2002) Harding, A. K., Strickman, M. S., Gwinn, C., Dodson, R., Moffet, D., & McCulloch, P. 2002, ApJ, 576, 376
- Helfand et al. (2001) Helfand, D. J., Gotthelf, E. V., & Halpern, J. P. 2001, ApJ, 556, 380
- Kardashev (1962) Kardashev, N. S. 1962, Soviet Ast., 6, 317
- Katsuda et al. (2011) Katsuda, S., et al. 2011, PASJ in press, arXiv:astro-ph/1103.4872
- LaMassa et al. (2008) LaMassa, S. M., Slane, P. O., & de Jager, O. C. 2008, ApJ, 689, L121
- Lebrun et al. (2003) Lebrun, F., et al. 2003, A&A, 411, L141
- Mangano et al. (2005) Mangano, V., Massaro, E., Bocchino, F., Mineo, T., & Cusumano, G. 2005, A&A, 436, 917
- Manzali et al. (2007) Manzali, A., De Luca, A., & Caraveo, P. A. 2007, ApJ, 669, 570
- Markwardt & Ögelman (1997) Markwardt, C. B., & Ögelman, H. B. 1997, ApJ, 480, L13
- Markwardt & Ögelman (1995) Markwardt, C. B., & Ögelman, H. B 1995, Nature, 375, 40
- Moskalenko et al. (2006) Moskalenko, I. V., Porter, T. A., & Strong, A. W. 2006, ApJ, 640, L155
- Pacini & Salvati (1973) Pacini, F., & Salvati, M. 1973, ApJ, 186, 249
- Pavlov et al. (2003) Pavlov, G. G., Teter, M. A., Kargaltsev, O., & Sanwal, D. 2003, ApJ, 591, 1157
- Pavlov et al. (2001) Pavlov, G. G., Kargaltsev, O. Y., Sanwal, D., & Garmire, G. P. 2001, ApJ, 554, L189
- Pellizzoni et al. (2010) Pellizzoni, A., et al. 2010, Science, 327, 663
- Renaud et al. (2006) Renaud, M., Gros, A., Lebrun, F., Terrier, R., Goldwurm, A., Reynolds, S., & Kalemci, E. 2006, A&A, 456, 389
- Rishbeth (1958) Rishbeth, H. 1958, Australian Journal of Physics, 11, 550
- Sironi & Spitkovsky (2009) Sironi, L., & Spitkovsky, A. 2009, ApJ, 698, 1523
- Skinner & Connell (2003) Skinner, G., & Connell, P. 2003, A&A, 411, L123
- Slane et al. (2008) Slane, P., Helfand, D. J., Reynolds, S. P., Gaensler, B. M., Lemiere, A., & Wang, Z. 2008, ApJ, 676, L33
- Ubertini et al. (2003) Ubertini, P., et al. 2003, A&A, 411, L131
- Willmore et al. (1992) Willmore, A. P., Eyles, C. J., Skinner, G. K., & Watt, M. P. 1992, MNRAS, 254, 139
- Winkler et al. (2003) Winkler, C., Courvoisier, T. J.-L., Di Cocco, G., et al. 2003, A&A, 411, L1
- van der Swaluw et al. (2004) van der Swaluw, E., Downes, T. P., & Keegan, R. 2004, A&A, 420, 937
- van der Swaluw et al. (2001) van der Swaluw, E., Achterberg, A., Gallant, Y. A., & Tóth, G. 2001, A&A, 380, 309
- Vedrenne et al. (2003) Vedrenne, G., et al. 2003, A&A, 411, L63