11email: hhwang@cfa.harvard.edu;delbaz@cea.fr 22institutetext: Smithsonian Astrophysical Observatory, 60 Garden Street, Cambridge, MA 02138, USA 33institutetext: School of Physics, Korea Institute for Advanced Study, Seoul 130-722, Korea 33email: cbp@kias.re.kr 44institutetext: Dept. of Astronomy & Space Science, Kyung Hee University, Gyeonggi 446-701, Korea 44email: yy.choi@khu.ac.kr
Activity in galactic nuclei of cluster and field galaxies in the local universe
Abstract
Aims. We study the environmental effects on the activity in galactic nuclei by comparing galaxies in clusters and in the field.
Methods. Using a spectroscopic sample of galaxies in Abell clusters from the Sloan Digital Sky Survey Data Release 7, we investigate the dependence of nuclear activity on the physical parameters of clusters as well as the nearest neighbor galaxy. We also compare galaxy properties between active galactic nuclei (AGN) hosts and non-AGN galaxies.
Results. We find that the AGN fraction of early-type galaxies starts to decrease around one virial radius of clusters () as decreasing clustercentric radius, while that of late types starts to decrease close to the cluster center (). The AGN fractions of early-type cluster galaxies, on average, are found to be lower than those of early-type field galaxies by a factor . However, the mean AGN fractions of late-type cluster galaxies are similar to those of late-type field galaxies. The AGN fraction of early-type brightest cluster galaxies lies between those of other early-type, cluster and field galaxies with similar luminosities. In the field, the AGN fraction is strongly dependent on the morphology of and the distance to the nearest neighbor galaxy. We find an anti-correlation between the AGN fraction and the velocity dispersion of clusters for all subsamples divided by morphology and luminosity of host galaxies. The AGN power indicated by is found to depend strongly on the mass of host galaxies rather than the clustercentric radius. The difference in physical parameters such as luminosity, () colors, star formation rates, and () color gradients between AGN hosts and non-AGN galaxies is seen for both early and late types at all clustercentric radii, while the difference in structure parameters between the two is significant only for late types.
Conclusions. These results support the idea that the activity in galactic nuclei is triggered through galaxy-galaxy interactions and mergers when gas supply for AGN is available.
Key Words.:
galaxies: active – galaxies: clusters: general – galaxies: evolution – galaxies: formation – galaxies: general – galaxies: interactions1 Introduction
What powers the activity in galactic nuclei? It is generally accepted that active galactic nuclei (AGNs) are powered by accretion onto supermassive black holes (SMBHs, Lynden-Bell 1969), but it is still poorly understood what the source of fuel is and how the fuel can be accreted by removing its angular momentum (see Jogee 2006 for a review).
In the hierarchical picture of galaxy formation, massive galaxies are formed through accretion and mergers of other galaxies. As the star formation (SF) is triggered through galaxy-galaxy interactions and mergers by supplying gas into the center of galaxies, the activity in galactic nuclei is also expected to be triggered in a similar way with a gas inflow towards the center of galaxies by feeding SMBHs (Sanders et al. 1988; Barnes & Hernquist 1992; Springel et al. 2005; Di Matteo et al. 2005; Hopkins et al. 2006). On the other hand, internal processes such as bar-driven gas inflow (e.g., Combes 2003; see Kormendy & Kennicutt 2004 for a review), turbulence in interstellar matter (e.g., Wada 2004), and stellar wind (e.g., Ciotti & Ostriker 2007) can also supply gas to SMBHs to trigger their activity.
Early studies of the environment of Seyfert galaxies have provided some hints for the triggering mechanism of the nuclear activity and its connection to neighbor galaxies (e.g., Petrosian 1982; Dahari 1984, 1985; Keel et al. 1985; Fuentes-Williams & Stocke 1988; Virani et al. 2000; Laurikainen & Salo 1995; Dultzin-Hacyan et al. 1999). As the Sloan Digital Sky Survey (SDSS; York et al. 2000) and Two Degree Field Galaxy Redshift Survey (2dFGRS; Colless et al. 2001) have produced unprecedented photometric and spectroscopic data of nearby galaxies, the physical properties of AGN host galaxies and their environmental dependence have been extensively studied, providing strong observational constraints on the triggering mechanism of the activity in galactic nuclei (e.g., Miller et al. 2003; Kauffmann et al. 2003a, 2004; Wake et al. 2004; Best 2004; Best et al. 2005; Serber et al. 2006; Sorrentino et al. 2006; Constantin et al. 2008a, b; Ellison et al. 2008; Li et al. 2008; Choi et al. 2009; Haggard et al. 2010; Lee et al. 2010; Schawinski et al. 2010b, a; Padilla et al. 2010; see also Waskett et al. 2005; Silverman et al. 2009; Montero-Dorta et al. 2009; Cisternas et al. 2011 for high- AGNs). For example, Miller et al. (2003) found no environmental dependence of the AGN fraction using the SDSS data. Later, Kauffmann et al. (2004) showed that luminous AGNs with () are dependent on the environment, in the sense that powerful AGNs are found predominantly in low-density regions. In addition, the fraction of galaxies having radio-loud AGNs with low emission-line luminosities is found to be high in high-density regions compared to low-density regions (Best et al. 2005).
Regarding on the the activity in galactic nuclei and its connection to neighbor galaxies, some studies found no strong evidence for the effects of galaxy-galaxy interactions and mergers on the activity (De Robertis et al. 1998; Malkan et al. 1998; Schmitt 2001; Grogin et al. 2005; Pierce et al. 2007; Li et al. 2008; Georgakakis et al. 2009; Gabor et al. 2009; Tal et al. 2009; Darg et al. 2010; Slavcheva-Mihova & Mihov 2011), but other studies showed the evidence for the effects (Heckman et al. 1986; Keel 1996; Domingue et al. 2005; Koulouridis et al. 2006; Kuo et al. 2008; Urrutia et al. 2008; Comerford et al. 2009; Rogers et al. 2009; Koss et al. 2010; Ellison et al. 2011; Silverman et al. 2011).
Focusing on this issue, our group has been investigating the dependence of the activity in galactic nuclei on host galaxy properties and environments. For example, Choi et al. (2009) compared several physical parameters of AGN hosts and non-AGN galaxies using SDSS data release 5, and found that the AGN fraction depends mainly on morphology and color of host galaxies. Therefore, when morphology and color are fixed, the AGN fraction is almost independent of luminosity or stellar velocity dispersion of host galaxies. AGNs are found to be typically hosted by intermediate-color, late-type () and bluish early-type galaxies (peak at ), which indicates that AGN host galaxies have a younger stellar population than non-AGN galaxies at given luminosity or velocity dispersion. Among the late-type galaxies, bluer color galaxies host more powerful AGNs. These results support the idea that more massive and redder galaxies are unlikely to host AGNs because of lack of gas to feed their SMBHs.
We also studied the connection between the presence of bars and the activity in galactic nuclei (Lee et al. 2011b) using the bar galaxy sample of Lee et al. (2011a), and found that the bar fraction in AGN-host galaxies is higher than in non-AGN galaxies. However, this trend is simply caused by the fact that AGN-host galaxies are on average more massive and redder than non-AGN galaxies since the bar fraction increases with color and velocity dispersion. Therefore the excess of bar fraction in AGN-host galaxies disappears when AGN-host and non-AGN galaxies with fixed color and velocity dispersion are compared. These results suggest that the activity in galactic nuclei is not directly connected with the presence of bars.
As for the environmental dependence of nuclear activity, we found a strong dependence of the AGN fraction on the morphology of and the distance to the nearest neighbor galaxy (Choi et al. in prep.). When an early-type galaxy has a close neighbor galaxy, the AGN fraction increases as it approaches a late-type neighbor, but decreases as it approaches an early-type neighbor. For the late-type case, the AGN fraction also increases as it approaches a late-type neighbor, but remains constant or decreases as it approaches an early-type neighbor. The bifurcations of the AGN fraction depending on the neighbor’s morphology are seen around one virial radius of the neighbor. This can support the idea of interaction-induced activity in galactic nuclei, and implies that hydrodynamic interactions with the nearest neighbor in addition to the tidal interactions play important roles in triggering nuclear activity.
One thing interesting in these studies of environmental dependence is a comparison of the activity in galactic nuclei in galaxy clusters and in the field. Since Gisler (1978) first found a lack of optical emission-line galaxies in nearby clusters, many studies have extended this comparison of the activity in galactic nuclei between cluster and field galaxies using an extensive survey data sets in the local universe (e.g., Dressler et al. 1985; Popesso & Biviano 2006; Best et al. 2007; Arnold et al. 2009; von der Linden et al. 2010; Koulouridis & Plionis 2010). For example, Arnold et al. (2009) confirmed an increasing AGN fraction from cluster to group regions. One of the most interesting results in their study is that this trend remains the same even if they fix the morphology of host galaxies (e.g. early-type galaxy). This suggests that the change in AGN fraction is not simply caused by the morphological mix with the environment, but is directly connected to environment.
Thanks to recent, powerful X-ray observatories such as XMM-Newton and Chandra, this comparison has been extended to higher redshifts so that one can study the evolution of AGNs as a function of redshift (e.g., Martini et al. 2006, 2009; Johnson et al. 2003; Ruderman & Ebeling 2005; Eastman et al. 2007; Gilmour et al. 2009). For example, using the cluster galaxies at , Martini et al. (2009) found an increase of AGN fraction by a factor of eight at compared to the local universe with 3.8 statistical significance. This strong evolution of AGN fraction is qualitatively comparable to the evolution of SF galaxy fraction (the Butcher-Oemler effect; Butcher & Oemler 1984), which suggests a close connection between SF and nuclear activity (e.g., Mullaney et al. 2011).
It should be noted that the statistics can vary depending on the AGN selection criteria (i.e. optical line ratio, X-ray luminosity, mid-infrared color, or radio luminosity). For example, Galametz et al. (2009) constructed AGN samples using three different selection criteria (mid-IR color, radio luminosity, and X-ray luminosity), and found that the increase of cluster AGN surface density with redshift on average is more steep than that of field quasars. Although they found significant differences between the AGN populations identified by different methods, their results do not change much depending on the selection criteria (see also Atlee et al. 2011).
On the other hand, it was found that galaxy properties such as morphology, luminosity, and star formation rate (SFR) strongly depend on the distance to and the morphology of the nearest neighbor galaxy, which indicates an important role of hydrodynamic interactions with neighbor galaxies (Park et al. 2008; Park & Choi 2009; Hwang & Park 2009, 2010; Hwang et al. 2010, 2011). This dependence was found even when the large-scale background density is fixed, and thus is completely different from the commonly known morphology local density relation. We also found that successive interactions with nearby galaxies are still important in determining the morphology or SFR even in galaxy cluster regions (Park & Hwang 2009; Cervantes-Sodi et al. 2011). Since the activity in galactic nuclei is also expected to be triggered through galaxy-galaxy interactions and mergers as we discussed, it is necessary to investigate the role of neighbor galaxies in determining the activity hoping that the difference of nuclear activity between cluster and field galaxies be understood.
In this paper, we study the the activity in galactic nuclei of cluster and field galaxies using the SDSS data, and compare physical parameters of AGN hosts and non-AGN galaxies. Section 2 describes the data used in this study. Environmental dependence of the activity in galactic nuclei and the comparison of galaxy properties between AGN hosts and non-AGN galaxies are given in §3. Discussion and conclusions are given in §4 and §5, respectively. Throughout this paper, we adopt a flat CDM cosmological model with density parameters and .
2 Observational data set
2.1 Sloan Digital Sky Survey sample
We used a spectroscopic sample of galaxies including the main galaxy sample () and faint galaxies () whose spectroscopic redshifts are available in the SDSS data release 7 (DR7, Abazajian et al. 2009), which results in 915,327 galaxies. Completeness of the spectroscopic data in SDSS is poor for bright galaxies with because of the problems of saturation and cross-talk in the spectrograph, and for the galaxies located in high-density regions such as galaxy clusters due to the fiber collision. Thus, we added a photometric sample of galaxies with whose redshift information is available in the literature (see Hwang et al. 2010 for more detail). In total, the redshift information for 186,055 galaxies in the photometric sample was compiled, which overlaps with 174,634 galaxies in the spectroscopic sample. Finally, we added 11,421 galaxies to the spectroscopic sample of 915,327 galaxies, which yields a final sample of 926,748 galaxies. In the result, the spectroscopic completeness of our sample is higher than at all magnitudes with and even in the center of galaxy clusters (see Fig. 1 in Park & Hwang 2009). Note that the final sample also contains the galaxies whose spectral classifications provided in the SDSS are QSOs.
To investigate the physical parameters of galaxies, we used several value-added galaxy catalogs (VAGCs) drawn from SDSS data. Photometric and structure parameters were adopted from SDSS pipeline (Stoughton et al. 2002), and spectroscopic parameters were from the MPA/JHU DR7 VAGC111http://www.mpa-garching.mpg.de/SDSS/DR7/. We adopted the galaxy morphology information from Korea Institute for Advanced Study (KIAS) DR7 VAGC222http://astro.kias.re.kr/vagc/dr7/ (Park & Choi 2005; Choi et al. 2010), which contains 697,320 main galaxy sample in NYU VAGCs as well as 10,497 photometric sample of galaxies with the redshift information from various existing redshift catalogs. We performed additional visual classification for the galaxies in DR7 that are not included in KIAS DR7 VAGC. During the visual inspection of color images of galaxies, we eliminated 1649 spurious sources (e.g., faint fragments of bright galaxies, diffraction spikes of bright stars), and they are not included in the final sample of 926,748 galaxies.
2.2 Cluster Sample and Galaxy Membership in Clusters
The galaxy and cluster samples used in this study are similar to those in Park & Hwang (2009), but for SDSS DR7 data. We used the Abell catalog of galaxy clusters (Abell et al. 1989) to identify cluster galaxies in our galaxy sample. Among the Abell clusters, we selected those that have known spectroscopic redshifts in the NED. We found clusters located within the SDSS survey region. We adopted the position of cluster center in the NED, and revised it when the center position determined in X-ray is available in the literature.
To determine the membership of galaxies in a cluster, we used the “shifting gapper” method of Fadda et al. (1996). In the radial velocity versus clustercentric distance space, the cluster member galaxies are selected by grouping galaxies with connection lengths of 950 km s-1 in the direction of the radial velocity and of 0.1 Mpc in the direction of the clustercentric radius . Grouping in the radial velocity direction is made within each distance bin with 0.2 Mpc width. A larger bin width is used when the number of galaxies in a bin is less than 15. If the boundary is not reached out to Mpc, we stopped the grouping at Mpc. We iterate the procedure until the number of cluster members has converged. From this procedure we obtained 240 Abell clusters which have more than or equal to 10 member galaxies.
We computed a radius of (usually called the virial radius) for each cluster where the mean overdensity drops to 200 times the critical density of the universe , using the formula given by Carlberg et al. (1997):
| (1) |
where is a velocity dispersion of the cluster and the Hubble parameter at is (Peebles 1993). , , and are the dimensionless density parameters.
The velocity dispersion was computed for each cluster, using the galaxies that are identified as members in the cluster main body by rejecting interlopers. To reject the interlopers, we computed , which indicates the local deviation of the radial velocity of a galaxy from the systemic velocity () of the entire cluster taking into account the velocity dispersion () of the cluster. It is defined by
| (2) |
where is the number of galaxies that defines the local environment, taken to be in this study. We then used the galaxies with to calculate the cluster velocity dispersion.
In addition to the sample of cluster galaxies obtained adopting the “shifting gapper” method above, we included the galaxies located at projected separations of to investigate the variation of galaxy properties over a wide range of clustercentric radius. is the largest clustercentric distance of the cluster member galaxies determined above, which is typically Mpc. These additional galaxies are constrained to have velocity difference relative to the cluster’s systematic velocity less than km s-1. The final sample consists of galaxies smoothly distributed from the cluster center to for each cluster.

We rejected the clusters that appear to be interacting or merging, which are found in the galaxy velocity versus clustercentric distance space. Dynamically young clusters with the brightest cluster galaxy (BCG) at large clustercentric distance () were also rejected. These procedures left us only dynamically relaxed clusters, so our results are not affected by violent SF or nuclear activity of cluster galaxies caused by cluster interactions or mergers (e.g., Hwang & Lee 2009).
We included eight clusters to increase the statistics, which were originally eliminated in previous studies due to the incomplete survey coverage out to 10 (Hwang et al. 2010; Cervantes-Sodi et al. 2011). We finally obtain a sample of 129 relaxed Abell clusters with and (km s-1), and present the distribution of redshifts and velocity dispersions for these clusters in Fig. 1.
2.3 AGN Selection
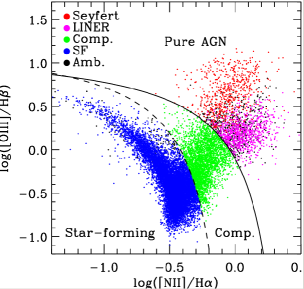
We determined the spectral types of emission-line galaxies based on the criteria given by Kewley et al. (2006) using the emission line ratio diagrams, commonly known as the Baldwin-Phillips-Terlevich (BPT) diagrams (Baldwin et al. 1981; Veilleux & Osterbrock 1987). In brief, for the galaxies with signal-to-noise ratio (S/N)3 in the strong emission-lines H, [OIII] 5007, H, [NII] 6584, and [SII]6717,6731, we determined their spectral types based on their positions in the line ratio diagrams on which [OIII]/H is plotted against [NII]/H, [SII]/H, and [OI]/H : star-forming galaxies, Seyferts, low-ionization nuclear emission-line regions (LINERs), composite galaxies, and ambiguous galaxies. Composite galaxies host a mixture of star-formation and AGN, and lie between the extreme starburst line (Kewley et al. 2001) and the pure star formation line (Kauffmann et al. 2003a) in the [OIII]/H vs. [NII]/H line ratio diagram (see Fig. 2). Ambiguous galaxies are those classified as one type in one or two diagrams, but as another type in the other diagrams (see Kewley et al. 2006 for more detail). LINERs are generally thought to be low-luminosity AGNs, but because of other mechanisms that can produce the LINER-like spectra, the AGN excitation mechanism of LINERs is still debated (see Ho 2008 for a review). However, from a recent X-ray analysis of 82 LINERs, González-Martín et al. (2009) concluded that the observational data support the AGN nature for 80% of their LINER sample (but see also Sarzi et al. 2010), which suggests that the contamination of non-AGN LINERs to our analysis (which is based on total AGN samples) is not significant.
We assign ‘undetermined’ type to those that do not satisfy S/N criteria. We restrict our analysis to the galaxies at owing to the problem of small (3″) fixed-size aperture (Kewley et al. 2006). In Fig. 3, we show example spectra of several spectral types, especially for low S/N cases (S/N).
These AGN criteria select only Type II AGNs with narrow emission lines, and miss Type I AGNs with broad Balmer lines. To secure Type I AGNs missed in this method, we included galaxies whose spectral classifications (specClass) provided by SDSS pipeline are quasar (i.e. specClass = SPECQSO or SPECHIZQSO; see Stoughton et al. 2002 for more detail). Among 472 370 spectroscopic sample of galaxies at that we are interested in, 2206 quasars () with broad emission lines were included. The statistics for AGN subsamples are summarized in Table 1, which lists the fraction and the number of each subsample.
In this study, the AGN fraction means a ratio of the number of Type I plus Type II AGNs (Seyferts, LINERs and composite galaxies determined in the line ratio diagram) to the number of galaxies with spectroscopic parameters measured in MPA/JHU DR7 VAGC. If we use more strict AGN definition by excluding composite galaxies, our conclusions do not change but our statistics are worse because of smaller number of galaxies. Note also that the photometric sample of galaxies with redshift adopted from the literature is not included when we compute the AGN fraction because their spectral types can not be determined. Some previous studies suggested that the environments attributed to companion galaxies are different between Seyfert 1 and 2 (e.g., Laurikainen et al. 1994; Koulouridis et al. 2006). In addition, LINERs are known to be phenomenologically different from Seyferts (see Ho 2008 for a review). Therefore, it should be noted that our analysis based on AGNs including all subsamples does take into account the difference between the subsamples, and suggests only a broad consensus on the activity of galactic nuclei. A detailed analysis focusing on the difference between the subsamples needs to be conducted with a more extensive data set in future studies.
| Sample | Morph.a | Seyferts | LINERs | Composite | Type I | SF | Ambiguous | Undetermined | Total |
|---|---|---|---|---|---|---|---|---|---|
| C1 | ETGs | 1.4%(014) | 1.5%(016) | 6.1%(0063) | 0.0%(00) | 6.7%(0069) | 1.1%(011) | 83.3%(0863) | 100%(1036) |
| STGs | 0.6%(009) | 0.3%(005) | 6.8%(0107) | 0.0%(00) | 72.2%(1132) | 2.0%(031) | 18.1%(0284) | 100%(1568) | |
| C2 | ETGs | 1.3%(099) | 2.5%(195) | 4.8%(0379) | 0.0%(02) | 2.3%(0179) | 1.5%(118) | 87.7%(6921) | 100%(7893) |
| STGs | 1.7%(150) | 1.2%(102) | 12.5%(1085) | 0.3%(29) | 51.6%(4465) | 1.5%(134) | 31.1%(2695) | 100%(8660) | |
| C3 | ETGs | 0.8%(057) | 5.5%(369) | 3.6%(0244) | 0.0%(03) | 0.8%(0053) | 2.0%(136) | 87.2%(5858) | 100%(6720) |
| STGs | 4.4%(200) | 5.2%(238) | 17.7%(0809) | 1.6%(73) | 25.8%(1179) | 3.9%(178) | 41.5%(1901) | 100%(4578) |
a: Galaxy morphology (ETGs : early-type galaxies, LTGs : late-type galaxies).

2.4 Physical parameters of galaxies
The physical parameters of galaxies that we consider in this study are -band absolute Petrosian magnitude (), morphology, axis ratio, () color, SFR, [OIII] emission line flux, () color gradient, concentration index (), internal velocity dispersion (), and Petrosian radius in -band. Here we give a brief description of these parameters.
The -band absolute magnitude was computed using the formula,
| (3) |
where is a distance modulus, is the -correction, and is the luminosity evolution correction. is defined by and is a luminosity distance in unit of pc. The rest-frame absolute magnitudes of individual galaxies are computed in fixed bandpasses, shifted to , using Galactic reddening correction (Schlegel et al. 1998) and -corrections as described by Blanton & Roweis (2007). The evolution correction given by Tegmark et al. (2004), , is also applied.
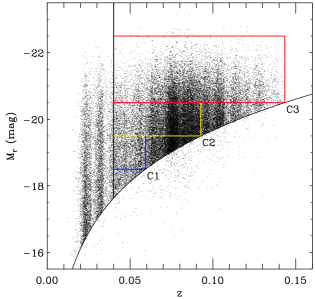
Figure 4 shows the -band absolute magnitudes of the cluster galaxies against their redshifts. We define three volume-limited samples of galaxies using the redshift and absolute magnitude conditions as follows: C1 (faint galaxies: and ), C2 (intermediate-luminosity galaxies: and ), and C3 (bright galaxies: and ).
The color was computed with the extinction and -corrected model magnitudes. The superscript 0.1 means the rest-frame magnitude -corrected to the redshift of 0.1, and will subsequently be dropped.
We adopt the values of color gradient, concentration index (), and Petrosian radius computed for the galaxies in KIAS VAGC (Choi et al. 2010). The color gradient was defined by the color difference between the region with and the annulus with , where is the Petrosian radius estimated in -band image. To account for the effect of flattening or inclination of galaxies, elliptical annuli were used to calculate the parameters. The (inverse) concentration index is defined by , where and are semimajor axis lengths of ellipses containing and of the Petrosian flux in the -band image, respectively.
The velocity dispersion of galaxies is adopted from the measurements by an automated spectroscopic pipeline called specBS, which was written by D. J. Schlegel (in prep.). We performed the aperture correction following Cappellari et al. (2006),
| (4) |
where is the measured velocity dispersion from the SDSS spectra obtained by an optical fiber with radius of . is an effective radius, which is derived by , where is the seeing-corrected effective radius along the major axis of the galaxy derived from a model fit of the de Vaucouleurs profile in the -band, and is an axis ratio (minor to major) of de Vaucouleurs fit. For statistical analysis in §3, we do not use galaxies with values less than the instrumental resolution ( km s-1).
The black hole mass () is computed through the relation,
| (5) |
We adopt and values differently depending on the morphology of host galaxies (Gültekin et al. 2009; and for early types, and and for late types). is computed for only galaxies with velocity dispersion values larger the instrumental resolution ( km s-1).
The [OIII] emission line fluxes are taken from MPA/JHU DR7 VAGC (Tremonti et al. 2004), which were computed using the straight integration over the fixed bandpass from the continuum-subtracted emission line. We corrected the line fluxes for internal extinction using the Balmer decrement and the reddening curve assuming an intrinsic H/H flux ratio of 2.85 for star-forming galaxies and 3.1 for AGN host galaxies (the Balmer decrement for case B recombination at T = 104 K and N cm-3; Osterbrock & Ferland 2006). For [OIII] line luminosity () measurements, we use only the galaxies with S/N. We adopt as an accretion rate indicator (Kauffmann et al. 2003a; Heckman et al. 2005, but see also Trouille & Barger 2010), then use that is proportional to the Eddington ratio as an indicator of AGN power.
The SFRs of galaxies are also adopted from the MPA/JHU DR7 VAGC (Brinchmann et al. 2004), which provides extinction and aperture corrected SFR estimates of star-forming galaxies as well as other types of galaxies (e.g., AGN, Composite, low S/N SF, low S/N LINER, and unclassifiable). For those galaxies where they can not directly measure SFRs from the emission lines such as AGN and composite galaxies, they use the 4000- break (D4000) to estimate SFRs (see Brinchmann et al. 2004 and http://www.mpa-garching.mpg.de/SDSS/DR7/sfrs.html for more detail). We also use stellar mass estimates from the MPA/JHU DR7 VAGC, which are based on the fit of SDSS five-band photometry with the model of Bruzual & Charlot (2003) (see also Kauffmann et al. 2003b). We convert SFR and stellar mass estimates in MPA/JHU DR7 VAGC that are based on Kroupa IMF (Kroupa 2001) to those with Salpeter IMF (Salpeter 1955) by dividing them by a factor of 0.7 (Elbaz et al. 2007).
In our analysis we often limit the late-type galaxy sample to galaxies with -band isophotal axis ratio greater than 0.6 (e.g., Figs 11-12). This is to reduce the effects of internal extinction on our results. The absolute magnitude and color of late-type galaxies with can be inaccurate (see Figs. 5 and 12 of Choi et al. 2007). Therefore, including them in the analysis may introduce a large dispersion in luminosity, color, or color gradient.
2.5 Nearest neighbor galaxy in clusters
To account for the effects of the nearest neighbor galaxy in cluster environment, we determine the distance and the morphology of the nearest neighbor galaxy.
We define the nearest neighbor galaxy of a target galaxy with absolute magnitude as the one which is located closest to the galaxy on the sky and is brighter than among those in our cluster galaxy sample. We adopt . We do not use the velocity condition to determine the nearest neighbor galaxy because it is selected from the cluster galaxy sample for which the velocity condition is already applied.
We obtain the nearest neighbor distance normalized by the virial radius of the nearest neighbor as follows. The virial radius of a galaxy within which the mean mass density is 200 times the critical density of the universe () is computed by
| (6) |
where is the galaxy luminosity, and is the mass-to-light ratio. We assume that the mass-to-light ratio of early-type galaxies is on average twice as large as that of late-type galaxies at the same absolute magnitude , which means (early)(late) [see §2.5 of Park & Choi (2009) and §2 of Park et al. (2008)].
Since we adopt , where is the mean density of the universe. The value of mean density of the universe, , was adopted where is the mass of a late-type galaxy with (Park et al. 2008). According to our formula the virial radii of galaxies with and are 260, 300, and 350 kpc for early types, and 210, 240, and 280 kpc for late types, respectively.
3 Results
3.1 Activity in galactic nuclei of cluster and field galaxies
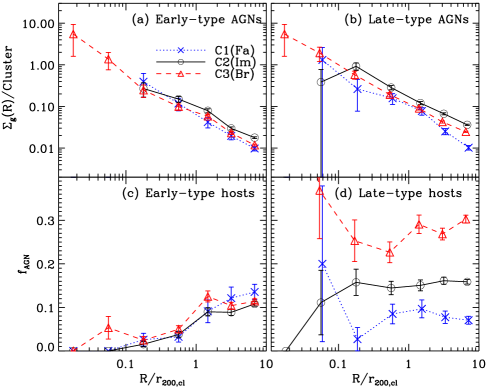
Figure 5 shows the projected number density of AGN host galaxies and the AGN fraction as a function of a projected clustercentric radius normalized by the cluster virial radius . The AGN fraction is the ratio of the number of Type I plus Type II AGNs (Seyferts, LINERs and composite galaxies determined in the line ratio diagram) to the number of galaxies with spectroscopic parameters measured in MPA/JHU DR7 VAGC. They are shown for three luminosity ranges. It shows that the projected number density of AGN hosts keeps increasing as the distance to the center of galaxy clusters decreases. The slopes for three luminosity samples are not significantly different.
On the other hand, the AGN fraction (fAGN) for early types is almost constant at large distance (), and starts to decrease inward around one virial radius of cluster. This is consistent with Fig. 12 in von der Linden et al. (2010), which shows a gradual decline of the AGN fraction in red galaxies at . The late-type galaxies show a similar trend, but the fraction starts to drop closer to the cluster center () than early-type galaxies. The AGN fraction for bright galaxies (C3) keeps increasing even at , but there are only 2 and 20 galaxies at and , respectively, which shows a large uncertainty (number of galaxies in other bins of C3 sample is ). It is also seen that the AGN fraction for late types, on average, is higher than that for early types in a given luminosity.
We wish to emphasize that it does not necessarily mean that the probability for cluster galaxies to be found as AGNs (i.e. ) is high when AGN host galaxies show an excess in the central region of clusters as seen in top panels because the projected number density of non-AGN galaxies also increases as decreasing clustercentric radius.
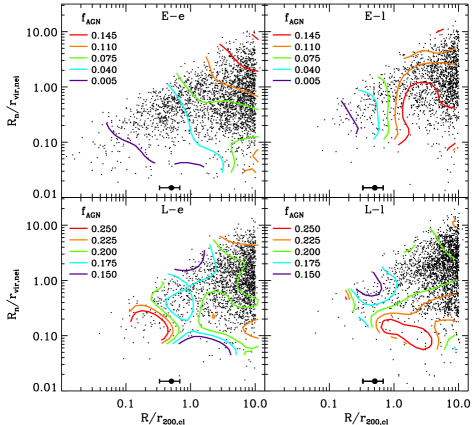
We now investigate the dependence of the AGN fraction on both clustercentric radius and nearest neighbor distance. We select a volume-limited sample of target galaxies at whose absolute magnitudes are in a narrow range of in order to reduce the effects of galaxy mass. Dots in Fig. 6 show the distribution of target galaxies in the projected clustercentric radius and projected nearest neighbor distance space. Four panels distinguish among four different combinations of target and neighbor morphology. A spline kernel is used to obtain smooth distributions of the median in each location of the four panels. Contours with different colors mark constant AGN fractions. If there are no strong effects of the distance to and the morphology of the neighbor galaxy on the AGN fraction, it is expected to see no significant difference in the shape of contours between left and right panels. However, we can see the difference.
Figure 6 shows that the contours in the field (i.e. ) are nearly horizontal in all panels. This means that outside the cluster virial radius, the activity in galactic nuclei is determined strongly by the nearest neighbor distance and morphology. When the nearest neighbor of a galaxy is an early type (E-e and L-e case), the AGN fraction decreases as the pair separation decreases at . However, if the neighbor is a late type (E-l and L-l case), it does not change much at but reaches a maximum at . This dependence of the activity in galactic nuclei on the neighbor galaxy in the field is consistent with the results in Choi et al. (in prep.).
| Early types | Late types | ||||||||||
|---|---|---|---|---|---|---|---|---|---|---|---|
| Sample | Prob.b | Prob.b | |||||||||
| C3(Br) | 0.1120.004 | 0.0420.006 | 0.0780.034 | 0.000 | 0.2930.007 | 0.2420.021 | … | 0.038 | |||
| C2(Im) | 0.1000.004 | 0.0280.004 | … | 0.000 | 0.1590.004 | 0.1460.013 | … | 0.000 | |||
| C1(Fa) | 0.1230.013 | 0.0280.009 | … | 0.043 | 0.0770.007 | 0.0770.019 | … | 0.235 |
a: The Spearman rank correlation coefficient. b: The two-sided probability of obtaining a value of by chance.
In the cluster region of , the shape of contours is relatively noisy, but clearly different from that outside the cluster region. Now all panels show somewhat slant contours. Although early-type galaxies have late-type neighbors, does not increase as they approach neighbor galaxies and the center of clusters. When late-type galaxies have late-type neighbors, the increase of is not significant as they approach neighbor galaxies.
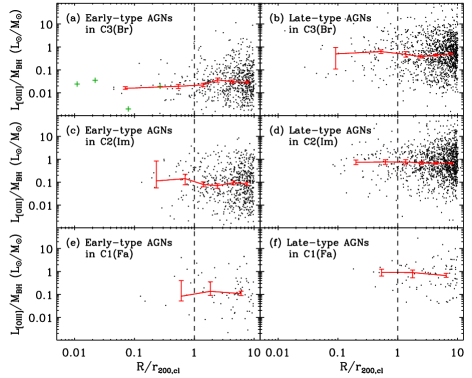
In Fig. 7, we show (AGN power indicator) as a function of the projected clustercentric radius divided into two morphology and three magnitude bins. It is seen that for late types, on average, is larger than those for early types with similar luminosities. The median values of do not show any noticeable change with for all subsamples.
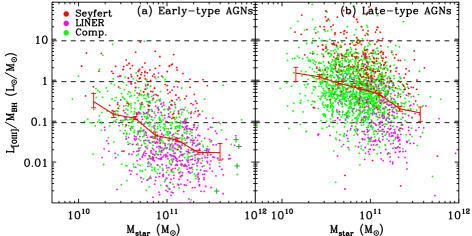
In Fig. 8, we plot again, but as a function of stellar mass of host galaxies. Now a strong anti-correlation between and the stellar mass is seen for early-type AGNs, which means that massive AGNs currently accret less gas per unit black hole mass than less massive AGNs. The Spearman rank correlation test for this correlation gives a correlation coefficient of , and the two-sided probability of finding a value of by chance is %. This anti-correlation was similarly seen in the plot of versus the black hole mass in previous studies (Heckman et al. 2004; Best et al. 2005). They suggested that massive black holes (a few ) must have grown much faster in the past. However, note that this trend might be because of “Eddington incompleteness”, which indicates an observational selection effect that AGNs with lower Eddington ratio are detected only at more massive galaxies in a given flux or luminosity limit (see Lee et al. 2011b for more discussion). Note also that a weak correlation for late-type AGNs (right panel) may be due to a large uncertainty in . The black hole mass is known to correlate with the velocity dispersion of bulge component, but of late-type galaxies in this study was derived from the SDSS spectra obtained by a fixed size of optical fiber, which may introduce a systematic uncertainty in . In summary, the comparison between Figs. 7 and 8 can tell us that the AGN power is strongly controlled by the mass of host galaxies (or SMBHs) rather than the environment.
3.2 AGN fraction depending on clusters
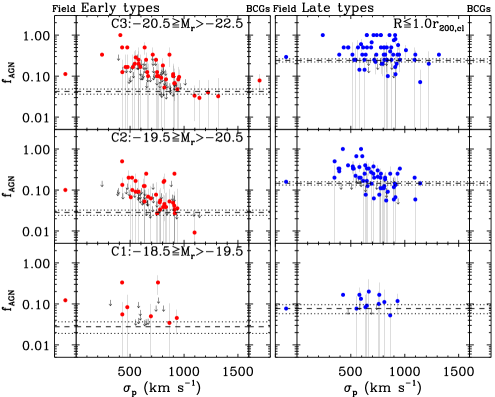
In Figs. 9 and 10, we show the AGN fraction of each cluster as a function of cluster velocity dispersion and redshift, respectively. The AGN fraction of each cluster is computed using the galaxies within one virial radius of the cluster (), and its error bar represents 68% (1) confidence interval that is determined by the bootstrap resampling method. It is seen that the AGN fraction decreases as the velocity dispersion of cluster increases when we consider only the clusters with . It is prominent for the sample of C2 and C3. To check this correlation between the two quantities [log() vs. ], we compute the Spearman rank correlation coefficient () and its significance using the clusters with in each panel, and summarize the results in Table 2. It shows that the anti-correlation between the two really exist for all subsamples divided by luminosity and morphology of host galaxies, and the anti-correlation is stronger in early types than in late types. This finding is consistent with the results in previous studies (e.g., Popesso & Biviano 2006; Arnold et al. 2009), but we further show that this anti-correlation exists for all subsamples divided by luminosity and morphology of host galaxies.
One might think that the AGN fractions in this figure are somewhat large (sometimes reaches unity) compared to the results in previous studies. However, we would like to emphasize that the AGN fraction strongly depends on the luminosity and the morphology of host galaxies, so simple comparison of AGN fractions without controlling physical parameters could be misleading. Note again that the AGN fraction in this study is a ratio of the number of Type I plus Type II AGNs (Seyferts, LINERs and composite galaxies determined in the line ratio diagram) to the number of galaxies with spectroscopic parameters measured in MPA/JHU DR7 VAGC. Therefore, the AGN fraction can be different if the galaxies with spectroscopic parameters measured in MPA/JHU DR7 VAGC are not complete. Indeed, the spectroscopic completeness of SDSS data is as low as 80% in high-density regions such as central regions of clusters (90% in the field) because of difficulty in observing with multi-object spectrograph (mostly early-type galaxies or non-emission line galaxies; see §2.1 and Fig. 1 in Park & Hwang 2009), which can affect our results slightly.
Comparison of the mean AGN fraction computed using all the cluster galaxies () with that of field galaxies shows that the AGN fraction of early-type cluster galaxies is lower than that of early-type field galaxies by a factor for all luminosity subsamples (see Table 2). The AGN fraction of field galaxies is computed using the galaxies outside the cluster region (). However, the AGN fractions of late-type cluster galaxies are, on average, not different from those of late-type field galaxies. The AGN fraction of early-type BCGs in C3 sample (5 out of 64) appears to be marginally smaller than that of early-type field galaxies with similar luminosities (see top left panel in Fig. 9), but be slightly higher than that of other early-type cluster galaxies with similar luminosities.
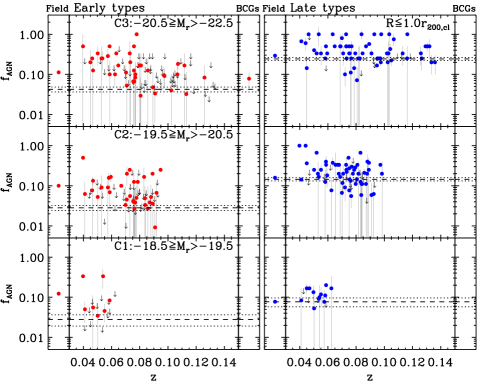
When we plot the variation of AGN fraction as a function of cluster redshift (Fig. 10), we do not see any significant dependence of on redshift. However, note that the redshift range in this study is much narrower than other studies that show a substantial increase of AGN fraction of cluster galaxies (e.g., in Martini et al. 2009 and Tomczak et al. 2011).
3.3 Comparison of physical parameters between AGN hosts and non-AGN galaxies
Figure 11 shows -band absolute magnitudes of AGN hosts and non-AGN galaxies in a volume-limited sample of and . The lines with error bars are median values as a function of . The BCGs, marked as crosses, are not used in calculating median values. It is seen that absolute magnitudes for both AGN hosts and non-AGN galaxies do not change much with the clustercentric radius. We call non-AGN galaxies those objects whose optical spectral types are star-forming, ambiguous galaxies, or undetermined. Interestingly, AGN host galaxies are systematically brighter than non-AGN galaxies by and mag for early and late types, respectively.
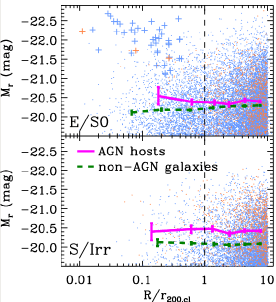
In Fig. 12, we plot () color, SFR, and () color gradient of AGN hosts and non-AGN galaxies divided into two morphology and three magnitude bins as a function of . It is seen that () colors for AGN host galaxies do not change much as decreases regardless of the luminosity and morphology except for C2 late-type hosts. Comparison between AGN hosts and non-AGN galaxies shows that early-type AGN hosts tend to be bluer than early-type non-AGN galaxies at all clustercentric radii, while late-type AGN hosts are redder than late-type non-AGN galaxies, which is consistent with previous results (e.g., Kauffmann et al. 2003a; Choi et al. 2009; Schawinski et al. 2010b). However, the difference between AGN hosts and non-AGN galaxies is not significant for the brightest sample (C3).
The SFRs of late-type AGN hosts are not distinguishable from those of late-type non-AGN galaxies except for the brightest sample (C3) at the very inner center (). For early types, SFRs of AGN host galaxies seem to be larger than those of non-AGN galaxies at all clustercentric radii, but the difference for the brightest sample (C3) is small.
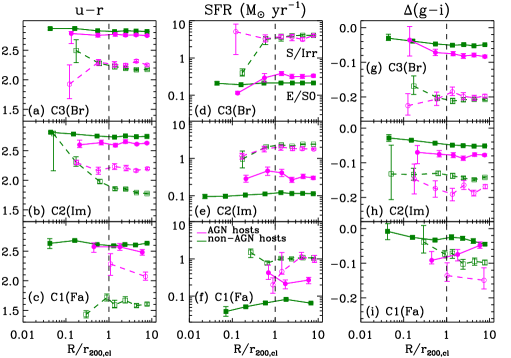
() color gradients for non-AGN galaxies increases (redder core) as decreases, while the dependence of those for AGN host galaxies on is very weak. Comparison between AGN hosts and non-AGN galaxies shows that the color gradients for early-type AGN hosts are smaller than those for early-type non-AGN galaxies, which might imply that the nuclear activity makes the galaxy core bluer.
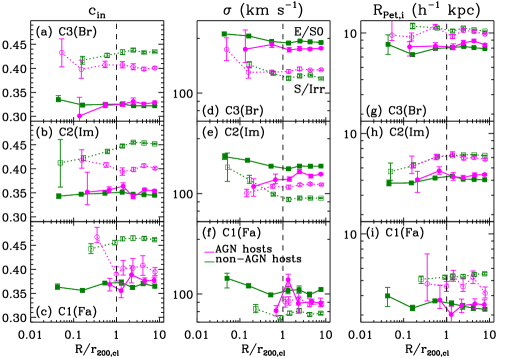
Figure 13 represents the structure parameters such as concentration index (), internal velocity dispersion (), and Petrosian radius in -band of AGN hosts and non-AGN galaxies divided into two morphology and three magnitude bins as a function of .
The left column of Fig. 13 does not show any noticeable change in the concentration index of AGN host galaxies with the clustercentric radius. Comparison of AGN hosts with non-AGN galaxies shows that late-type AGN hosts are more likely centrally concentrated (i.e. is smaller) than late-type non-AGN galaxies. However, any significant difference is not seen for early-type galaxies.
It is seen that internal velocity dispersions of non-AGN galaxies increase as decreasing within the cluster region, but AGN hosts do not show a similar behavior. The velocity dispersions for early-type AGN hosts, on average, appear to be marginally smaller than those for early-type non-AGN galaxies, but those for late-type AGN hosts tend to be larger than those for late-type non-AGN galaxies.
In the right column of Fig. 13, we do not see any noticeable change of Petrosian radius of AGN host galaxies with and any significant difference between AGN hosts and non-AGN galaxies.
In summary, the difference in physical parameters such as () colors, SFRs, and () color gradients between AGN hosts and non-AGN galaxies seems to exist for both early and late types at all clustercentric radii, while the difference in structure parameters between the two is significant only for late types. However, the dependence of these parameters for AGN host galaxies on the clustercentric radius is not clearly distinguishable from that for non-AGN galaxies.
In particular, the difference in concentration index and internal velocity dispersion between late-type, AGN hosts and non-AGN galaxies (Fig. 13), are significant at all clustercentric radii, while early types do not show any noticeable difference (see also Choi et al. 2009). This seems to be consistent with the idea that massive bulges that are highly concentrated compared to disks and have high velocity dispersions, are necessary for having SMBHs and their activity (Ferrarese & Merritt 2000; Gebhardt et al. 2000).
4 Discussion
4.1 Activity in galactic nuclei in galaxy clusters and in the field
From a point of view of fuel supply to AGNs, it is important to know the gas content of cluster and field galaxies in order to understand the difference between the two. For example, it was known that the molecular gas content of cluster, late-type galaxies is not different from that of field, late-type galaxies (Boselli & Gavazzi 2006 and references therein). This is similarly found for early-type galaxies (Young et al. 2011). However, the atomic gas content of cluster galaxies is found to be lower than that of field galaxies (e.g. Davies & Lewis 1973; di Serego Alighieri et al. 2007). This is generally interpreted as that the molecular gas that is denser and more deeply embedded in a galaxy potential well than the atomic gas, is not easily removed by any cluster-related stripping mechanism (see Boselli & Gavazzi 2006 for a review).
In the previous section, we found that the AGN fraction of early-type galaxies starts to decrease around as decreasing clustercentric radius, and AGN fractions of early-type cluster galaxies () are, on average, lower than those of field galaxies by a factor of (see Figs. 5 and 9), which is consistent with previous studies (e.g. Arnold et al. 2009; von der Linden et al. 2010). On the other hand, the AGN fractions of late types decrease much closer to the cluster center () than those of early types, and the AGN fractions of late-type cluster galaxies are, on average, not different from mean AGN fractions of field late types.
Firstly, the gradual decline of the AGN fraction in both types means that the effects of physical mechanisms on triggering (quenching) the activity in galactic nuclei are inefficient (stronger) in the central region of clusters. Secondly, the different behavior of the AGN fraction depending on the morphology of host galaxy, indicates an important role of host morphology in the nuclear activity, especially for cluster galaxies. Cluster galaxies make orbital motions in a cluster potential, but their orbits are known to be different depending on galaxy morphology (Biviano & Katgert 2004; Hwang & Lee 2008). For example, early-type cluster galaxies are found to be in isotropic orbits, being in equilibrium in the cluster potential through several orbiting motions in the past, which results in no cold gas (atomic and molecular gas) left in them. On the other hand, late-type galaxies are in radial orbits, which suggests that they enter the cluster region recently. Therefore, their cold gas (mainly molecular gas) may not be stripped or consumed yet, and they can still feed their SMBHs as in the field (Martini et al. 2009; Haggard et al. 2010).
Interestingly, we found the anti-correlation between and in clusters as seen in previous studies (e.g., Popesso & Biviano 2006; Arnold et al. 2009), but for all subsamples divided by morphology and luminosity of host galaxies. Since we fix the host morphology and luminosity, this anti-correlation is not simply due to the different morphological mix depending on the environment. This result can be explained if AGNs are triggered through galaxy-galaxy interactions and mergers because the probability for galaxy-galaxy interactions and mergers is expected to be low when the relative velocity between galaxies is high in massive clusters having large velocity dispersions (e.g., Mamon 1992; Ghigna et al. 1998; Hopkins et al. 2008b, a). It is also consistent with the result that galaxies in more X-ray luminous clusters have less cold gas that is necessary for feeding SMBHs (e.g., Giovanelli & Haynes 1985).
This interaction induced nuclear activity can also explain the decrease of the AGN fraction as decreasing clustercentric radius seen in Fig. 5 as follows. As galaxies with SMBHs approach the cluster center, the probability for galaxies to interact with other “late-type” galaxies decreases, which is necessary for making the SMBHs active. Similarly, as galaxies approach the cluster center, they experience continuous interactions with other galaxies (mostly early types) because the virial radii of galaxies all overlap with one another within the viral radius of cluster (see Fig. 6). Then the nearest neighbors (mostly early types) may have left significant cumulative effects of decreasing activity in galactic nuclei (to be discussed in §4.2). The amount of the cumulative effects increases monotonically as the clustercentric radius decreases, which can produce the trend seen in Fig. 5.
Interestingly, the AGN fraction of BCGs is found to be marginally higher than that of other cluster galaxies with similar luminosities (see top left panel in Fig. 9) even if they are all early types, but be slightly lower than that of field early-type galaxies. Previously, it was suggested based on SDSS C4 cluster catalog (Miller et al. 2005) that BCGs are more likely to host radio-loud AGNs, but less likely to host (powerful) optical AGNs than other galaxies with similar masses (e.g., Best et al. 2007; von der Linden et al. 2007). The different results between this and their studies might be due to a different mass range of cluster sample (our Abell clusters are, on average, more massive than C4 clusters, and in fact three out of five BCGs with the activity in galactic nuclei in C3 sample are found in clusters with km s-1), a different morphological galaxy sample (galaxies are compared by fixing morphology in this study), and/or a different comparison sample of BCGs (we divided the comparison sample into two: field and other cluster galaxies). On the other hand, the result in this study is consistent with that in previous studies in the sense of enhanced nuclear activity of BCGs compared to other cluster galaxies, which may be directly related to the cooling of X-ray gas at the cluster center (e.g., Burns 1990; Best et al. 2007; Edwards et al. 2007; Sanderson et al. 2009). However, among five clusters with the activity in galactic nuclei of BCGs in this study (A795, A1171, A1213, A1668, and A1991), there is clear evidence of cooling flow for only one cluster (A1991; Sharma et al. 2004).
4.2 What triggers activity in galactic nuclei?
When we consider the dependence of AGN fraction on the nearest neighbor galaxies as well as clusters, the activity in galactic nuclei outside the cluster virial radius (i.e. in the field) is found to be determined strongly by the morphology of and distance to the nearest neighbor when morphology and luminosity of host galaxy are fixed (see Fig. 6; Choi et al. in prep.). When the nearest neighbor of a galaxy is an early type (E-e and L-e case), the AGN fraction decreases as the pair separation decreases at . However, if the neighbor is a late type (E-l and L-l case), it does not change much at but reaches a maximum at . This dependence of on the morphology of and the distance to the nearest neighbor galaxy in the field, can support the idea that AGNs are triggered by galaxy-galaxy interactions and mergers.
In particular, the different behavior of depending on the morphology of the nearest neighbor starts to be seen at where the galaxies in pair start to interact hydrodynamically (Park et al. 2008). This can imply that hydrodynamic interactions with the nearest neighbor play important roles in triggering nuclear activity in addition to the tidal interactions. If a galaxy with a SMBH approaches a late-type neighbor within the virial radius of the neighbor, the inflow of cold gas from the neighbor into the target galaxy increases and the SMBH starts to accrete the gas and to be active. The crossing time of galaxies across the virial radius is of an order of yrs, which is much shorter than the age of the universe. Therefore, this inflow is expected to occur for yrs, which is also seen in the simulations (e.g., Hopkins et al. 2008b). The mass transfer between galaxies in pair is usually observed in close pairs with a pair separation of 30 kpc (e.g., Kewley et al. 2010; Font et al. 2011). There are some candidates found in the SDSS images with large pair separations (see Fig. 4 in Park et al. 2008). Moreover, there is a known ultraluminous infrared galaxy with a pair separation of 90kpc, which shows nuclear activity and large tidal features (IRAS 11223-1244; Kim et al. 2002), which also supports our argument.
On the other hand, if an early-type galaxy approaches an early-type neighbor within the virial radius of the neighbor even if it has a SMBH, the engine (SMBH) would not be ignited due to the lack of fuel (gas supply), which results in the low value of . When a late-type galaxy with a SMBH approaches an early-type neighbor within the virial radius of the neighbor, the activity in galactic nuclei can be sustained since the gravitational interaction with the neighbor makes the gas in the host galaxy move toward the center to feed SMBH even if there is no gas inflow from the neighbor. Therefore, if we do not consider the morphology of target and neighbor galaxies, the different role of galaxy morphology will be averaged out. This can explain why the dependence of AGN fraction on the distance to the neighbor galaxies is not seen in some previous studies.
Within the cluster region of , galaxies start to be affected by the cluster itself and its member galaxies. The cluster galaxies are expected to experience repeated gravitational or hydrodynamical interactions with other galaxies (and with cluster itself) as they make trapped orbital motions within the cluster (see Park & Hwang 2009; Boselli & Gavazzi 2006 for a review). However, the orbital velocity of cluster galaxies are very high and the tidal energy deposit during the short encounters is too small to significantly affect galaxy properties (Merritt 1984; Byrd & Valtonen 1990; Park & Hwang 2009). Therefore, though cluster galaxies are found to have current close neighbor galaxies, galaxy properties that we observe now may reflect the cumulative gravitational or hydrodynamical effects that they have experienced during the orbital motion. This can weaken the dependence of galaxy properties on the nearest neighbor galaxies in the cluster region, and may explain why of cluster galaxies (at ) does not increase unlike field galaxies when they approach “late-type” neighbors at as seen in right panels of Fig. 6. They might have experienced several gravitational or hydrodynamical interactions with cluster galaxies that are mainly early types, which results in the lack of gas to feed SMBHs.
5 Conclusions
Using the SDSS data, we have studied the environmental dependence of the activity in galactic nuclei by comparing cluster and field galaxies, and have compared the galaxy properties of AGN hosts and non-AGN galaxies. Our main results follow.
-
1.
The AGN fraction of early-type galaxies starts to decrease around one virial radius of clusters as decreasing clustercentric radius, while that of late types starts to decrease close to the cluster center ().
-
2.
When we consider the dependence of AGN fraction not only on the clustercentric radius but also on the morphology of and the distance to the nearest neighbor, it appears to depend on both quantities in cluster regions. On the other hand, in the field, the AGN fraction is found to depend strongly on the morphology of and the distance to the nearest neighbor galaxy when morphology and luminosity of host galaxy are fixed.
-
3.
The AGN fractions of early-type cluster galaxies, on average, are lower than those of early-type field galaxies by a factor for all luminosity subsamples. However, mean AGN fractions of late-type cluster galaxies are not different from those of late-type field galaxies. The different accretion history between early and late types might explain this difference.
-
4.
We found the anti-correlation between and in clusters for all subsamples divided by morphology and luminosity of host galaxies.
-
5.
The difference in physical parameters such as luminosity, () colors, SFRs, and () color gradients between AGN hosts and non-AGN galaxies is seen for both early and late types at all clustercentric radii, while the difference in structure parameters between the two is significant only for late types. However, the changes of these parameters of AGN host galaxies with the clustercentric radius are not clearly distinguishable from those of non-AGN galaxies.
-
6.
(AGN power indicator) for late types, on average, is larger than those for early types with similar luminosities. It is also found that the AGN power is weakly dependent on the clustercentric radius, but strongly dependent on the mass of host galaxies.
-
7.
The AGN fraction of early-type BCGs is found to be marginally higher than that of other early-type cluster galaxies with similar luminosities, but be slightly smaller than that of early-type field galaxies. The enhanced nuclear activity of BCGs compared to other cluster galaxies may be related to the cooling of X-ray gas at the cluster center.
Our results are consistent with the idea that the activity in galactic nuclei is triggered through galaxy-galaxy interactions and mergers when the fuel (gas supply) for AGN is available.
Acknowledgements.
We would like to thank the anonymous referee for constructive comments that helped improving the paper, and R. Gobat, J. Mullaney, and G.-H. Lee for useful discussion. H.S.H. acknowledges the Centre National d‘Etudes Spatiales (CNES) and the Smithsonian Institution for the support of his post-doctoral fellowship. D.E. acknowledges the support of the Centre National d‘Etudes Spatiales (CNES). Funding for the SDSS and SDSS-II has been provided by the Alfred P. Sloan Foundation, the Participating Institutions, the National Science Foundation, the U.S. Department of Energy, the National Aeronautics and Space Administration, the Japanese Monbukagakusho, the Max Planck Society, and the Higher Education Funding Council for England. The SDSS Web Site is http://www.sdss.org/. The SDSS is managed by the Astrophysical Research Consortium for the Participating Institutions. The Participating Institutions are the American Museum of Natural History, Astrophysical Institute Potsdam, University of Basel, Cambridge University, Case Western Reserve University, University of Chicago, Drexel University, Fermilab, the Institute for Advanced Study, the Japan Participation Group, Johns Hopkins University, the Joint Institute for Nuclear Astrophysics, the Kavli Institute for Particle Astrophysics and Cosmology, the Korean Scientist Group, the Chinese Academy of Sciences (LAMOST), Los Alamos National Laboratory, the Max-Planck-Institute for Astronomy (MPIA), the Max-Planck-Institute for Astrophysics (MPA), New Mexico State University, Ohio State University, University of Pittsburgh, University of Portsmouth, Princeton University, the United States Naval Observatory, and the University of Washington. This research has made use of the NASA/IPAC Extragalactic Database (NED) which is operated by the Jet Propulsion Laboratory, California Institute of Technology, under contract with the National Aeronautics and Space Administration.References
- Abazajian et al. (2009) Abazajian, K. N., Adelman-McCarthy, J. K., Agüeros, M. A., et al. 2009, ApJS, 182, 543
- Abell et al. (1989) Abell, G. O., Corwin, Jr., H. G., & Olowin, R. P. 1989, ApJS, 70, 1
- Arnold et al. (2009) Arnold, T. J., Martini, P., Mulchaey, J. S., Berti, A., & Jeltema, T. E. 2009, ApJ, 707, 1691
- Atlee et al. (2011) Atlee, D. W., Martini, P., Assef, R. J., Kelson, D. D., & Mulchaey, J. S. 2011, ApJ, 729, 22
- Baldwin et al. (1981) Baldwin, J. A., Phillips, M. M., & Terlevich, R. 1981, PASP, 93, 5
- Barnes & Hernquist (1992) Barnes, J. E. & Hernquist, L. 1992, ARA&A, 30, 705
- Best (2004) Best, P. N. 2004, MNRAS, 351, 70
- Best et al. (2005) Best, P. N., Kauffmann, G., Heckman, T. M., et al. 2005, MNRAS, 362, 25
- Best et al. (2007) Best, P. N., von der Linden, A., Kauffmann, G., Heckman, T. M., & Kaiser, C. R. 2007, MNRAS, 379, 894
- Biviano & Katgert (2004) Biviano, A. & Katgert, P. 2004, A&A, 424, 779
- Blanton & Roweis (2007) Blanton, M. R. & Roweis, S. 2007, AJ, 133, 734
- Boselli & Gavazzi (2006) Boselli, A. & Gavazzi, G. 2006, PASP, 118, 517
- Brinchmann et al. (2004) Brinchmann, J., Charlot, S., White, S. D. M., et al. 2004, MNRAS, 351, 1151
- Bruzual & Charlot (2003) Bruzual, G. & Charlot, S. 2003, MNRAS, 344, 1000
- Burns (1990) Burns, J. O. 1990, AJ, 99, 14
- Butcher & Oemler (1984) Butcher, H. & Oemler, Jr., A. 1984, ApJ, 285, 426
- Byrd & Valtonen (1990) Byrd, G. & Valtonen, M. 1990, ApJ, 350, 89
- Cappellari et al. (2006) Cappellari, M., Bacon, R., Bureau, M., et al. 2006, MNRAS, 366, 1126
- Carlberg et al. (1997) Carlberg, R. G., Yee, H. K. C., & Ellingson, E. 1997, ApJ, 478, 462
- Cervantes-Sodi et al. (2011) Cervantes-Sodi, B., Park, C., Hernandez, X., & Hwang, H. S. 2011, MNRAS, 414, 587
- Choi et al. (2010) Choi, Y., Han, D., & Kim, S. S. 2010, Journal of Korean Astronomical Society, 43, 191
- Choi et al. (2007) Choi, Y., Park, C., & Vogeley, M. S. 2007, ApJ, 658, 884
- Choi et al. (2009) Choi, Y., Woo, J., & Park, C. 2009, ApJ, 699, 1679
- Ciotti & Ostriker (2007) Ciotti, L. & Ostriker, J. P. 2007, ApJ, 665, 1038
- Cisternas et al. (2011) Cisternas, M., Jahnke, K., Inskip, K. J., et al. 2011, ApJ, 726, 57
- Colless et al. (2001) Colless, M., Dalton, G., Maddox, S., et al. 2001, MNRAS, 328, 1039
- Combes (2003) Combes, F. 2003, in Astronomical Society of the Pacific Conference Series, Vol. 290, Active Galactic Nuclei: From Central Engine to Host Galaxy, ed. S. Collin, F. Combes, & I. Shlosman, 411–+
- Comerford et al. (2009) Comerford, J. M., Gerke, B. F., Newman, J. A., et al. 2009, ApJ, 698, 956
- Constantin et al. (2008a) Constantin, A., Hoyle, F., & Vogeley, M. S. 2008a, ApJ, 673, 715
- Constantin et al. (2008b) Constantin, A., Hoyle, F., & Vogeley, M. S. 2008b, ApJ, 673, 715
- Dahari (1984) Dahari, O. 1984, AJ, 89, 966
- Dahari (1985) Dahari, O. 1985, ApJS, 57, 643
- Darg et al. (2010) Darg, D. W., Kaviraj, S., Lintott, C. J., et al. 2010, MNRAS, 401, 1552
- Davies & Lewis (1973) Davies, R. D. & Lewis, B. M. 1973, MNRAS, 165, 231
- De Robertis et al. (1998) De Robertis, M. M., Yee, H. K. C., & Hayhoe, K. 1998, ApJ, 496, 93
- Di Matteo et al. (2005) Di Matteo, T., Springel, V., & Hernquist, L. 2005, Nature, 433, 604
- di Serego Alighieri et al. (2007) di Serego Alighieri, S., Gavazzi, G., Giovanardi, C., et al. 2007, A&A, 474, 851
- Domingue et al. (2005) Domingue, D. L., Sulentic, J. W., & Durbala, A. 2005, AJ, 129, 2579
- Dressler et al. (1985) Dressler, A., Thompson, I. B., & Shectman, S. A. 1985, ApJ, 288, 481
- Dultzin-Hacyan et al. (1999) Dultzin-Hacyan, D., Krongold, Y., Fuentes-Guridi, I., & Marziani, P. 1999, ApJ, 513, L111
- Eastman et al. (2007) Eastman, J., Martini, P., Sivakoff, G., et al. 2007, ApJ, 664, L9
- Edwards et al. (2007) Edwards, L. O. V., Hudson, M. J., Balogh, M. L., & Smith, R. J. 2007, MNRAS, 379, 100
- Elbaz et al. (2007) Elbaz, D., Daddi, E., Le Borgne, D., et al. 2007, A&A, 468, 33
- Ellison et al. (2011) Ellison, S. L., Patton, D. R., Mendel, J. T., & Scudder, J. M. 2011, MNRAS, in press (arXiv:1108.2711), 1541
- Ellison et al. (2008) Ellison, S. L., Patton, D. R., Simard, L., & McConnachie, A. W. 2008, AJ, 135, 1877
- Fadda et al. (1996) Fadda, D., Girardi, M., Giuricin, G., Mardirossian, F., & Mezzetti, M. 1996, ApJ, 473, 670
- Ferrarese & Merritt (2000) Ferrarese, L. & Merritt, D. 2000, ApJ, 539, L9
- Font et al. (2011) Font, J., Beckman, J. E., Rosado, M., et al. 2011, ApJ, 740, L1+
- Fuentes-Williams & Stocke (1988) Fuentes-Williams, T. & Stocke, J. T. 1988, AJ, 96, 1235
- Gabor et al. (2009) Gabor, J. M., Impey, C. D., Jahnke, K., et al. 2009, ApJ, 691, 705
- Galametz et al. (2009) Galametz, A., Stern, D., Eisenhardt, P. R. M., et al. 2009, ApJ, 694, 1309
- Gebhardt et al. (2000) Gebhardt, K., Bender, R., Bower, G., et al. 2000, ApJ, 539, L13
- Georgakakis et al. (2009) Georgakakis, A., Coil, A. L., Laird, E. S., et al. 2009, MNRAS, 397, 623
- Ghigna et al. (1998) Ghigna, S., Moore, B., Governato, F., et al. 1998, MNRAS, 300, 146
- Gilmour et al. (2009) Gilmour, R., Best, P., & Almaini, O. 2009, MNRAS, 392, 1509
- Giovanelli & Haynes (1985) Giovanelli, R. & Haynes, M. P. 1985, ApJ, 292, 404
- Gisler (1978) Gisler, G. R. 1978, MNRAS, 183, 633
- González-Martín et al. (2009) González-Martín, O., Masegosa, J., Márquez, I., Guainazzi, M., & Jiménez-Bailón, E. 2009, A&A, 506, 1107
- Grogin et al. (2005) Grogin, N. A., Conselice, C. J., Chatzichristou, E., et al. 2005, ApJ, 627, L97
- Gültekin et al. (2009) Gültekin, K., Richstone, D. O., Gebhardt, K., et al. 2009, ApJ, 698, 198
- Haggard et al. (2010) Haggard, D., Green, P. J., Anderson, S. F., et al. 2010, ApJ, 723, 1447
- Heckman et al. (2004) Heckman, T. M., Kauffmann, G., Brinchmann, J., et al. 2004, ApJ, 613, 109
- Heckman et al. (2005) Heckman, T. M., Ptak, A., Hornschemeier, A., & Kauffmann, G. 2005, ApJ, 634, 161
- Heckman et al. (1986) Heckman, T. M., Smith, E. P., Baum, S. A., et al. 1986, ApJ, 311, 526
- Ho (2008) Ho, L. C. 2008, ARA&A, 46, 475
- Hopkins et al. (2008a) Hopkins, P. F., Cox, T. J., Kereš, D., & Hernquist, L. 2008a, ApJS, 175, 390
- Hopkins et al. (2006) Hopkins, P. F., Hernquist, L., Cox, T. J., et al. 2006, ApJS, 163, 1
- Hopkins et al. (2008b) Hopkins, P. F., Hernquist, L., Cox, T. J., & Kereš, D. 2008b, ApJS, 175, 356
- Hwang et al. (2011) Hwang, H. S., Elbaz, D., Dickinson, M., et al. 2011, A&A, in press (ArXiv:1109.1937)
- Hwang et al. (2010) Hwang, H. S., Elbaz, D., Lee, J. C., et al. 2010, A&A, 522, A33
- Hwang & Lee (2008) Hwang, H. S. & Lee, M. G. 2008, ApJ, 676, 218
- Hwang & Lee (2009) Hwang, H. S. & Lee, M. G. 2009, MNRAS, 397, 2111
- Hwang & Park (2009) Hwang, H. S. & Park, C. 2009, ApJ, 700, 791
- Hwang & Park (2010) Hwang, H. S. & Park, C. 2010, ApJ, 720, 522
- Jogee (2006) Jogee, S. 2006, in Lecture Notes in Physics, Berlin Springer Verlag, Vol. 693, Physics of Active Galactic Nuclei at all Scales, ed. D. Alloin, 143–+
- Johnson et al. (2003) Johnson, O., Best, P. N., & Almaini, O. 2003, MNRAS, 343, 924
- Kauffmann et al. (2003a) Kauffmann, G., Heckman, T. M., Tremonti, C., et al. 2003a, MNRAS, 346, 1055
- Kauffmann et al. (2003b) Kauffmann, G., Heckman, T. M., White, S. D. M., et al. 2003b, MNRAS, 341, 33
- Kauffmann et al. (2004) Kauffmann, G., White, S. D. M., Heckman, T. M., et al. 2004, MNRAS, 353, 713
- Keel (1996) Keel, W. C. 1996, AJ, 111, 696
- Keel et al. (1985) Keel, W. C., Kennicutt, Jr., R. C., Hummel, E., & van der Hulst, J. M. 1985, AJ, 90, 708
- Kewley et al. (2001) Kewley, L. J., Dopita, M. A., Sutherland, R. S., Heisler, C. A., & Trevena, J. 2001, ApJ, 556, 121
- Kewley et al. (2006) Kewley, L. J., Groves, B., Kauffmann, G., & Heckman, T. 2006, MNRAS, 372, 961
- Kewley et al. (2010) Kewley, L. J., Rupke, D., Zahid, H. J., Geller, M. J., & Barton, E. J. 2010, ApJ, 721, L48
- Kim et al. (2002) Kim, D., Veilleux, S., & Sanders, D. B. 2002, ApJS, 143, 277
- Kormendy & Kennicutt (2004) Kormendy, J. & Kennicutt, Jr., R. C. 2004, ARA&A, 42, 603
- Koss et al. (2010) Koss, M., Mushotzky, R., Veilleux, S., & Winter, L. 2010, ApJ, 716, L125
- Koulouridis & Plionis (2010) Koulouridis, E. & Plionis, M. 2010, ApJ, 714, L181
- Koulouridis et al. (2006) Koulouridis, E., Plionis, M., Chavushyan, V., et al. 2006, ApJ, 639, 37
- Kroupa (2001) Kroupa, P. 2001, MNRAS, 322, 231
- Kuo et al. (2008) Kuo, C., Lim, J., Tang, Y., & Ho, P. T. P. 2008, ApJ, 679, 1047
- Laurikainen & Salo (1995) Laurikainen, E. & Salo, H. 1995, A&A, 293, 683
- Laurikainen et al. (1994) Laurikainen, E., Salo, H., Teerikorpi, P., & Petrov, G. 1994, A&AS, 108, 491
- Lee et al. (2011a) Lee, G.-H., Park, C., Lee, M. G., & Choi, Y.-Y. 2011a, ApJ, in press (arXiv:1110.1933)
- Lee et al. (2011b) Lee, G.-H. et al. 2011b, ApJ, submitted
- Lee et al. (2010) Lee, J. H., Lee, M. G., Park, C., & Choi, Y.-Y. 2010, MNRAS, 403, 1930
- Li et al. (2008) Li, C., Kauffmann, G., Heckman, T. M., White, S. D. M., & Jing, Y. P. 2008, MNRAS, 385, 1915
- Lynden-Bell (1969) Lynden-Bell, D. 1969, Nature, 223, 690
- Malkan et al. (1998) Malkan, M. A., Gorjian, V., & Tam, R. 1998, ApJS, 117, 25
- Mamon (1992) Mamon, G. A. 1992, ApJ, 401, L3
- Martini et al. (2006) Martini, P., Kelson, D. D., Kim, E., Mulchaey, J. S., & Athey, A. A. 2006, ApJ, 644, 116
- Martini et al. (2009) Martini, P., Sivakoff, G. R., & Mulchaey, J. S. 2009, ApJ, 701, 66
- Merritt (1984) Merritt, D. 1984, ApJ, 276, 26
- Miller et al. (2003) Miller, C. J., Nichol, R. C., Gómez, P. L., Hopkins, A. M., & Bernardi, M. 2003, ApJ, 597, 142
- Miller et al. (2005) Miller, C. J., Nichol, R. C., Reichart, D., et al. 2005, AJ, 130, 968
- Montero-Dorta et al. (2009) Montero-Dorta, A. D., Croton, D. J., Yan, R., et al. 2009, MNRAS, 392, 125
- Mullaney et al. (2011) Mullaney, J. R., Pannella, M., Daddi, E., et al. 2011, MNRAS, in press (ArXiv:1106.4284)
- Osterbrock & Ferland (2006) Osterbrock, D. E. & Ferland, G. J. 2006, Astrophysics of gaseous nebulae and active galactic nuclei, ed. Osterbrock, D. E. & Ferland, G. J.
- Padilla et al. (2010) Padilla, N., Lambas, D. G., & González, R. 2010, MNRAS, 409, 936
- Park & Choi (2005) Park, C. & Choi, Y. 2005, ApJ, 635, L29
- Park & Choi (2009) Park, C. & Choi, Y. 2009, ApJ, 691, 1828
- Park et al. (2008) Park, C., Gott, J. R. I., & Choi, Y. 2008, ApJ, 674, 784
- Park & Hwang (2009) Park, C. & Hwang, H. S. 2009, ApJ, 699, 1595
- Peebles (1993) Peebles, P. J. E. 1993, Principles of physical cosmology, ed. P. J. E. Peebles
- Petrosian (1982) Petrosian, A. R. 1982, Astrofizika, 18, 548
- Pierce et al. (2007) Pierce, C. M., Lotz, J. M., Laird, E. S., et al. 2007, ApJ, 660, L19
- Popesso & Biviano (2006) Popesso, P. & Biviano, A. 2006, A&A, 460, L23
- Rogers et al. (2009) Rogers, B., Ferreras, I., Kaviraj, S., Pasquali, A., & Sarzi, M. 2009, MNRAS, 399, 2172
- Ruderman & Ebeling (2005) Ruderman, J. T. & Ebeling, H. 2005, ApJ, 623, L81
- Salpeter (1955) Salpeter, E. E. 1955, ApJ, 121, 161
- Sanders et al. (1988) Sanders, D. B., Soifer, B. T., Elias, J. H., et al. 1988, ApJ, 325, 74
- Sanderson et al. (2009) Sanderson, A. J. R., Edge, A. C., & Smith, G. P. 2009, MNRAS, 398, 1698
- Sarzi et al. (2010) Sarzi, M., Shields, J. C., Schawinski, K., et al. 2010, MNRAS, 402, 2187
- Schawinski et al. (2010a) Schawinski, K., Dowlin, N., Thomas, D., Urry, C. M., & Edmondson, E. 2010a, ApJ, 714, L108
- Schawinski et al. (2010b) Schawinski, K., Urry, C. M., Virani, S., et al. 2010b, ApJ, 711, 284
- Schlegel et al. (1998) Schlegel, D. J., Finkbeiner, D. P., & Davis, M. 1998, ApJ, 500, 525
- Schmitt (2001) Schmitt, H. R. 2001, AJ, 122, 2243
- Serber et al. (2006) Serber, W., Bahcall, N., Ménard, B., & Richards, G. 2006, ApJ, 643, 68
- Sharma et al. (2004) Sharma, M., McNamara, B. R., Nulsen, P. E. J., et al. 2004, ApJ, 613, 180
- Silverman et al. (2009) Silverman, J. D., Kovač, K., Knobel, C., et al. 2009, ApJ, 695, 171
- Silverman et al. (2011) Silverman, J. D. et al. 2011, ApJS, in press (arXiv:1109.1292)
- Slavcheva-Mihova & Mihov (2011) Slavcheva-Mihova, L. & Mihov, B. 2011, A&A, 526, A43
- Sorrentino et al. (2006) Sorrentino, G., Radovich, M., & Rifatto, A. 2006, A&A, 451, 809
- Springel et al. (2005) Springel, V., Di Matteo, T., & Hernquist, L. 2005, ApJ, 620, L79
- Stoughton et al. (2002) Stoughton, C., Lupton, R. H., Bernardi, M., et al. 2002, AJ, 123, 485
- Tal et al. (2009) Tal, T., van Dokkum, P. G., Nelan, J., & Bezanson, R. 2009, AJ, 138, 1417
- Tegmark et al. (2004) Tegmark, M., Blanton, M. R., Strauss, M. A., et al. 2004, ApJ, 606, 702
- Tomczak et al. (2011) Tomczak, A. R., Tran, K.-V. H., & Saintonge, A. 2011, ApJ, 738, 65
- Tremonti et al. (2004) Tremonti, C. A., Heckman, T. M., Kauffmann, G., et al. 2004, ApJ, 613, 898
- Trouille & Barger (2010) Trouille, L. & Barger, A. J. 2010, ApJ, 722, 212
- Urrutia et al. (2008) Urrutia, T., Lacy, M., & Becker, R. H. 2008, ApJ, 674, 80
- Veilleux & Osterbrock (1987) Veilleux, S. & Osterbrock, D. E. 1987, ApJS, 63, 295
- Virani et al. (2000) Virani, S. N., De Robertis, M. M., & VanDalfsen, M. L. 2000, AJ, 120, 1739
- von der Linden et al. (2007) von der Linden, A., Best, P. N., Kauffmann, G., & White, S. D. M. 2007, MNRAS, 379, 867
- von der Linden et al. (2010) von der Linden, A., Wild, V., Kauffmann, G., White, S. D. M., & Weinmann, S. 2010, MNRAS, 404, 1231
- Wada (2004) Wada, K. 2004, Coevolution of Black Holes and Galaxies, 186
- Wake et al. (2004) Wake, D. A., Miller, C. J., Di Matteo, T., et al. 2004, ApJ, 610, L85
- Waskett et al. (2005) Waskett, T. J., Eales, S. A., Gear, W. K., et al. 2005, MNRAS, 363, 801
- York et al. (2000) York, D. G., Adelman, J., Anderson, Jr., J. E., et al. 2000, AJ, 120, 1579
- Young et al. (2011) Young, L. M., Bureau, M., Davis, T. A., et al. 2011, MNRAS, 414, 940