Spectral Analysis within the Virtual Observatory:
The GAVO Service TheoSSA
Abstract
In the last decade, numerous Virtual Observatory organizations were established. One of these is the German Astrophysical Virtual Observatory (GAVO) that e.g. provides access to spectral energy distributions via the service TheoSSA. In a pilot phase, these are based on the Tübingen NLTE Model-Atmosphere Package (TMAP) and suitable for hot, compact stars. We demonstrate the power of TheoSSA in an application to the sdOB primary of AA Doradus by comparison with a “classical” spectral analysis.
1 Introduction
With the progress in observational and computer technology, the quantity of astronomical data was and is increasing exponentially. To be able to handle the actual and future amount of data, Virtual Observatories (VOs) were established. Their aims are to make the data globally accessible, to prevent losing data, and to develop tools, services, and standards to enable research using the internet. The idea of the VO is rather old, starting with the first databases and tools such as e.g. SIMBAD111http://simbad.u-strasbg.fr/simbad/, http://aladin.u-strasbg.fr/aladin.gml, http://iraf.noao.edu/ (1979), ALADIN1 (1999), or IRAF1 (1984). Since 2000 more and more national VOs were founded to make astronomical data accessible. Many of them joined the International Virtual Observatory Alliance222http://www.ivoa.net/ (IVOA). Observational and theoretical data sets were prevented from getting lost by making them public. Standards were defined to get a uniform shape of all data. Services and tools for data-handling were developed, and contact points were created to aid publishing data and using tools and services.
One of these national organizations is the German Astrophysical Virtual Observatory (GAVO333http://g-vo.org/), the German effort to contribute to this idea. Within the framework of a GAVO project, the well-established Tübingen NLTE Model-Atmosphere Package (TMAP,444http://astro.uni-tuebingen.de/TMAP Werner et al. 2003) was made accessible. This model-atmosphere code and the different ways to access its products are described in the following sections.
2 The Basis - The Tübingen NLTE Model-Atmosphere Package
TMAP is used to calculate stellar model atmospheres in hydrostatic and radiative equilibrium. It assumes plane-parallel geometry due to the relatively thin atmosphere of a hot, compact star compared to its radius. Up to about 1500 atomic levels can be treated in NLTE, about 4000 lines for classical model atoms and more than 200 millions of lines for iron-group elements (Ca-Ni) can be considered. Currently all elements from hydrogen to nickel can be considered (Rauch 2003). For the iron-group elements the program IrOnIc (Rauch & Deetjen 2003) is used to calculate sampled cross-sections and to set up atomic data files. This program is necessary to handle the hundreds of millions of lines of iron-group elements and to reduce them with a statistical treatment to a number suitable for the model atmosphere code.
TMAP is used for hot, compact objects with K and . The GAVO service TheoSSA is based on this model-atmosphere code at the moment.
3 Implementation - The VO Service TheoSSA
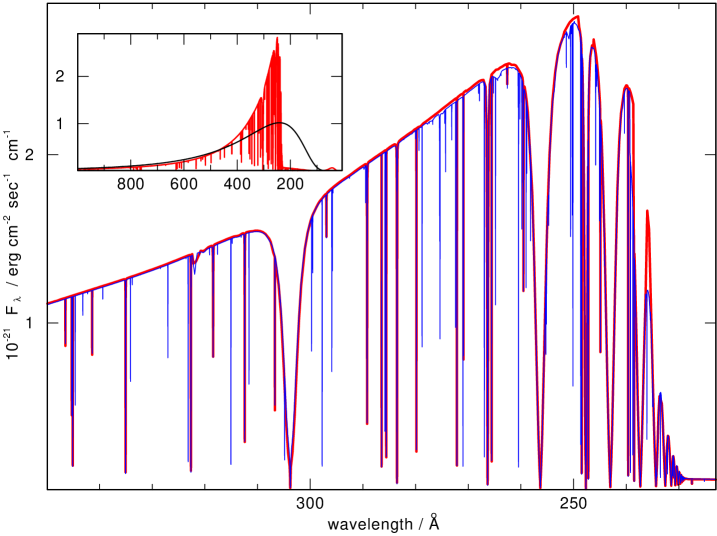
TheoSSA555http://dc.g-vo.de/theossa was originally planned to
provide spectral energy distributions (SEDs) as input for photoionization models for planetary nebulae (PNe).
For these models, blackbodies were used very often and, thus, such PN analyses yielded wrong results.
The blackbody approximation differs vastly from our model fluxes (Fig. 1). In order to supply
reliable ready-to-use SEDs this service gives access in three ways.
1) download already calculated SEDs
2) calculate individual SEDs with the simulation software
TMAW666http://astro.uni-tuebingen.de/TMAW
3) download ready-to-use atomic data or tailor individual model atoms with
TMAD777http://astro.uni-tuebingen.de/TMAD
The TheoSSA database is controlled via a web interface where the fundamental parameters (, abundances) are entered. Then all available SEDs within a chosen parameter range are displayed and can be downloaded. The database is growing in time, because SEDs calculated with TMAW are automatically ingested. In case that the calculation procedure is significantly changed, these SEDs are re-calculated with the latest TMAW version.
4 More Detailed/Individual SEDs - TMAW
TMAW is the simulation software of the model-atmosphere code. Like TheoSSA, it is controlled via web interface where the requested parameters and the email address are entered. The sending process starts the calculation of a SED with the requested parameters on the PC cluster of the Institute for Astronomy and Astrophysics Tübingen or, if the number of requests is , on compute resources of AstroGrid-D888http://www.gac-grid.net/.
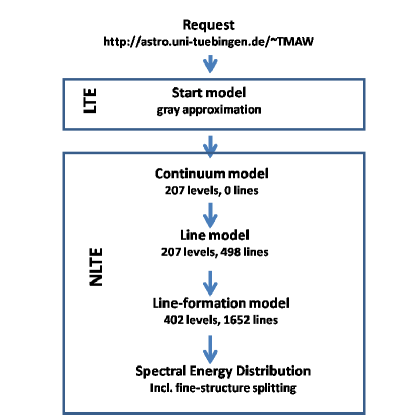
In the standard procedure, the steadily updated, ready-to-use model atoms from TMAD are taken as input and, after the LTE start model is created, a continuum model is calculated (Fig. 2). Then lines are inserted initially without temperature correction, then with Unsöld-Lucy temperature correction (Unsöld 1968). After about one or two days and at least 300 iterations, line profiles are calculated and the result is sent to the email address of the user.
At the moment, this service can consider the elements hydrogen, helium, carbon, nitrogen, and oxygen, but in the future the next most abundant elements, neon and magnesium (as well as the iron-group elements, Ca - Ni), will be included.
5 Creating The Model Atoms - TMAD
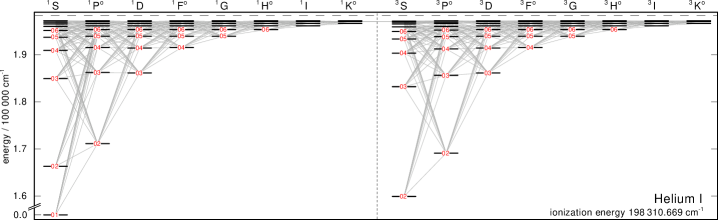
The Tübingen Model Atom Database (TMAD) was originally created for TMAP and therefore its format is compatible with it. It is updated regularly. For example the He i model atom was enlarged in the latest update due to recently published atomic data retrieved from NIST. Now levels up to a principal quantum number of instead of can be considered as NLTE levels (Fig. 3).
Presently, the elements H, He, C, N, O, F, Ne, Na, Mg, Si, S, Ar, and Ca are included. Main data sources for TMAD are the standard atomic databases like NIST999http://www.nist.gov/pml/data/asd.cfm or the Opacity Project101010http://cdsweb.u-strasbg.fr/topbase/op.html.
TMAD supplies two kinds of data. Level energies and radiative as well as collisional transitions can be found for model atmosphere and for SED calculations (the latter including fine-structure splitting). For model atmosphere calculations ready-to-use or individual data can be downloaded. This data is accessible to the community and can be used for all desired purposes, e.g. as input for another model-atmosphere code.
6 Handling Iron-Group Elements - IrOnIc
Another GAVO project is the parallelization of the IrOnIc code (Rauch & Deetjen 2003). Presently, it may take one to three days to calculate cross-sections and a model atom with IrOnIc. To accelerate, we write a new version of this code using MPI as well as GPU (CUDA) parallelization. This service will be controlled via a web interface in a similar way to TMAW and will be accessible to the public.
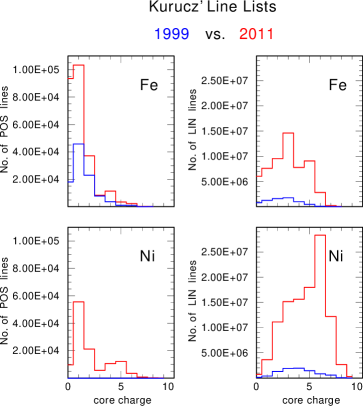
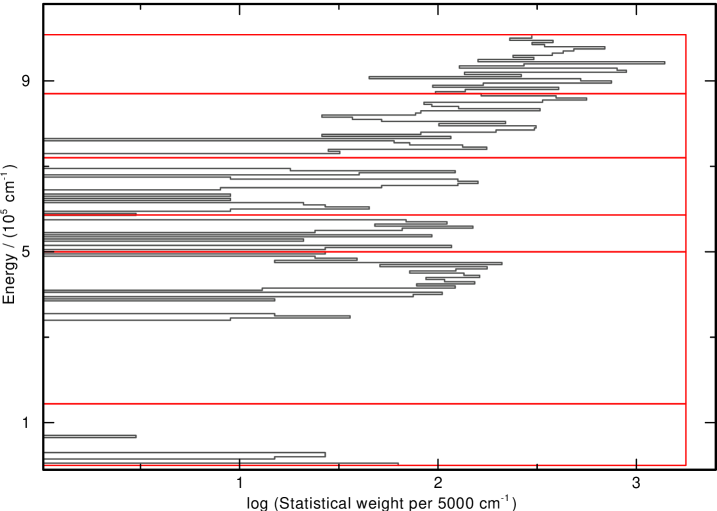
Input for the IrOnIc code are Kurucz’ line lists111111http://kurucz.harvard.edu/atoms.html These contain LIN and POS lines. The latter are only lines with measured (good) wavelengths, LIN lines have theoretically calculated entries additionally and therefore about 300 times more lines than POS lists. New data became available recently (Fig. 4, Kurucz 2009). Additional data sources are the OPACITY and IRON projects (Seaton et al. 1994; Hummer et al. 1993)
IrOnIc divides the energy range up to the ionization energy of an ion into several bands (Fig. 5). All levels within one band contribute to this so-called superlevel via defining its energy and statistical weight. This superlevels are treated in NLTE, the levels within one band are in LTE relation. Therefore the number of NLTE levels is reduced to a number manageable for the model atmosphere code. For all transitions within one band or between different bands, the cross-sections are sampled (Fig. 6).

7 A First Benchmark Test - The Case of AA Doradus
The initial aim of TheoSSA and TMAW was to provide easy access to synthetic stellar fluxes (Sect. 3) for the PNe community, which was interested in realistic stellar ionizing fluxes for their PN models. It turned out rather quickly, that other groups were interested in X-ray, optical, and infrared fluxes as well. TheoSSA / TMAW were then extended for this purpose. While the accuracy in ionizing fluxes is better than 10 % compared to TMAP (Sect. 2) calculations with the most detailed model atoms, the precision in the optical is limited due to the smaller, standard model atoms that are used in the TMAW model-atmosphere calculations. The aim is here to perform preliminary spectral analyses with TMAW SEDs and to be better than 20 % in , , and abundance determinations.
Publishing data of all kind is a very important task of the VO. For all these data, quality control should be a pre-requisite and is highly desirable. Therefore it is necessary to establish benchmark tests for VO data, services, and tools. This is essential for theoretical data and simulations as well.
7.1 AA Dor
The eclipsing, post common-envelope binary AA Dor has an sdOB star primary star whose optical spectrum shows the broad Balmer lines and the He ii 4686Å line, typical for this class. A recent analysis of the primary (Klepp & Rauch 2011) yielded and within small error limits. For this analysis, an extended grid of NLTE model atmospheres considering opacities of the elements H, He, C, N, O, Mg, Si, P, S, Ca, Sc, Ti, V, Cr, Mn, Fe, Co, and Ni was calculated. and were then determined by a -fit method based on synthetic spectra of these models and high-resolution and high-S/N optical UVES observations (cf. Rauch these proceedings).
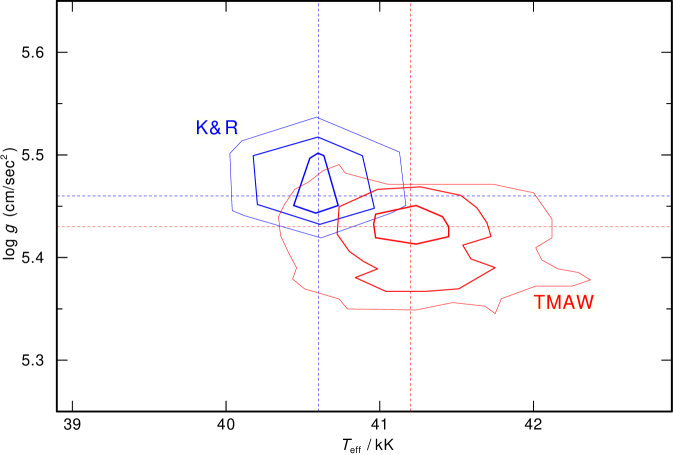
AA Dor is, thus, an ideal object to prove the TMAW service for its adequacy for spectral analysis. For this test, we recalculated the fine grid of Klepp & Rauch (2011) via TMAW (Fig. 2). We used their abundances, with K, and , with . In total, 527 HHeCNO-composed models were calculated in one week on compute resources of AstroGrid-D. Analogously to Klepp & Rauch (2011), we calculated synthetic spectra from these models and performed a fit to the UVES121212Ultraviolet and Visual Echelle Spectrograph at ESO’s VLT observations (ProgId 66.D180). Astonishingly, the result is very good (Fig. 7). We arrive at and while the fit of Klepp & Rauch (2011) results in and . This are deviations of about 1 % in and 7 % in , which is better than our expectation. The wider and irregular contour lines of the TMAW-based fit (Fig. 7) are due to the fact that only about 300 iterations were performed in contrast to about 8000/model in the grid of Klepp & Rauch (2011) and, thus, the TMAW models are not homogeneously converged.
7.2 Conclusion and further improvements
The example of AA Dor shows clearly, that TMAW models are well suited for the spectral analysis of optical spectra. The calculation times for grids via TMAW are small because of the AstroGrid-D computational power in the background. However, with some improvements, we enhanced the reliability of TMAW models.
To ensure a reasonable calculation time, TMAW uses adjusted, relatively small model atoms (e.g. 207 NLTE levels and 498 lines, Sect. 4) and the Unsöld-Lucy temperature correction (Unsöld 1968). This temperature correction is numerically stable, but the structure differs from one calculated with standard corrections (Fig. 8). Although both structures mainly agree in the line-forming regions, the deviations are not negligible. At , the temperature structures differ more strongly (Fig. 8) due to the iron-group opacities that are considered in the TMAP models. Iron-group opacities will be considered by TMAW in the near future.
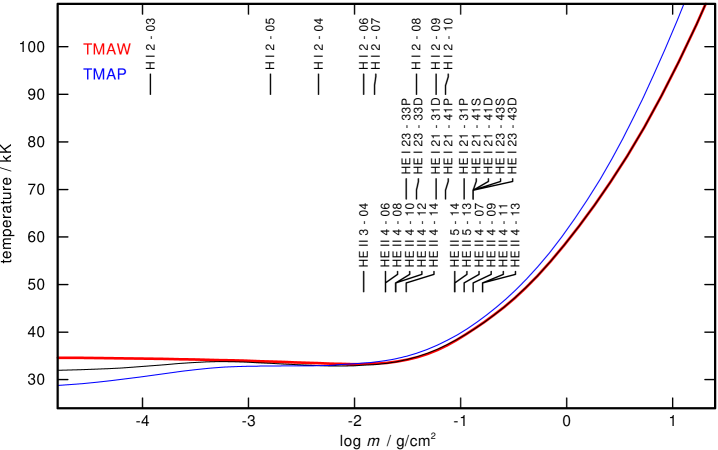
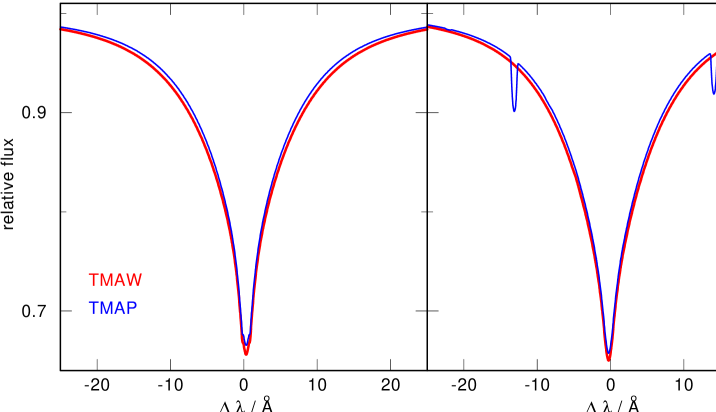
To compensate this deficiency, we included additional calculation steps, first using the standard temperature correction applied by TMAP and then increasing the number of atomic levels in a subsequent line-formation step by using far more detailed model atoms (402 NLTE levels and 1652 lines in this example). The result is shown in Fig. 9. With these improvements, the accuracy is improved and the calculation time rises only slightly.
Acknowledgments
This work is supported by the Federal Ministry of Education and Research (BMBF) under grant 05A11VTB. The UVES spectra used in this analysis were obtained as part of an ESO Service Mode run, proposal 66.D-1800. The TMAW service (http://astro-uni-tuebingen.de/ TMAW) used to calculate theoretical spectra for this paper was constructed as part of the activities of the German Astrophysical Virtual Observatory.
References
- Hummer et al. (1993) Hummer, D. G., Berrington, K. A., Eissner, W., et al. 1993, A&A, 279, 298
- Klepp & Rauch (2011) Klepp, S., & Rauch, T. 2011, A&A, 531, L7
- Kurucz (2009) Kurucz, R. L. 2009, in: Recent Directions in Astrophysical Quantitative Spectroscopy and Radiation Dynamics, eds. I. Hubeny, J. M. Stone, K. MacGregor, & K. Werner, AIP-CS 1171, 43
- Rauch (2003) Rauch, T. 2003, A&A, 403, 709
- Rauch & Deetjen (2003) Rauch, T., & Deetjen, J. L. 2003, in: Stellar Atmosphere Modeling, eds. I. Hubeny, D. Mihalas, K. Werner, ASP-CS, 288, 103
- Seaton et al. (1994) Seaton, M. J., Yan, Y., Mihalas, D., & Pradhan, A. K. 1994, MNRAS, 266, 805
- Unsöld (1968) Unsöld, A. 1968, Physik der Sternatmosphären, 2nd edition, Springer (Berlin)
- Werner et al. (2003) Werner, K., Dreizler, S., Deetjen, J. L., Nagel, T., Rauch, T., & Schuh, S. L. 2003, in: Stellar Atmosphere Modeling, eds. I. Hubeny, D. Mihalas, K. Werner, ASP-CS, 288, 31